Adobe Stock vs Figma Stock Forecast: ADBE $356 vs FIG $69
Adobe offers scale and profit with AI Firefly, while Figma shows hyper-growth but trades at premium multiples and faces insider unlock risk in 2026 | That's TradingNEWS
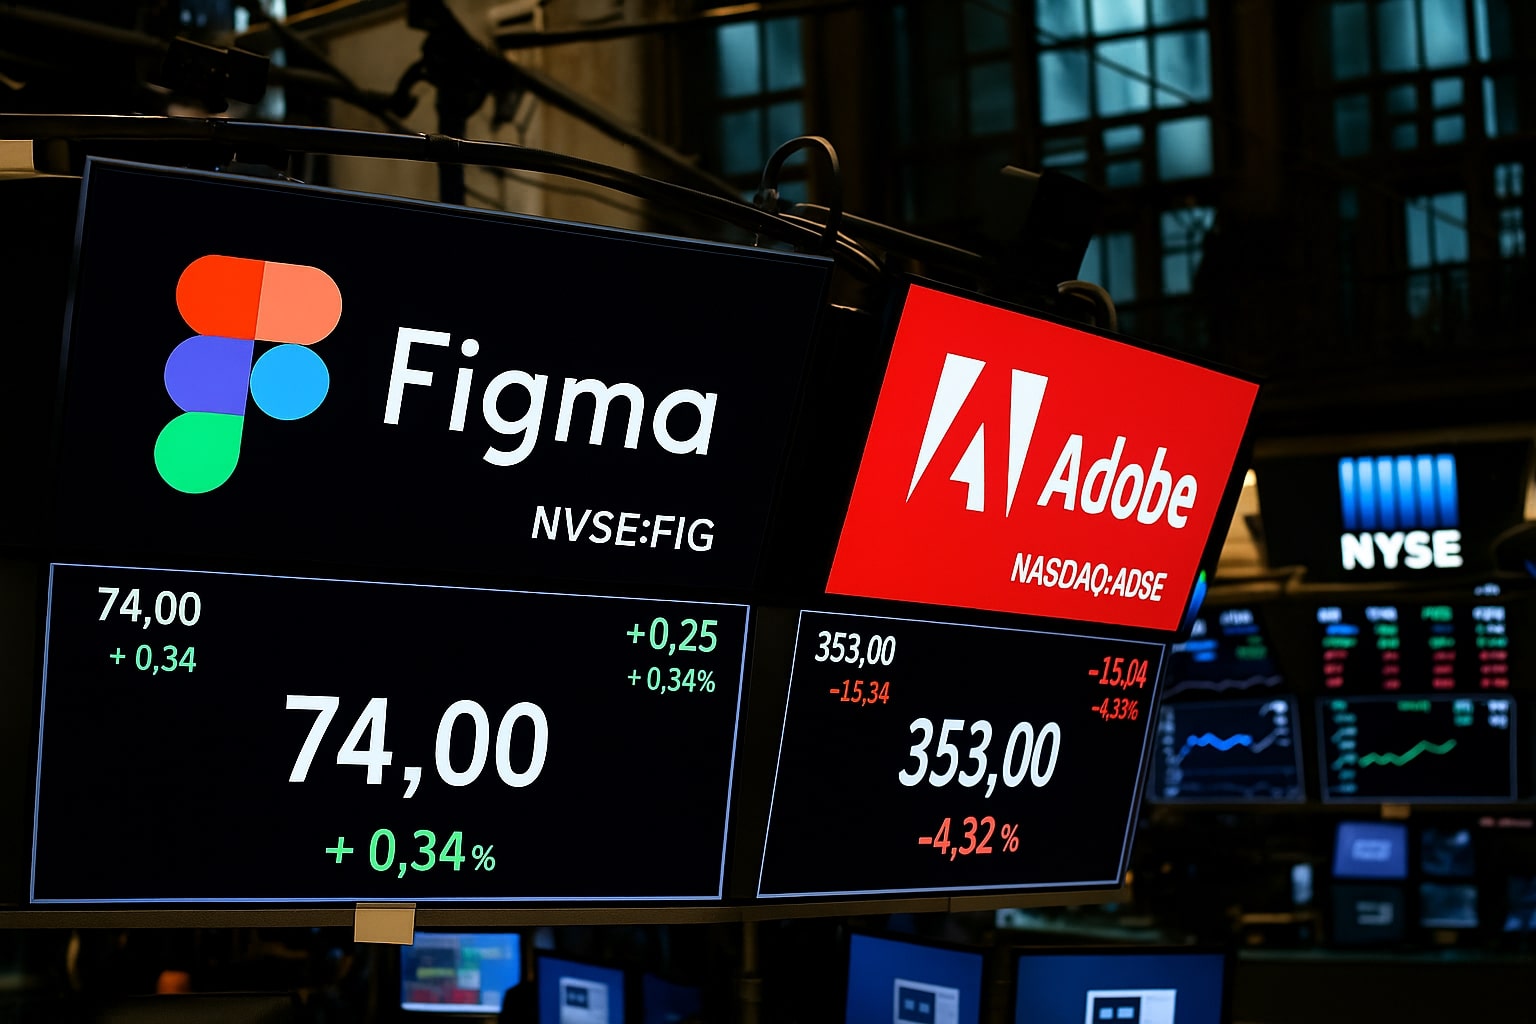
Adobe Stock vs Figma Stock: Market Prices and Scale
Adobe (NASDAQ:ADBE) trades near $356 per share, commanding a $160 billion market cap and anchoring itself as one of the most mature and profitable SaaS leaders in the world. Figma (NYSE:FIG) sits at $69, with a $33.8 billion market cap, less than one-quarter Adobe’s size. The contrast in scale is critical: Adobe is priced as a steady compounder, while Figma is treated as a high-beta growth engine priced far ahead of profitability.
Revenue Scale and Profitability Gaps
Adobe reported $22.6 billion in revenue for the last fiscal year, with $6.9 billion net income and EPS compounding at 11% annually. Operating margins sit near 30%, rivaling the best in big tech, backed by stable renewal rates across Creative Cloud, Document Cloud, and Experience Cloud.
Figma generated just $820.9 million in revenue, growing 46% YoY, which is outstanding at its scale, but it also booked a -2.37 billion net loss and -85% net margin. Its 90% gross margin reflects elite SaaS economics, yet without operating leverage, Figma burns cash on expansion. Adobe is the proven profit machine, Figma the untested growth story.
Valuation Multiples and Investor Positioning
Adobe trades at a forward P/E of 15.5x, cheap compared to peers like Microsoft or Salesforce, and a P/S multiple under 8x, giving investors margin of safety with solid growth optionality.
Figma is an outlier: trading at 37.9x sales and 32x price-to-book, far above even other growth IPOs. Bulls argue Figma can triple ARR to $3 billion by 2030, justifying its premium. Bears highlight that at these multiples, even a small deceleration could slash FIG’s market cap by double digits. The premium here is narrative-driven, not earnings-supported.
Cash Flow, Balance Sheet, and Liquidity
Adobe generates $6+ billion free cash flow annually, maintaining one of the most reliable cash conversion rates in SaaS. This allows consistent buybacks, AI R&D, and bolt-on acquisitions. Debt is moderate relative to cash generation.
Figma carries $1.54 billion in cash, very low debt at $66.7 million, and has already turned positive operating cash flow of $53.6 million. While impressive for a recent IPO, free cash flow remains razor-thin. The balance sheet is strong enough to fund growth for years, but absent profit, dilution risk lingers.
AI Integration: Adobe Firefly vs Figma AI Tools
AI is the battlefield that could define the next decade. Adobe has embedded Firefly generative AI across Photoshop, Illustrator, Premiere Pro, and Acrobat. It is already monetizing via higher subscription tiers, pushing ARR growth above 10% in Document Cloud. Adobe’s integration is enterprise-driven and sticky, defending market share.
Figma’s strength lies in collaboration-first AI features, with prototyping tools, auto-layout suggestions, and AI-assisted design generation. Adoption has been rapid among startups and Fortune 500 design teams. However, monetization remains limited. Adobe turns AI into cash flow; Figma is still building adoption before revenue.
IPO Mania and Current Sentiment
Figma IPO’d at $33 per share in July 2025, soared to $142 intraday (+250%), then collapsed back to $69, a 40% drawdown. Liquidity has normalized, with average daily volume halving from peak. The lock-up expiry in January 2026 is a looming event, with insiders controlling 50.8% of shares — a potential flood of supply.
Adobe has avoided such hype cycles, trading steadily between $340 and $420. Its lack of speculative mania means steadier sentiment, but less retail buzz.
Institutional and Insider Dynamics
Adobe remains a staple in institutional portfolios, particularly for funds seeking AI exposure without NVIDIA-level volatility. Insider selling has been modest, with leadership alignment intact.
Figma’s insider-heavy structure is riskier: with insiders owning half the float, January 2026 could spark volatility. If demand isn’t broad enough, FIG could test levels well below $60. This overhang is why many analysts recommend patience.
Macro Context: Powell, Rates, and Growth Premiums
Both stocks are sensitive to Powell and the Fed. If Powell signals rates stay high, high-multiple growth stocks like Figma are most exposed — compressing valuation multiples further. Adobe, with steady earnings, fares better in higher-rate regimes, offering downside protection. If Powell hints at cuts, speculative money could flood back into FIG, boosting its premium multiples. The macro narrative is just as decisive as company execution in this face-off.
Technical Levels and Market Structure
Adobe is holding support at $340, with technical resistance around $380–$400. A breakout could carry shares toward $420, while a breakdown below $335 risks deeper retracement.
Figma at $69 is well below both its 50-day ($86) and 200-day ($89) moving averages, signaling a bearish setup. Short interest remains negligible, suggesting FIG’s risk is not heavy shorting but rather lack of technical demand until new catalysts emerge.
Buy, Sell, or Hold Verdict: Adobe vs Figma
At current levels, Adobe (NASDAQ:ADBE) is a Buy — trading at $356 with resilient cash flow, strong margins, and AI monetization. It offers investors defensive growth and is attractively valued relative to peers.
Figma (NYSE:FIG) is a Hold — the $69 price reflects growth potential but also dangerous valuation levels and a looming insider unlock in 2026. FIG could reward long-term believers if growth sustains above 40% annually, but near-term risk skews against fresh entries.
For investors deciding between the two, Adobe provides stability and cash-backed AI exposure, while Figma remains a speculative growth play dependent on flawless execution and market appetite for premium multiples.
That's TradingNEWS
Read More
-
The Dividend ETF That Doesn't Act Like One — FDVV Rides Nvidia and Apple to a 20.5% Year and Nears Record Highs
06.07.2026 · TradingNEWS ArchiveStocks
-
XRP's ETFs Are Locking Away Supply Relentlessly — XRPI and XRPR Hold Their Floors as $1.44B in Inflows Await the Catalyst the Price Needs
06.07.2026 · TradingNEWS ArchiveCrypto
-
Heat vs. Supply Keeps Gas Pinned at $3.21 — A 100-Degree Heat Wave and Record LNG Flows Battle a 110 Bcf/d Production Flood
06.07.2026 · TradingNEWS ArchiveCommodities
-
The Yen Grinds to 40-Year Lows as the Carry Trade Overpowers Japan's Warnings — USD/JPY at ¥162 With Goldman Betting on More Upside
06.07.2026 · TradingNEWS ArchiveForex