





Brent Holds $92.04 And WTI $87.96 As Hormuz Strikes Collide With A 21.9M Barrel US Build
Global observed stocks fell below 7.9B barrels for the first time since April 2025 | That's TradingNEWS
Key Points
- WTI rose 2.57% to $87.96 and Brent 1.71% to $92.04 after overnight tanker strikes.
- US commercial crude built 21.9 million barrels in three weeks to 428.9 million.
- Distillate inventories sit 14% below the five-year average with Atlantic Basin cracks at records.
West Texas Intermediate (CL=F) trades $87.96, up $2.20 or 2.57%, extending Monday's 3.87% surge from $86.63. Brent is at $92.04, up 1.71%, holding above $90 for a second consecutive session. Crude is up 50% year to date, with Brent 32.02% higher than a year ago and WTI up 31.98%.
The overnight escalation is what moved the barrel. Two oil tankers were struck by projectiles Monday night — one Saudi and one South Korean-owned. A Saudi very large crude carrier, the Sidr, was reported hit or stopped while transiting the US-facilitated southern Hormuz corridor. The UK Maritime Trade Operations desk separately logged a vessel struck by three projectiles. Iran claimed a ship had hit mines; US Central Command denied any vessel had.
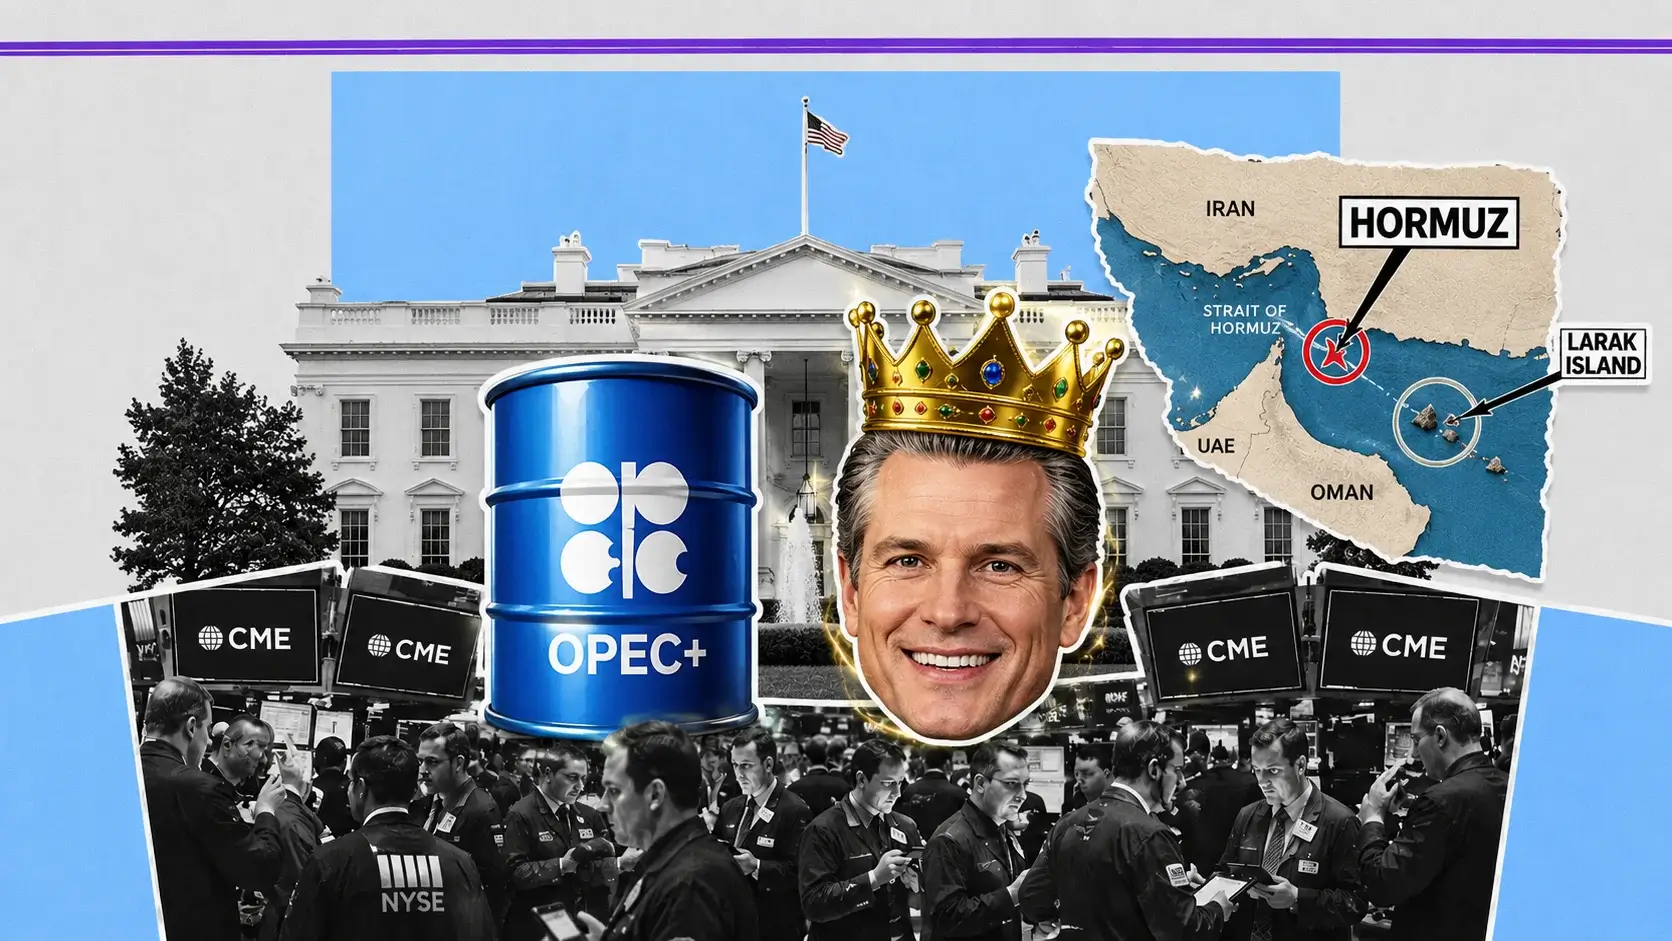
That followed Sunday's strike on two Iranian rocket launchers on Larak Island that were preparing to lay mines in the Strait — the first publicly acknowledged US action against Iranian positions since late July. Tehran retaliated against two American bases in Jordan. President Trump's response to reporters was that the US is going to hit them hard and there will be a response.
The flow data quantifies the damage better than the headlines. Kpler counted five commodity transits through Hormuz on Monday against a 10-day average near 14, with zero liquid tankers among them. Traders monitoring cargoes still put 6 million to 8 million barrels a day moving through the waterway, mainly from other Gulf producers, with Iranian channels describing traffic on an approved route as proceeding on a limited basis with vessels paying tolls.
The thesis for this forecast: the price and the barrel count are telling different stories, and the gap between them is the trade. Brent at $92.04 is discounting an acute supply shock. US commercial crude inventories built 21.9 million barrels across three weeks to 428.9 million — 1% above the five-year average for this time of year.
The tightness is offshore and in refined products, not onshore in the United States. Global observed stocks fell below 7.9 billion barrels for the first time since April 2025, dragged almost entirely by a collapse in oil on water. That distinction determines whether $92 Brent holds or unwinds.
It also determines what happens the day the Strait reopens.
The Three-Week Build That Contradicts The Price
The single most important data set in this market is the one nobody trading the headlines is looking at.
US commercial crude inventories stood at 407 million barrels for the week ending July 31, having risen 2.479 million against expectations for a 1.5 million-barrel draw. The week ending August 7 delivered a build of 17.422 million barrels to 424.4 million — the largest single-week increase since January 2023, against a consensus calling for a 1.4 million-barrel draw. The week ending August 14 added another 4.405 million to 428.8 million, a third consecutive weekly increase. The week ending August 21 added 0.1 million more to 428.9 million.
That is a cumulative build of 21.9 million barrels in three weeks, into a market where Brent was trading between $88 and $105.
At 428.9 million barrels, US commercial crude sits 1% above the five-year average for this time of year. Cushing, the WTI delivery point, held 22.4 million barrels as of August 21 after building 1.2 million on the week, and remains below its own historical average. The Strategic Petroleum Reserve stood at 289.7 million barrels.
The composition of the build explains part of it. Net US crude imports increased by 1.768 million barrels per day in the week ending August 7, then fell by 1.754 million barrels per day the following week — a swing of 3.5 million barrels per day across two weeks that is more logistics than fundamentals. Crude imports averaged 6.2 million barrels per day in the week to August 21, down 435,000 from the prior week, with the four-week average at 6.6 million barrels per day, 2.6% above the same period last year.
Refinery utilization ran 97.4% of operable capacity. That is close to a maximum sustainable rate, and it means every incremental barrel of crude is being processed rather than stored.
The point is not that the geopolitical premium is fake. It is that the physical crude market in the largest consuming country is not tight, and it has been getting looser for a month while the price went up. The next weekly print lands Wednesday, September 2, and it is the first genuine test of whether this build continues.
Products Are Where The Actual Shortage Is
The inventory picture inverts completely when you move from crude to refined products, and this is the part of the market that justifies the price.
Total motor gasoline inventories fell 2.5 million barrels in the week ending August 21 and sit 6% below the five-year average. Distillate fuel inventories — diesel and heating oil — declined 2.2 million barrels and sit approximately 14% below the five-year average. Both finished gasoline and blending component inventories decreased.
A 14% distillate deficit heading into the Northern Hemisphere heating season is the tightest structural position in the entire barrel, and it is not a US phenomenon.
Global refinery crude throughputs increased in July but remained nearly 5 million barrels per day below year-earlier levels at 80.9 million barrels per day. Continued Middle East product export disruptions and attacks on Russian refineries cut third-quarter run estimates by a further 370,000 barrels per day. Global throughputs are forecast to decline by 2.5 million barrels per day on average in 2026 before rebounding 3.5 million barrels per day in 2027.
The consequence is visible in margins. Tighter light and middle distillate markets have pushed cracks and margins in the Atlantic Basin to record highs.
That is the cleanest read on where the shortage actually sits. The world does not lack crude oil — US commercial stocks are 1% above their five-year average and OPEC+ has spare capacity. The world lacks refining capacity in the right places, because the conflict has taken Middle East product exports offline and Russian refineries are being struck.
Propane tells the same story in reverse. Propane and propylene inventories rose 2.5 million barrels in the week to August 21 and sit 32% above the five-year average — a product with no exposure to the disrupted export routes, building comfortably.
For anyone trading the crude benchmarks, the implication is that the distillate crack is doing more work in the flat price than the crude balance is. If Middle East product exports resume before Hormuz crude transits normalize, the crack compresses and the flat price falls faster than the headlines would suggest.
Global Stocks Below 7.9 Billion Barrels And 410 Million Drawn
The international inventory data is where the bull case lives, and the numbers are substantial.
Global observed oil inventories plunged by 69 million barrels in July, equivalent to 2.2 million barrels per day. By the end of July, observed stocks had fallen below 7.9 billion barrels for the first time since April 2025. Cumulative stock draws between the end of February and the end of July reached 410 million barrels, an average of 2.7 million barrels per day across five months.
The composition matters enormously. That 69 million barrel July decline was dragged lower almost entirely by a drop in oil on water. Onshore stocks declined by a modest 6 million barrels, as the pace of emergency stock releases slowed and Chinese crude stocks continued to draw.
Oil on water is floating inventory — cargoes in transit. When the Strait of Hormuz is constrained, cargoes that would normally be sailing are not loaded, and observed floating stocks collapse. That is exactly what happened. It is a transit disruption expressing itself as an inventory draw, not a demand-driven depletion of usable barrels.
The global balance now shows a deficit of 1.8 million barrels per day in the third quarter of 2026, more than double the roughly 800,000 barrels per day estimated a month earlier. The market is projected to return to surplus toward the end of this year, but risks remain substantial and the urgency of reopening the Strait has increased as previously available inventory buffers deplete.
That last clause is the crux. The buffer that absorbed the first five months of this conflict is largely spent. Another 410 million barrels of draws is not available. If Hormuz stays constrained through the fourth quarter, the market has to ration demand through price rather than through inventory.
If it reopens, the reverse happens fast. Floating stocks rebuild mechanically as loadings resume, the observed inventory number recovers without any change in production, and the deficit that justifies $92 Brent evaporates on paper before a single extra barrel is produced.
That asymmetry is the defining feature of this market and the reason positioning here is uncomfortable in both directions.
Shut-In Production Of 5.5 Million Barrels A Day Is The Coiled Spring
The supply-side number that matters most for the next six months is production that exists but cannot reach the market.
Regional production shut-ins averaged 5.5 million barrels per day in July. That is capacity sitting behind the closed Strait, physically capable of producing and commercially motivated to do so, waiting on transit.
Government forecasts assume shipments through Hormuz remained severely constrained through August with flows slowly increasing in September, and that assumption drove an upward revision to shut-in production estimates for August, further reducing inventories. Most regional crude production is expected to return to near pre-conflict averages in early 2027, with ongoing disruptions of approximately 0.6 million barrels per day continuing through the end of next year.
Compare the scale. Total crude and liquids volumes through Hormuz averaged 21.6 million barrels per day in the fourth quarter of 2025 before the conflict began. Current traded estimates put 6 million to 8 million barrels per day still moving. That is a 13 to 15 million barrel per day gap in gross transit, partially offset by re-routing — Saudi Arabia has shifted crude flows away from Hormuz through the East-West pipeline, and Bab el-Mandeb volumes rose to 8.1 million barrels per day in the second quarter from 5.4 million in the fourth quarter of 2025.
The re-routing capacity is finite. The East-West pipeline and Bab el-Mandeb cannot absorb 21.6 million barrels per day.
OPEC+ is layering supply on top of this. The group is expected to implement a final production quota increase of 188,000 barrels per day in September, completing the rollback of its voluntary output cuts. It may pause further increases afterward but has retained flexibility to adjust.
Stack the pieces: 5.5 million barrels per day shut in, a final 188,000 barrel per day quota increase landing this month, and spare capacity across the group that has not been tested. The moment transit normalizes, the supply response is measured in millions of barrels per day, not hundreds of thousands.
That is why every institutional forecast has Brent falling through 2027 rather than extending. The current price is not a supply shortage. It is a logistics blockage on top of a market that entered 2026 expecting a 3.7 million barrel per day surplus.
The 2026 Price Record: $69 In July, $105 In July, $120 In March
The volatility this year has been extraordinary and the round trips have been brutal for anyone trading the narrative.
Brent entered 2026 near $70 with the dominant view being oversupply — a projected 3.7 million barrel per day surplus, with 2025 having seen Brent spend the year broadly below $75 while WTI shed roughly 20%.
On February 28, US-Israeli air strikes on Iran triggered the effective closure of the Strait of Hormuz. Within days Brent futures approached $120 per barrel, the highest since the pandemic-era shock.
In June, a memorandum of understanding was signed between the United States and Iran. Brent collapsed to as low as $69 per barrel on July 2 — a full retracement of the entire war premium in four months.
Then it reversed again. Renewed attacks on tankers transiting Hormuz and the associated reduction in shipments pushed Brent to as high as $105 per barrel on July 23. July closed with Brent up 20.5% and WTI up 21.8%.
August was comparatively quiet in net terms and violent in range. Brent gained roughly 3% and WTI roughly 1% for the month, but Brent swung through a range of almost $17 per barrel across the four weeks.
Today's $92.04 sits in the middle of a $69 to $120 annual range.
That history is the single best argument against high-conviction positioning in either direction. This market has fully priced a war and fully priced a peace inside seven months, twice. A memorandum of understanding took $36 off Brent in eight weeks. A tanker attack put $36 back on.
The practical implication for a September forecast is that headline risk dominates fundamental analysis on any horizon shorter than a quarter. The conflict has been in stalemate for six months with Tehran keeping the Strait closed and Washington maintaining a counter-blockade of Iranian ports. Stalemates end abruptly in both directions.
Position sizing matters more than direction here. A $17 monthly range on a $92 barrel is 18.5% volatility in the flat price alone.
Read More
-
Yen Stalls at 160 Despite a 3% JGB and Tokyo Core CPI at 2.0% — Intervention Sits at 164, Friday's Payrolls Decide
02.09.2026 · TradingNEWS ArchiveEnergy
-
QQQ ETF ($706.22) Slides 7.4% Below Its High as the Market Reprices the AI Capex Bill — $686.57 Target if $700 Breaks
22.10.2026 · TradingNEWS ArchiveStocks
-
XRPI ($7.00) and XRPR ($10.74) Slide Toward 52-Week Lows as Spot XRP ETF Flows Stall at $708,510
22.10.2026 · TradingNEWS ArchiveCrypto
-
NG ($2.775) Decoupled From Europe’s €88 Gas Crisis as LNG Feedgas Hits 18.9 Bcf/d — $3.30 Upside on Cold Weather
22.10.2026 · TradingNEWS ArchiveCommodities
-
Dollar-Yen (157.35) Loses 157.65 as the Yen Rallies on Haven Demand — 155 Target if 156 Breaks
22.10.2026 · TradingNEWS ArchiveForex
What The Official Forecasts Actually Say
The institutional base case is materially below the current price, and the timing of the next update matters.
The most recent Short-Term Energy Outlook, released August 11 with the forecast completed August 6, put the Brent spot price averaging around $85 per barrel in the third quarter of 2026 — $11 per barrel higher than the prior month's projection, reflecting the upward revision to shut-in production. Brent is currently $7.04 above that quarterly average with one month of the quarter remaining.
Looking further out, the same forecast expects Brent to fall gradually to an average of $69 per barrel in 2027 as inventories rebuild and most production recovers by early next year.
That is a $23 decline from the current level over roughly fifteen months, and it is built on one assumption: that Hormuz normalizes. The forecast explicitly assumes flows slowly increasing in September, which is now.
The next update lands on September 9, and it will be the first official revision to incorporate the late-August escalation. If the September STEO pushes the normalization assumption into the fourth quarter, the 2027 average moves up and the curve steepens. If it holds the September assumption, the official view is that the market is nine days from the beginning of a supply recovery.
Private-sector forecasts cluster in a similar band. Third-quarter Brent estimates near $86, falling to $80 in the fourth quarter and $78 at year end, built on a market that has rebalanced through larger-than-expected demand losses and smaller-than-expected OECD commercial inventory draws, with China offered as the case study in demand destruction.
Demand destruction is the underappreciated variable. Total US products supplied over the last four-week period averaged 20.5 million barrels per day, down 3.0% from the same period last year. A 3% year-over-year decline in the largest consuming market at $92 Brent is the price mechanism working.
Every official forecast on the table sits below spot. That does not make them right. It does mean the burden of proof for sustained upside sits with the bulls, and the evidence they need is a supply event, not a headline.
Technical Structure: $86.63, $90 And The $105 Ceiling
The chart is constructive on the daily timeframe and unresolved on anything longer.
WTI at $87.96 has cleared Monday's $86.63 close and is extending. The immediate structural support is that $86.63 level, followed by the pivot region near $79.17 that has framed the recent range. Beneath that, the July consolidation zone in the mid-$70s becomes relevant, with the deeper reference at $73.45.
Brent at $92.04 is holding the $90 handle for a second session, which is the psychological line the market has used as a regime marker all summer. Above it, the July 23 high at $105 is the ceiling that defines the current range. Below it, the June memorandum lows near $69 mark the floor of the entire 2026 band.
The $90 level is doing real work. Brent closed back above it on Monday after rising 2.7%, and it has held. Losing $90 on a closing basis would signal the overnight tanker strikes have been absorbed and would open a retest toward the mid-$80s where the official third-quarter forecast sits.
Momentum is with the bulls in the short term. Two consecutive sessions of gains on escalating headlines, with WTI up 2.57% and Brent up 1.71%, following a 3.87% WTI advance on Monday, is a market that is bidding every incremental piece of bad news.
The structural caution is that each successive escalation is producing a smaller price response. The Larak Island strike on Sunday produced 3.87% on WTI. The tanker attacks Monday night produced 2.57%. The February closure produced a move from $70 to $120. The market is becoming desensitized, which is what happens when a conflict runs six months without resolution and traders learn that every spike has been sold.
For the sector, the equity response has been cleaner than the commodity. The Energy Select Sector SPDR (XLE) gained more than 1% in premarket trade, with EOG Resources, Diamondback Energy and Targa Resources each adding more than 1%. SLB closed Monday up 4.83% at $60.10 on 34.631 million shares against a 13.275 million average — a 2.6x volume expansion that reads as institutional repositioning.
$92 Brent Is Now A Macro Input, Not Just A Commodity Price
Oil has stopped trading as an isolated commodity and started functioning as the primary inflation transmission channel in the global economy. That changes who is trading it and why.
Every major sovereign curve broke to a multi-decade extreme on the same session crude pushed higher. The US 10-year Treasury reached 4.786%, the highest since January 2025. The 30-year hit levels last seen in 2007. Japan's 10-year struck 3.00% for the first time since 1996. Germany's 10-year Bund pushed to 3.3546%, a 2011 high. The 10-year gilt sits at 5.23%.
The chain is direct: tanker strikes lift crude, crude lifts headline inflation, inflation lifts policy expectations, and policy expectations lift the entire yield curve. CME FedWatch now prices a 25 basis point hike at the September 15-16 FOMC meeting at 66.4%, up from 39.6% a week ago.
The European exposure is the sharpest. Eurozone flash HICP for August came in at 3.3% year over year, up from 2.9% in July, with the monthly rate accelerating to 0.4% from 0.2%. Central bank modelling puts the pass-through at roughly 0.5 percentage points added to eurozone inflation for every sustained $10 increase in oil. Crude is up more than $40 since the conflict began in late February — close to 2 full percentage points of imported inflation.
The market has responded by fully pricing a European Central Bank hike to 2.50% on September 10.
That feedback loop has a second-order consequence for oil itself. Higher rates tighten financial conditions, tighter conditions slow demand, and slower demand is what produces the 3.0% year-over-year decline in US products supplied already visible in the weekly data. Crude is engineering its own demand destruction through the monetary channel.
Tuesday's US data adds to it. ISM manufacturing prices paid is forecast at 71.2 against 71.1 prior. A prices-paid print in the low 70s with Brent at $92.04 confirms the energy pass-through into factory input costs and feeds directly into the September hike case.
Oil bulls should understand what they are rooting for. Sustained $100 Brent produces a Federal Reserve that hikes twice, not once.
Upside Map: $100, $105 And What A Real Escalation Looks Like
The bull case has a defined path and it requires a specific kind of event.
The first target is the $100 handle on Brent, 8.6% above the current $92.04. That level has been reached once this year, on the way to $120 in March, and approached in late July at $105.
The July 23 high of $105 is the operative ceiling. Clearing it on a closing basis would confirm that the market is pricing a second phase of the conflict rather than a continuation of the stalemate, and would open the March high near $120.
What produces that move is not more tanker strikes. Monday night's attacks on two vessels produced 2.57% on WTI. The market has absorbed a dozen similar incidents. The escalation that repriced this market in February was the closure of the Strait itself — a categorical change in transit capacity, not an incremental one.
The candidate events are narrow and identifiable. A US strike on Iranian export infrastructure or production facilities rather than on rocket launchers. An Iranian attack on Saudi or Emirati production assets, which would remove barrels rather than delay them. A widening of the conflict to a third state — the President has separately threatened Oman with military action if it interferes. Or the complete cessation of the 6 to 8 million barrels per day still transiting.
The structural conditions that would amplify any of those are already in place. Global observed stocks are below 7.9 billion barrels for the first time since April 2025 after 410 million barrels of draws. The third-quarter deficit runs 1.8 million barrels per day. Distillate inventories sit 14% below the five-year average with Atlantic Basin cracks at record highs. The buffer that absorbed the first five months of this conflict is largely spent.
A supply event landing on depleted inventories produces a larger price response than the same event would have produced in March. That is the asymmetry the bulls own.
The offset is spare capacity. With 5.5 million barrels per day shut in and OPEC+ completing its quota rollback with a 188,000 barrel per day September increase, the supply response to $105 Brent is faster than it was in February.
Downside Map: $85, $79 And The $69 Floor
The bear case requires only one thing, and it is the thing every official forecast already assumes.
Hormuz normalizes. Transits recover from five per day toward the 10-day average of 14 and beyond. The 5.5 million barrels per day of shut-in production restarts. Floating inventories rebuild mechanically as loadings resume, and the observed stock draw that produced the 1.8 million barrel per day third-quarter deficit reverses without a single additional barrel being pumped.
The first downside target is $85 Brent — the official third-quarter average projection, 7.6% below spot. On WTI that maps to roughly $80.
Below that, the pivot near $79.17 on WTI is the intermediate structural reference, with $73.45 beneath it. On Brent, the June memorandum low of $69 on July 2 is the floor of the entire 2026 range, and it is also the projected 2027 average.
A move from $92.04 to $69 is 25.0%. It happened in eight weeks earlier this year on a signed memorandum of understanding.
The fundamental case for it is stronger than the price suggests. US commercial crude built 21.9 million barrels in three weeks to 428.9 million, 1% above the five-year average. Refinery utilization at 97.4% means run rates cannot absorb more. Products supplied are down 3.0% year over year on a four-week basis. The market was projected to run a 3.7 million barrel per day surplus this year before the conflict, and the global balance is forecast to return to surplus toward the end of 2026.
The trigger sequence to watch is specific. The weekly inventory report lands Wednesday, September 2, and a fourth consecutive build would confirm the crude side is loosening. The next official outlook arrives September 9 with a revised Hormuz normalization assumption. Any credible diplomatic development — and there has been one already this year — collapses the premium in days.
Add the demand-side pressure from rates. With 66.4% odds of a Federal Reserve hike on September 16, the ECB fully priced for 2.50% on September 10, and global yields at multi-decade highs, the macro backdrop is actively destroying the demand that supports $92 crude.
The path of least resistance below $90 is fast.
Positioning: Why Both Sides Of This Trade Are Uncomfortable
The structure of this market produces poor risk-reward at the current price, and that is worth stating plainly.
A long position at $92.04 Brent is betting on escalation into a market where inventories in the largest consuming country are above their five-year average, where 5.5 million barrels per day of production is waiting to restart, where OPEC+ is completing a quota rollback this month, and where every official forecast sits $7 to $23 below spot. The upside requires a categorical escalation, and the downside is a headline.
A short position at $92.04 is betting against a live six-month war where two tankers were hit last night, where global stocks are at their lowest since April 2025 after 410 million barrels of draws, where distillates sit 14% below the five-year average heading into winter, where Atlantic Basin cracks are at record highs, and where the inventory buffer that absorbed the first phase is spent. The downside is $105 and then $120.
The volatility quantifies the discomfort. Brent traded a $17 range in August alone on a $92 barrel. It has traded $69 to $120 across 2026. Neither a stop-loss nor a target survives that kind of range without careful sizing.
The one position that has clean logic is the crack spread rather than the flat price. The shortage is demonstrably in products, not in crude — gasoline 6% below the five-year average, distillates 14% below, global refinery throughputs 5 million barrels per day beneath year-earlier levels at 80.9 million, and third-quarter runs cut a further 370,000 barrels per day by Middle East export disruptions and strikes on Russian refineries. That imbalance resolves more slowly than the crude transit blockage because refining capacity cannot be restarted by a diplomatic announcement.
For equity exposure, the energy complex has been the cleaner expression. XLE gained more than 1% premarket with EOG, Diamondback and Targa each adding more than 1%, and SLB rose 4.83% Monday on 2.6x average volume. Those names carry the oil beta with an earnings floor beneath them.
The flat price is where the whipsaw lives.
The Calendar: September 2, September 9 And September 16
Three dates over the next sixteen days will resolve most of the uncertainty in this market, and they arrive in sequence.
Wednesday, September 2 brings the weekly petroleum status report covering the week ending August 28. That print is the first direct test of whether the three-week crude build continues. A fourth consecutive increase on top of 428.9 million barrels confirms the US crude market is loosening regardless of what happens in Hormuz, and it undercuts the flat price. A meaningful draw with refinery utilization holding near 97.4% would validate the tightness narrative and support a run at $95 Brent.
Watch the product lines as closely as the crude line. Gasoline at 6% below the five-year average and distillates at 14% below are the numbers that carry the crack spread, and a further distillate draw heading into September is the single most bullish print available.
Wednesday, September 9 brings the next Short-Term Energy Outlook. The August edition assumed Hormuz transits would remain severely constrained through August with flows slowly increasing in September, and put third-quarter Brent at $85. The September update revises that assumption in light of the Larak Island strike and the tanker attacks. Pushing normalization into the fourth quarter lifts the price path. Holding the September assumption implies the official view is that supply recovery starts now.
Wednesday, September 16 brings the FOMC decision, currently 66.4% priced for a 25 basis point hike. That is the demand-side variable. A hike tightens financial conditions into an oil market already showing a 3.0% year-over-year decline in US products supplied. It also lifts the dollar, which prices the barrel.
The European Central Bank decides September 10 with a hike to 2.50% fully priced, and US August CPI lands the same day — a print that will carry the energy pass-through from $92 Brent directly.
The conflict itself operates on no calendar. Six months of stalemate with Tehran holding the Strait closed and Washington maintaining a counter-blockade of Iranian ports has produced two complete price cycles this year. The third could begin on any given night, as it did last night.
Forecast: Range-Bound Between $85 And $100 With Fat Tails
Weighting the evidence produces a wide distribution and a clear preference for range trading over directional conviction.
The base case is Brent between $85 and $100 through September, with WTI between $80 and $95. It carries the highest probability because it fits every observable: a six-month stalemate with no resolution mechanism, 6 to 8 million barrels per day still transiting, an official third-quarter forecast at $85 against spot at $92.04, and a market that has traded a $17 monthly range without resolving. Escalation headlines lift the top of the range; inventory builds and diplomatic noise press the bottom.
The bull case targets the July 23 high of $105 and then $120. It requires a categorical escalation rather than an incremental one — a strike on Iranian export or production infrastructure, an attack on Gulf producer assets, a widening to a third state, or the complete halt of remaining transits. The structural amplifier is real: global stocks below 7.9 billion barrels after 410 million barrels of draws, a 1.8 million barrel per day third-quarter deficit, distillates 14% below the five-year average, and Atlantic Basin cracks at record highs. A supply event landing on that base moves further than the same event would have in March.
The bear case targets $85 and then $69. It requires only that Hormuz normalizes on the timeline every official forecast already assumes. Floating stocks rebuild mechanically, 5.5 million barrels per day of shut-in production restarts, OPEC+ completes its 188,000 barrel per day September rollback, and the 3.7 million barrel per day structural surplus the market expected entering 2026 reasserts itself. The 2027 projection of $69 is $23 below spot.
The supporting bear evidence is already in the data: 21.9 million barrels of US crude builds in three weeks to 428.9 million, refinery utilization pinned at 97.4%, products supplied down 3.0% year over year, and a rate path that is actively destroying demand.
Verdict: neutral with a fade bias above $95. Sell strength into $95 to $100 Brent with a stop above $105. Buy weakness into $85 to $86 with a stop below $83. Stand aside between $88 and $94, which is where price is now — the risk-reward at $92.04 rewards patience, not participation.
The trade with the cleanest logic remains the distillate crack, not the flat price.





