





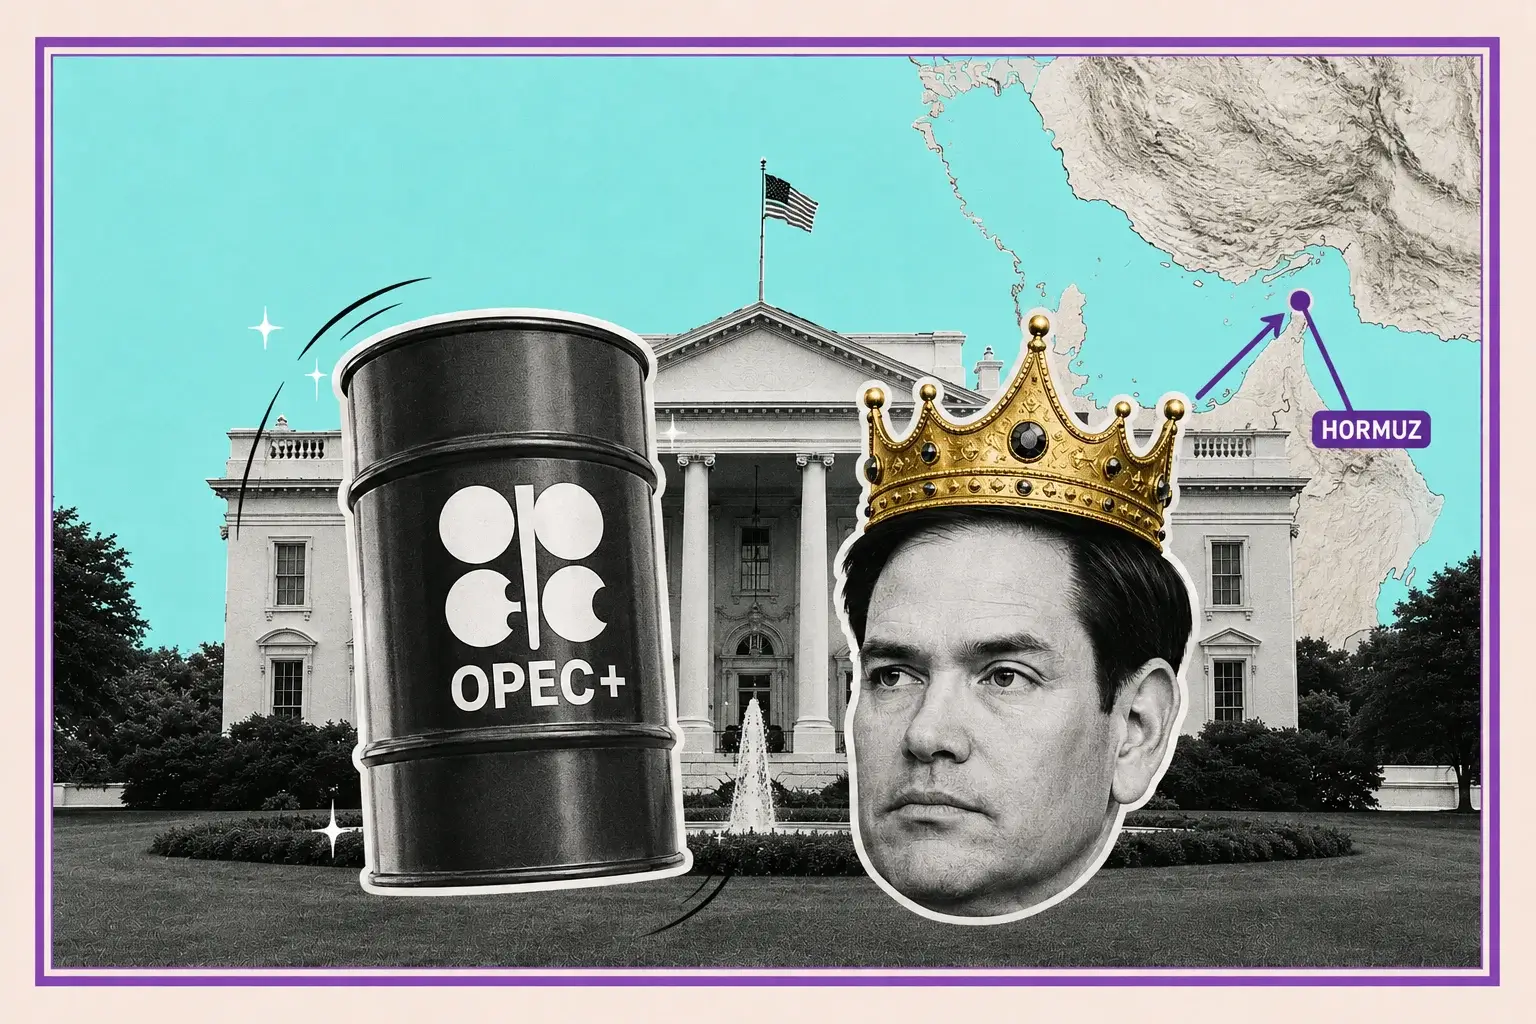
Brent Rips to $94, WTI Hits $86 as Washington Readies "Economic D-Day" Sanctions on Iran
Hormuz transits fell to 73 in the week ended August 16 from 91, with only two to three VLCCs clearing the strait daily since July 7 | RTh
Key Points
- Brent traded $93.96 after tagging $94.24, its highest since July, up more than 5% on the week.
- The IEA doubled its Q3 2026 deficit estimate to 1.8 million bpd from roughly 800,000 bpd.
- Global observed stocks fell below 7.9 billion barrels, the lowest since April 2025.
Brent crude traded $93.96 on Friday, up 18 cents, after touching $94.24 at the session high — the strongest print since July. WTI for October delivery sat at $86.94, up 11 cents, with the September contract quoted between $86.21 and $86.51 across the morning. Both benchmarks are heading into the weekend with a second consecutive weekly gain, up more than 5% over five sessions.
The run into this level was violent. Across the five days of gains that preceded Friday's pause, Brent added more than 7% and WTI climbed more than 8%, taking both to their highest levels since July 24. Thursday alone delivered a 2.4% Brent settle at $93.78 and a 2.7% WTI move to $86.64. Friday is a hold rather than an extension — the market is waiting for Monday.
Context matters here because 2026 has been a year of enormous swings in this contract. Brent hit $118 on April 29 during the peak of the Hormuz disruption, collapsed to $72 by June 26 after the memorandum of understanding between Washington and Tehran, and printed as low as $69 on July 2. Dated benchmarks pushed past $140 at the extreme in the spring — the highest since 2008. Brent is now up 38.92% over twelve months but essentially flat over the past four weeks at plus 0.02%.
That flat month is the tell. Crude eased significantly across the first two weeks of August as US officials suggested a deal with Tehran could be imminent. Then Washington hardened its position, the 60-day memorandum expired with no attempt to restart talks, and the risk premium came straight back in.
What sits underneath the price is a physical market that has been drawn down for six months. The IEA now puts the third-quarter global balance at a deficit of 1.8 million barrels per day — more than double the estimate of roughly 800,000 barrels per day carried in the prior month's report. Observed global inventories fell 69 million barrels in July alone.
Two forecasting houses have already said they will revise oil price outlooks higher, citing upside potential in international benchmarks driven by the Persian Gulf war.
The market is pricing a supply story with a policy catalyst landing Monday morning. That combination is what the next two weeks turn on.
Trump's "Economic D-Day" And Bessent's Monday Press Conference
The catalyst arrived Wednesday evening in a social media post and it has not been priced out since.
President Trump announced what he called the most crushing economic operation ever taken against any country, describing it as economic warfare and isolation on an unprecedented scale and labeling it an economic D-Day. Any nation providing what he termed any type of lifeline to Iran was threatened with tremendous economic consequences. He named the mechanisms directly: oil smuggling, swap lines, cash transfers, exchange houses, ship registries and front companies.
Scott Bessent followed on Thursday with the operational framing. He described the approach as a one-two punch — the existing naval blockade combined with what he called the toughest sanctions in history — and stated the objective is regime collapse. He characterized the plan as the greatest coordinated economic isolation in the history of the world, and said details would be unveiled Monday.
The campaign has been running since April under the banner Operation Economic Fury. What changes Monday is scope: the shift from targeting Iranian entities to targeting third parties that transact with them.
Bessent also made a comment worth carrying because it captures the market's disagreement with him. He told television he did not know why crude prices had gained following the president's remarks, since maximum economic pressure meant it was likely there would not be a return to large-scale military attacks.
The physical market read it the other way. Sanctions do not put barrels back through the strait — they remove the possibility of a negotiated reopening while leaving the blockade in place. Cutting off financial channels also removes Tehran's incentive to bargain, because there is nothing left to trade for.
The assessment from the desk that has been closest to this is that both sides are dug in and lacking the luxury of time to play a waiting game, against a backdrop of crude grinding unerringly higher. Iran's calculation appears to be that oil prices reach unsustainable levels faster than its economy collapses.
Nothing in the public record suggests Tehran is preparing to return to negotiations. Trump said he would be open to resuming talks at some point, which is not a timeline.
Monday's announcement is the single largest scheduled event risk in this contract.
China Is The Whole Sanctions Question
Secondary sanctions only work if the buyer stops buying, and the buyer is Beijing.
China takes the bulk of Iranian crude and accounted for more than 80% of shipped volumes in 2025, largely through shadow fleets that switch off tracking devices and operate under false flags. Any measure targeting third-country purchasers is aimed squarely at Chinese refiners, and Beijing has repeatedly stated that sanctions are not an effective tool for resolving geopolitical problems — in the Middle East or in Ukraine. It has rejected the pressure campaign and called for a diplomatic solution.
That leaves Washington with a choice it has been avoiding all year: enforce secondary sanctions against Chinese entities and accept the trade consequences, or announce a framework it does not fully enforce. The market has seen the second version before and discounts it.
The precedent cuts against enforcement. The last comparable escalation targeted independent Chinese refiners directly, and the flows adapted rather than stopped — rerouted through intermediaries, restructured through non-dollar settlement, priced at deeper discounts. Iranian barrels kept moving.
There is a second-order problem. If enforcement is real and Chinese purchases actually fall, Iranian exports drop from the current 200,000 barrels per day toward zero. That is a small absolute volume against a 102 million barrel per day market. But the same enforcement architecture — targeting ship registries, insurers, and financial channels — raises the cost and risk of moving every other barrel through the region, including the Gulf crude that is still transiting.
The blockade has already cut Iranian seaborne crude exports from 2 million barrels per day to 200,000, costing Tehran approximately $435 million daily. Iranian inflation runs 53.9% and the IMF projects a 6% contraction this year. Non-oil trade has fallen 24% year-over-year.
That is a country under enormous strain that has not moved. Adding financial isolation to a naval blockade against an economy already contracting 6% is unlikely to produce a rapid capitulation, and the market is pricing that assessment rather than the administration's.
The UAE suspended financial and economic transactions with Iran after accusing Tehran of launching ballistic missiles at its territory — evidence the regional coalition is tightening even as the standoff persists.
Hormuz: 73 Transits And Two Very Large Crude Carriers A Day
The physical constraint is the number that actually sets price, and it has been deteriorating.
Ship transits through the Strait of Hormuz ran 73 in the week ended August 16, down from 91 the prior week. Against roughly 130 daily crossings before the conflict began in late February, weekly traffic is running at a fraction of normal — often barely reaching double digits on individual days.
For crude specifically the picture is worse. Since July 7, an average of only two to three very large crude carriers have transited the strait per day, tracked via transponders and satellite data. Before the war, approximately 20% to 25% of global seaborne oil trade moved through that waterway, with roughly 80% of it destined for Asian markets.
The reason traffic has not recovered is not physics. It is insurance, crew refusal to work in a designated war zone, and the absence of any authority coordinating passage through a narrow stretch of water where vessels have been attacked. Those are not problems that resolve when a headline improves.
Iran's foreign minister has been explicit about the terms: the waterway does not reopen until Washington meets conditions including sanctions relief and war reparations. That framing has not shifted.
What has partially offset the closure is bypass infrastructure. Saudi Arabia has pushed volumes to Yanbu and Muajjiz on the Red Sea and the UAE to Fujairah, lifting combined alternative-route exports substantially. Those pipelines carry lighter crude grades only, which leaves heavier barrels stranded. Iraq has no bypass at all — over 90% of its exports sit behind the strait, and the country has resorted to trucking 50,000 barrels per day to Syria's Banias port. Kuwait has no options whatsoever.
Loadings peaked at 20 million barrels per day at the start of July and dropped to around 12 million later in the month.
Increasing volumes are now bypassing the strait entirely or relying on US naval protection and ship-to-ship transfers to move covertly out of the Persian Gulf. A leaky Hormuz blunts Tehran's energy weapon and eases pressure on gasoline prices, buying Washington time to prolong the standoff.
That leakage is the reason Brent is at $94 rather than $118.
The IEA Deficit Just Doubled To 1.8 Million Barrels A Day
The August balance revision is the most bullish datapoint on the board and it received almost no coverage.
The global oil balance is now expected to show a deficit of 1.8 million barrels per day in the third quarter — more than double the roughly 800,000 barrels per day estimated a month earlier. That is not a marginal revision. It is a doubling of the tightness assumption in a single monthly cycle.
The supply side drove it. Global oil supply is now forecast to fall by 4.3 million barrels per day in 2026 to 102 million barrels per day, with growth of 1.4 million barrels per day from the Americas only partly offsetting losses in the Middle East and Russia. That revision came after transit volumes failed to recover through July and an agreement enabling Hormuz reopening remained elusive.
The demand side moved the other way and softened the blow. Second-half 2026 global demand was cut by roughly 550,000 barrels per day against the prior month's estimate, as the continued closure disrupts international supply chains and curtails product availability. Elevated fuel prices are putting further downward pressure on consumption. Global demand is now expected to decline by an average of 1.6 million barrels per day this year.
That demand destruction is the reason $94 has not become $118 again. High fuel prices, reduced availability and government initiatives have curbed consumption, particularly across Asia, with the world consuming roughly 1 million fewer barrels per day on average than last year.
The scale of what has already happened is worth restating. Global oil supply plummeted 10.1 million barrels per day to 97 million in March — the largest disruption in history. OPEC+ production fell 9.4 million barrels per day month-over-month to 42.4 million. Middle Eastern producers cut output by over 11 million barrels per day at the trough.
Supply rebounded 4.1 million barrels per day to 98.8 million in June when the interim ceasefire briefly reopened flows, then rolled back over as hostilities resumed on July 7 and 8.
The market is projected to return to surplus toward the end of this year. The IEA's own language flags that risks remain substantial and the urgency of reopening the strait has increased, because the inventory buffers that absorbed the first six months are running out.
Global Stocks Below 7.9 Billion Barrels For The First Time Since April 2025
The buffer is the story nobody is watching closely enough, and it is nearly gone.
Global observed oil inventories plunged by 69 million barrels — 2.2 million barrels per day — in July, dragged lower almost entirely by a drop in oil on water. By the end of that month, observed stocks had fallen below 7.9 billion barrels for the first time since April 2025.
Cumulative stock draws between the end of February and the end of July reached 410 million barrels, an average of 2.7 million barrels per day across five months. That is the equivalent of removing an entire mid-sized producer from the market every day for almost half a year.
The OECD position is worse than the headline. Inventories in OECD countries fell to their lowest level since 2003. Government-held emergency stocks dropped 163 million barrels — 1.8 million barrels per day — to their lowest level since December 1990, as the pace of emergency releases accelerated.
That December 1990 reference is not incidental. It is the previous Gulf crisis, and it took a coordinated release plus a war resolution to rebuild from it.
The IEA has already executed the largest collective action in its history, releasing 400 million barrels from strategic stocks in March. That dwarfs the five prior coordinated releases, the largest of which was 180 million barrels across two tranches in 2022. Japan drew 15 days of private-sector reserves and a month of national reserves. Canada coordinated commercial stocks.
The mechanism has been used. It cannot be used again at that scale without leaving consuming nations genuinely exposed.
That is the asymmetry underneath this market. Every additional week of Hormuz closure draws down a buffer that is already at multi-decade lows, and the tools for offsetting it have been spent. A supply shock arriving into 7.9 billion barrels of global stocks behaves differently than one arriving into 8.5 billion.
Loadings dropping from 20 million barrels per day to 12 million within a single month tells you the draw is accelerating rather than stabilizing.
The EIA Says $85 Brent — The Curve Disagrees
The official US forecast and the traded price have separated, and the gap is the trade.
The EIA's August Short-Term Energy Outlook forecasts Brent to average approximately $85 per barrel in the third quarter of 2026 — an $11 per barrel upward revision from the prior month's projection. The agency estimates global inventories fell an average of 4.2 million barrels per day in the second quarter and will fall an additional 3.8 million barrels per day in the third.
The assumption underneath is that constraints on Hormuz transits persist through August, that most regional crude production returns to near pre-conflict averages in early 2027, and that ongoing disruptions of about 600,000 barrels per day continue beyond that. As inventories rebuild, Brent is expected to fall gradually.
Brent is currently trading $8.96 above that quarterly average forecast with five weeks left in the quarter. Either the forecast is stale or the market is carrying a risk premium the agency does not model.
The revision history explains why the agency has been behind. In March, with Brent settling at $94 and prices up roughly 50% year-to-date, the EIA lifted its 2026 Brent average from $58 to $79 and its 2027 forecast from $53 to $64 — a one-month revision of $21 and $11 respectively. In June it flagged Brent averaging $105 in June and July. In August it settled on $85 for the third quarter.
Those are enormous swings in a forecast that is supposed to anchor policy, and they reflect an input variable — the strait — that has no forecastable path.
US production is the offsetting structural response. The agency projects domestic crude output averaging 13.6 million barrels per day in 2026 before rising to 13.8 million in 2027, roughly half a million barrels per day higher than earlier forecasts. High prices are pulling American barrels forward, which is the mechanism that eventually caps this market.
The 2027 picture is where the forecast turns genuinely bearish, and it is the part almost nobody is positioned for.
US Crude Built 4.4 Million Barrels And The Tape Ignored It
The weekly domestic data has stopped mattering, and that itself is a signal.
EIA data showed US crude inventories increased by 4.4 million barrels over the reporting week. In a normal market, a build of that size against expectations produces an immediate sell-off — it implies weaker demand and looser physical balance. Crude closed higher.
The reason is that the marginal barrel setting global price is not in Cushing. It is on a tanker that cannot leave the Persian Gulf. US commercial inventories are a demand indicator for one region in a market where the binding constraint is a chokepoint 7,000 miles away.
There is a second dynamic. The US has become a net beneficiary of the disruption. International buyers seeking alternative supply drove up American refinery margins, production and exports through the second quarter. Domestic crude stacking up at the same time that Gulf Coast refiners run hard and export product is a sign of the system reorienting, not of demand weakness.
The product picture is where the tightness actually shows. Distillate inventories sat 11% below the five-year average as of the week ending July 10. Middle East export refineries have yet to restart. Russian throughputs remain curtailed by drone attacks. Asian refiners are running at reduced rates.
Global refinery runs rose 1.5 million barrels per day in June but were still down 6 million barrels per day year-over-year. Global runs are expected to decline 2.4 million barrels per day this year and rebound 3.1 million in 2027. Crude throughputs are forecast to contract 2 million barrels per day in 2026 to 82 million.
Ukrainian drone attacks on Russian refineries have continued through this week, adding another layer to the product squeeze that has nothing to do with Iran.
Cushing inventories — the WTI delivery hub — have been drawing even as the national number builds, which is why the WTI-Brent spread has behaved the way it has. Brent at $93.96 against WTI at $86.94 is a $7.02 differential, wide by historical standards and reflecting that the disruption premium sits offshore.
Read More
-
Yen Stalls at 160 Despite a 3% JGB and Tokyo Core CPI at 2.0% — Intervention Sits at 164, Friday's Payrolls Decide
02.09.2026 · TradingNEWS ArchiveEnergy
-
QQQ ETF ($706.22) Slides 7.4% Below Its High as the Market Reprices the AI Capex Bill — $686.57 Target if $700 Breaks
22.10.2026 · TradingNEWS ArchiveStocks
-
XRPI ($7.00) and XRPR ($10.74) Slide Toward 52-Week Lows as Spot XRP ETF Flows Stall at $708,510
22.10.2026 · TradingNEWS ArchiveCrypto
-
NG ($2.775) Decoupled From Europe’s €88 Gas Crisis as LNG Feedgas Hits 18.9 Bcf/d — $3.30 Upside on Cold Weather
22.10.2026 · TradingNEWS ArchiveCommodities
-
Dollar-Yen (157.35) Loses 157.65 as the Yen Rallies on Haven Demand — 155 Target if 156 Breaks
22.10.2026 · TradingNEWS ArchiveForex
Products Are The Real Squeeze — Cracks At Four-Year Highs
The crude price understates what is happening downstream, and the forward view says that continues.
Refined product cracks and margins surged to four-year highs in early July as increased crude supplies briefly pushed oil prices sharply lower while product markets stayed tight. Middle distillate cracks reached all-time highs earlier in the crisis. Refining margins have remained at historically elevated levels throughout.
The structural read from the trading side is direct: while Brent could range widely depending on which scenario plays out, product markets are expected to feel a more significant impact, with refinery constraints and energy security concerns keeping cracks and margins elevated.
That distinction matters for anyone modelling the inflation transmission. Crude at $94 is a headline. Diesel and jet cracks at multi-year highs are what actually reaches the consumer and the industrial base, because those are the fuels that move freight, run generators and fly aircraft.
The mechanism is capacity, not crude availability. Middle East export refineries — the ones designed to serve Asian and European product markets — have not restarted. Those facilities represent a substantial share of global distillate export capacity. When they are offline, crude can be plentiful and product can still be scarce.
Russia compounds it. Continued Ukrainian drone attacks on refineries have curtailed throughput repeatedly through 2026, removing another large distillate exporter from the balance at exactly the wrong moment.
The consumer impact is already visible in the US data. Walmart pointed to customers making trade-offs against elevated fuel prices when reporting its slowest US comparable sales growth in more than six years. July retail sales fell 0.6% against expectations for a 0.1% gain. Trump has warned Americans to prepare for persistently high fuel prices while the conflict continues.
European natural gas is running the same playbook, with prices soaring on Middle East supply shortages and adding upside risk to euro-area inflation.
For the Federal Reserve, this is the variable that keeps a September hike alive. Energy-driven inflation is exactly the input that turns a hold into a move, and the September 16 decision lands two weeks after Monday's sanctions announcement.
Spare Capacity Is Trapped Behind The Strait
The reason this disruption has been so severe is structural and it has not been fixed.
The world's spare crude production capacity — held primarily by Saudi Arabia — was running over 4 million barrels per day heading into this conflict. That is normally the shock absorber: when supply is disrupted somewhere, Riyadh opens the taps and the market rebalances within weeks.
The problem is geography. The vast majority of that spare capacity sits behind the same chokepoint that is closed. A disruption to Hormuz does not just remove transiting barrels — it simultaneously removes the ability to replace them. That is what makes this event categorically different from a Libyan outage or a Nigerian shut-in.
The bypass routes cover only part of it. The Abqaiq-Yanbu system carries Saudi crude to the Red Sea. The ADCOP pipeline moves roughly 1 million barrels per day from Abu Dhabi onshore fields to Fujairah. Both are running at elevated rates and both remain vulnerable to attack — the Red Sea route sits within reach of the Bab el-Mandeb strait, where a separate blockade threat against Saudi exports emerged in July.
Kuwait has nothing. In 2025 the country exported 1.4 million barrels per day of crude and 1.1 million of products, all through Hormuz. At the start of the war it had about 14 days of storage. It began curtailing production almost immediately.
Iraq is the most damaged major producer. Over 90% of exports sit behind the strait, financial buffers are thin, and the country's budget relies on oil revenues for roughly 90% of receipts. It has resorted to trucking barrels to Syria.
Qatar's entire LNG export volume — over 112 billion cubic metres in 2025, making it the world's second largest exporter — transits Hormuz except for deliveries to Kuwait. That is the gas leg of the same problem, and it is why European gas prices are running hot.
Rebuilding transit is not a single decision. It requires maritime insurance, crew willing to work a war zone, and a coordinating authority for passage that does not exist. VLCC charter rates have risen to more than six times normal levels.
The Levels: $94 Overhead, $86 And $84 Underneath
Brent resistance. $94.00 is the line the contract has attempted and failed to settle above. $94.24 is the intraday high and the highest print since July. A daily settle above $94.00 opens $96, then $100 — the level that carried through most of the second quarter. Above $100, the April 29 high at $118 becomes the structural reference, and that requires a genuine escalation rather than a sanctions announcement.
Brent support. $93.00 is the immediate shelf. Below that, $88.52 marks the August 14 settle and the base of this leg. $84.11 was the level in early August before the hardening of Washington's position, and it is where the market traded when a deal looked imminent. Below $84, the July low near $77 and the $72 print from June 26 define the downside if Hormuz reopens.
WTI resistance. $86.94 for October is the current handle, with $87 the round number immediately overhead. The July 24 high is the reference the contract just reclaimed. Above $88, $90 opens.
WTI support. $86.21 is the low print on the September contract this session. $82.40 marks the August 14 settle. Below that, the high $70s come into play on any de-escalation headline.
The spread. Brent at $93.96 against WTI at $86.94 is $7.02. That differential is the cleanest single measure of how much of this price is geopolitical rather than fundamental. Watch it narrow if the strait reopens.
The event structure is unusually clean for a commodity. Monday delivers the sanctions detail. If the measures target Chinese refiners explicitly and Beijing responds with defiance, the risk premium expands and $94 breaks. If the announcement is framework language without enforcement teeth — the pattern the market has seen repeatedly — the premium bleeds and $88 comes back into range.
Any genuine movement toward reopening Hormuz takes both benchmarks down $10 in a session. That is the gap risk sitting under every long position.
The 2027 Overhang Nobody Is Trading Yet
The forward curve contains a problem that current price action is completely ignoring.
The first look at 2027 balances shows a significant overhang emerging. Global oil demand is projected to rise a relatively modest 2 million barrels per day to 105.3 million. Global oil supply is set to surge by around 8 million barrels per day to 110 million. That is a 4.7 million barrel per day surplus in a single year.
The mechanism is straightforward. Middle Eastern production that has been shut in for a year comes back. The EIA expects most regional crude output to return to near pre-conflict averages in early 2027, with ongoing disruptions of only about 600,000 barrels per day persisting. Simultaneously, US production reaches 13.8 million barrels per day, Brazilian output stays at record levels, and the Americas add 1.4 million barrels per day of growth that was incentivized by two years of elevated prices.
If transit volumes improve, supply expands by 7.5 million barrels per day next year. Global demand rebounds 2.5 million barrels per day in 2027 as prices decline — but that is nowhere near enough to absorb the supply return.
The forecast puts Brent averaging $64 per barrel in 2027 against $79 in 2026.
That is the trade nobody wants to put on while the tape is grinding higher, and it is why the curve structure matters more than the spot print. Every month that Hormuz stays closed pulls forward demand destruction that does not reverse — Asian consumers who switched fuels, industrial users who cut throughput, drivers who changed behaviour. Roughly 1 million barrels per day of demand has already been permanently rerouted or eliminated.
When the barrels come back, they come back into a market with structurally lower consumption than the one they left.
The framing from the agency itself is that any scenario involving full restoration of inventories, production and trade flows to pre-conflict levels must account for the partial restructuring of the global oil market that has already occurred.
The counterweight is inventory. Global stocks at 7.9 billion barrels and OECD government reserves at 1990 levels have to be rebuilt before any surplus reaches price. That absorbs a substantial share of the 2027 supply return before it touches the spot market.
Oil Price Forecast: Base, Bull And Bear Into Q4
Base case. Brent holds a $88 to $96 range through September while the market waits to see whether Monday's sanctions have enforcement behind them. This is the highest-probability path. The physical deficit at 1.8 million barrels per day and inventories below 7.9 billion barrels put a hard floor under the market. Demand destruction of 1.6 million barrels per day and the leakage of Gulf crude around Hormuz cap it. WTI runs $82 to $89 in the same scenario, with the spread holding near $7. Watch the daily settle against $94.00 as the cleanest read on control.
Bull case. Monday delivers secondary sanctions with genuine enforcement against Chinese refiners, Beijing responds by defending its purchases, and the market prices a broader trade rupture on top of the supply constraint. Brent clears $94.00, opens $100, and the April high at $118 comes back into the conversation. The accelerant would be any Iranian escalation — a renewed attack on Gulf shipping, a strike on a Saudi or Emirati bypass facility, or a formal closure declaration. With OECD government stocks at their lowest since December 1990 and the IEA having already spent its largest-ever release, there is no policy tool left to cap a genuine spike. That scenario gets to $110 fast.
Bear case. Tehran calculates that financial isolation on top of a 6% contraction and 53.9% inflation is unsurvivable, and returns to the table. Any credible movement toward reopening the strait takes Brent through $88 and toward $84 in a session, then toward the July low near $77. The June precedent is instructive: the memorandum of understanding sent Brent from $118 to $72 inside eight weeks. That gap risk exists under every long position in this market and it does not announce itself in advance.
What actually decides it. Three things, in order. Monday's announcement and specifically whether it names Chinese entities. The weekly Hormuz transit count — 73 and falling is bullish, any move back toward 91 and above is the first sign of normalization. And the September 16 Fed decision, because energy-driven inflation running through elevated distillate cracks is the input most likely to force a hike, and a hike into a $94 Brent tape is the combination that breaks demand rather than supply.
Brent at $93.96 is pricing a stalemate. The risk is that Monday turns a stalemate into something with a direction.





