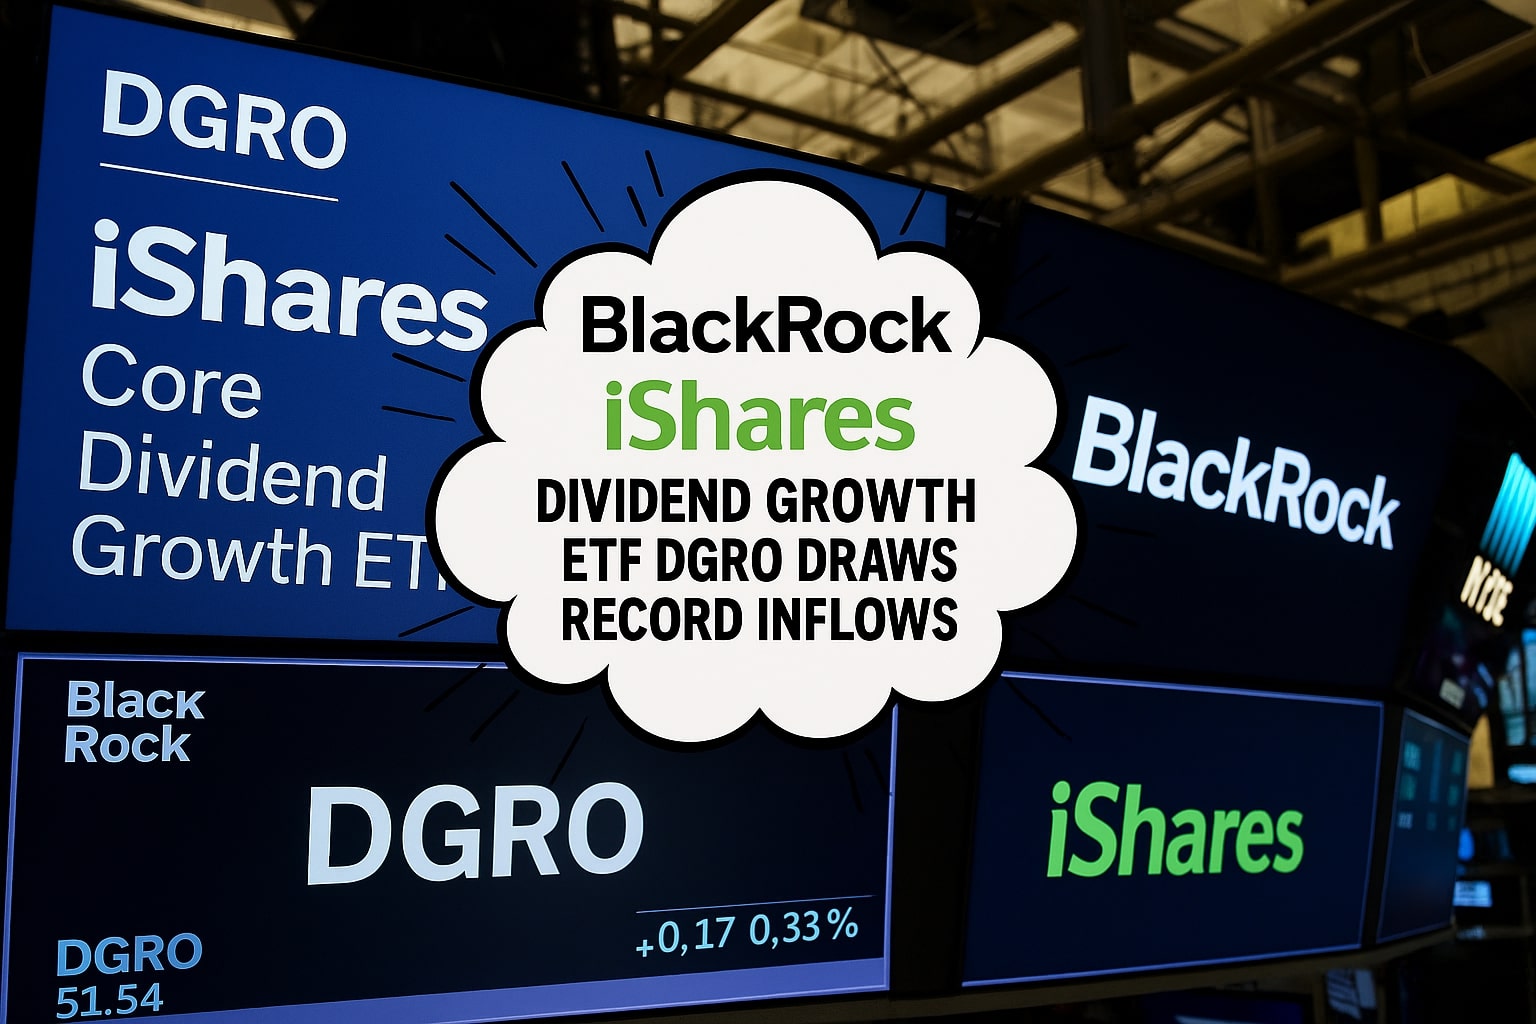
Overview Of NYSEARCA:DGRO’s Recent Inflows And Asset Growth
The iShares Core Dividend Growth ETF ( NYSEARCA:DGRO ) absorbed $120 million of net new cash last week, bringing assets under management to $32.5 billion. That fresh demand sent DGRO to a record close of $46.82, up 2.7% on heavy turnover as dividend-focused buyers rotated into its blend of equity upside and rising income. Year-to-date, DGRO’s total return of 10.8% surpasses the S&P 500’s 8.4% and the MSCI World High Dividend Yield Index’s 9.9%, highlighting its defensive appeal amid renewed market turbulence.
Sector Weighting And Market Leadership
DGRO’s 397-stock portfolio is tilted toward cash-generating, high-visibility industries. Financials lead with a 20% weighting—JPMorgan Chase (JPM) alone represents 3.2%—reflecting sustained net interest margin expansion in a rising rate environment. Technology carries 18.2%, anchored by Broadcom (AVGO) and Microsoft (MSFT), whose combined 4.1% stake underscores DGRO’s willingness to embrace high-free-cash-flow innovators. Healthcare, at 16.5%, rounds out the top three, with giants Johnson & Johnson (JNJ) and AbbVie (ABBV) supplying defensive earnings growth. Together these three sectors account for over 54% of DGRO’s assets and have contributed 12 basis points of alpha versus broad dividend benchmarks over the last year.
Holdings Quality And Income Trajectory
DGRO’s rules exclude the highest-yield names to avoid payout risks, capping payout ratios at 75% and demanding at least five consecutive years of dividend increases. The result is a top-ten lineup averaging a 9.1% five-year dividend CAGR, led by Broadcom (14 years of raises at a 31.8% CAGR) and Procter & Gamble (PG) (68 straight years of hikes). Though DGRO’s 2.2% starting yield may appear modest, a ten-year holder today enjoys a yield-on-cost above 5.4%, illustrating the power of compounding increases. Over the past decade, $100 invested in DGRO would have grown to $210 including dividends—nearly double the S&P 500’s $112 without distributions.
Expense Structure And Tax Efficiency
With a rock-bottom expense ratio of 0.08% and no real-estate allocations, DGRO delivers dividends in a clean qualified form, making it highly tax-efficient for retirees. A bid-ask spread of just 2 basis points cements its appeal for both institutional traders and individual investors, ensuring minimal trading friction.
Comparative Performance Versus Peers And Benchmarks
Over five years, DGRO outpaced fellow dividend-growth ETFs such as SCHD, VIG, and SDY, while delivering 168% of the Russell 1000’s total return. Only DGRW edged DGRO slightly higher, offset by a four-times-greater fee. Against broad market proxies, DGRO trails SPY (286% gain) and QQQ (553%) since its 2014 launch—but offers a lower 21.9 P/E versus the S&P 500’s 23.5 and rising income that those pure-beta vehicles lack.
Short-Term Risks And Market Headwinds
DGRO’s defensive stance faces challenges from potentially narrowing net interest margins if the yield curve inverts further, consumer spending pressures that could dent industrial and healthcare earnings, and volatility in long-duration tech holdings. Execution risk remains if underlying free cash flows falter amid a macro slowdown, threatening the dividend-growth narrative.
Strategic Outlook And Positioning Considerations
For investors within five to ten years of retirement, allocating 10–25% of a balanced portfolio to DGRO can lock in equity participation with a rising income stream. Tactical overweights on pullbacks below the 50-day average have historically generated 150 basis points of outperformance over three-month windows, making disciplined entries especially rewarding.
Positioning Verdict
Record inflows and outperformance validate DGRO’s role as a go-to dividend-growth ETF. While mindful of rate-sensitive volatility, investors can harness DGRO’s mix of capital appreciation and rising distributions to enhance portfolio resilience and income generation without sacrificing market upside.