Ethereum's Market Dynamics: A Comprehensive Price and Trend Analysis
Delving into Ethereum's Current Position and Future Prospects: Analyzing Price Movements, Technical Indicators, and Comparative Market Performance | That's TradingNEWS
Ethereum's Price Trajectory Amidst Global Market Shifts
Introduction to Ethereum's Market Position
Ethereum, the second-largest cryptocurrency by market capitalization, has recently entered a correction phase that commenced in the second week of December. From its high of $2,400, Ethereum experienced a 10% drop to a current level of $2,158. This decline marks a potential breach below the support trendlines of the rising channel pattern, suggesting a risk of further correction for ETH.
Ethereum's Price Movements Within Market Patterns
Over the last two months, Ethereum's price recovery has been characterized by its movement within a rising channel pattern, confined by parallel trendlines that offer dynamic resistance and support. The recent market sell-off has led to a breakdown below this pattern's lower trendline, hinting at a potential upcoming correction. A daily candle closing beneath this breached trendline could empower sellers, possibly driving prices lower.
Potential Price Directions and Support Levels
Should Ethereum's price continue to decline, it could face a further 10% decrease, reaching a support level at $1,920. This level aligns with the 50% Fibonacci retracement level. However, a correction to this Fibonacci level could still signify a healthy market adjustment, potentially laying the groundwork for a future rebound.
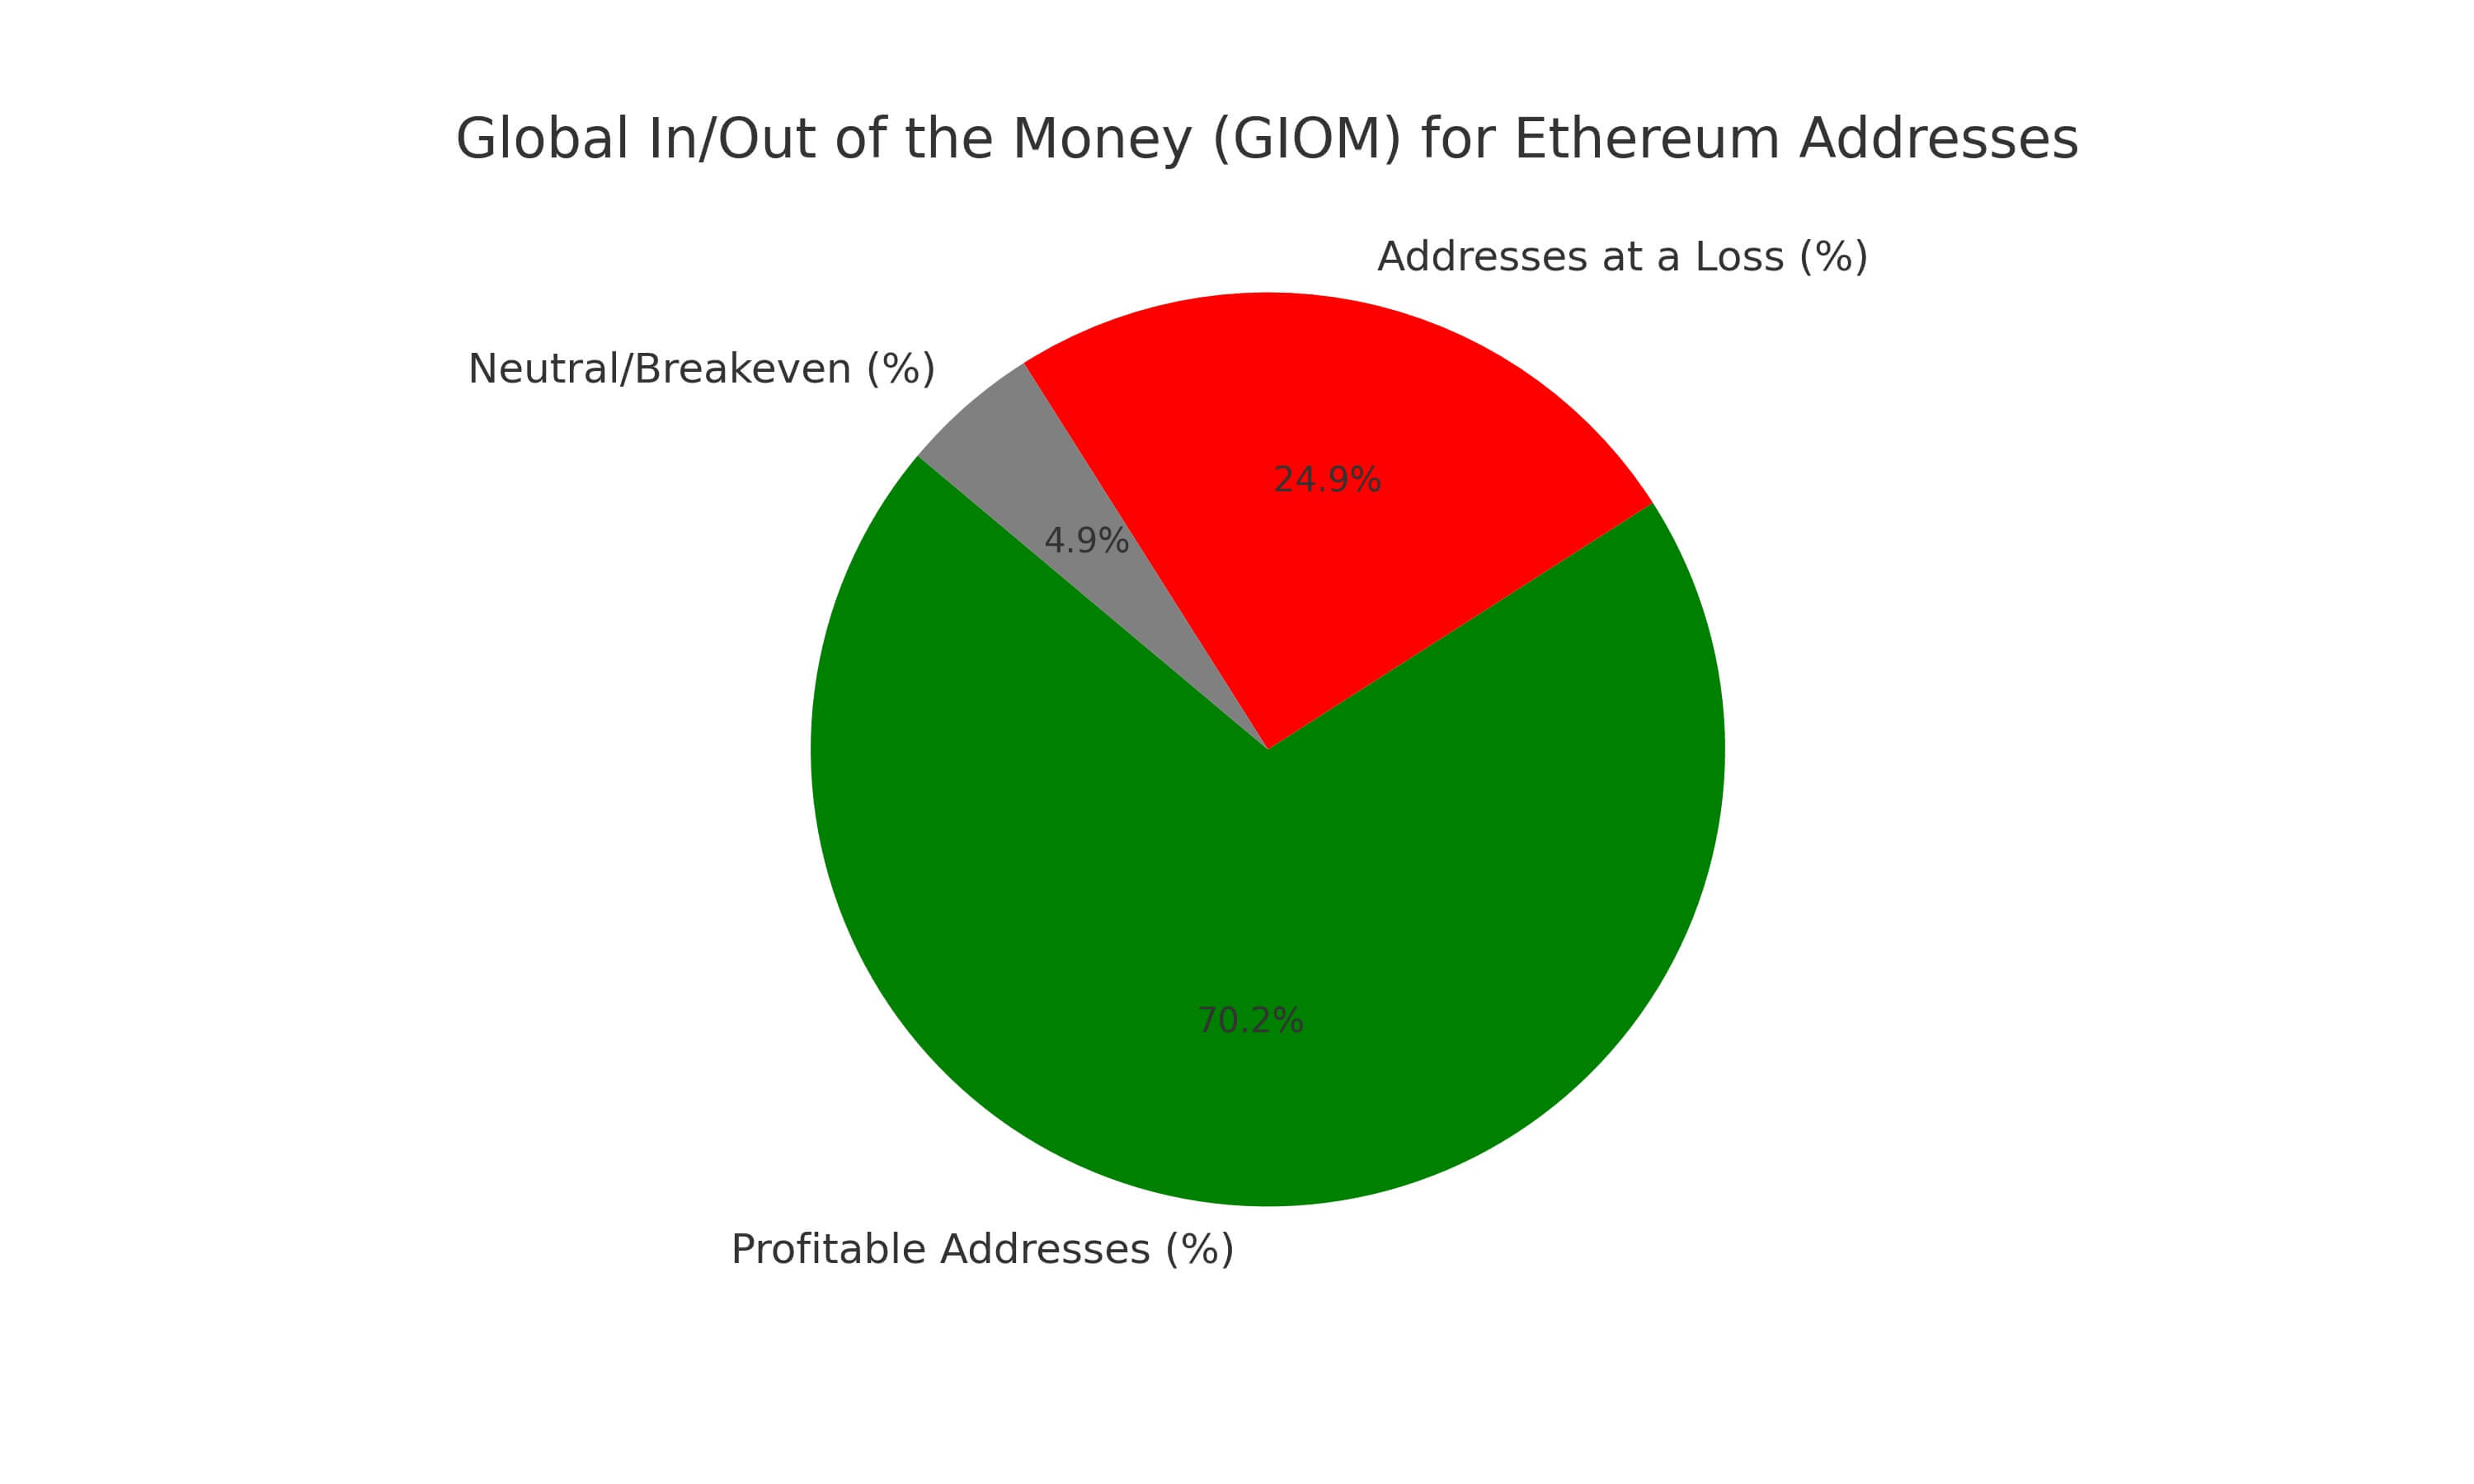
Global In/Out of the Money (GIOM) Metrics
According to the Global In/Out of the Money (GIOM) metric, 70.18% of Ethereum addresses are currently profitable, while 24.9% are at a loss. This distribution suggests a relatively stable investor base, potentially supporting a sustained bullish trend in the future.
Comparative Analysis with Bitcoin and Ripple
Bitcoin and Ripple have also shown signs of weakness recently, with Bitcoin struggling to maintain the $40,000 level and Ripple facing downward pressure. Ethereum, however, has been defending a critical support at $2,147, which could lead to a 7% rise to $2,293. In contrast, Bitcoin is attempting a recovery amid the intensifying spot ETF wars, potentially increasing towards the $50,000 level.
Technical Indicators and Future Projections
Technical indicators like the Relative Strength Index (RSI), Awesome Oscillators (AO), and the Moving Average Convergence Divergence (MACD) show that bulls maintain a presence in the Ethereum market. Ethereum's price action between June 2022 and November 2023 formed an ascending triangle setup, a bullish pattern suggesting a potential upswing to the $2,943 level.
Ethereum ETF Developments and On-Chain Metrics
The delay in the approval of the Ethereum ETF by the SEC, combined with a slump in on-chain activity, points to a potential sideways movement for Ethereum. Despite these challenges, Ethereum’s price remains neutral-to-bullish. A decisive breakout above $2,539 could signal a bullish outlook, potentially leading to a retest of the $3,000 level.
Whale Activity and Market Speculations
Recent whale activities, including the accumulation of over 100,000 ETH worth approximately $230 million, indicate a strong belief in a bullish continuation for Ethereum. This buying spree by large investors is a significant factor that could influence Ethereum's price rally in the near future.
Conclusion
Ethereum's current market dynamics, influenced by technical patterns, investor sentiment, and global economic factors, paint a complex picture for its future price trajectory. While challenges such as ETF delays and market corrections exist, the underlying strength in investor base and whale activities provide a potentially bullish outlook for Ethereum as it navigates through these market shifts.
Read More
-
VVSMF Fund Rides the AI Chip Boom Near Records as the Sector Wobbles
01.07.2026 · TradingNEWS ArchiveStocks
-
XRP ETFs Grind Near Their Floors as Institutions Lock 900M XRP in a Coiled Divergence
01.07.2026 · TradingNEWS ArchiveCrypto
-
Natural Gas Churns Near $3.22 as a Brutal Heat Wave Battles a Bloated Storage Surplus
01.07.2026 · TradingNEWS ArchiveCommodities
-
Dollar-Yen Rips to a 40-Year High Near 162.5 as the Rate Gap Widens and Tokyo Eyes Intervention
01.07.2026 · TradingNEWS ArchiveForex