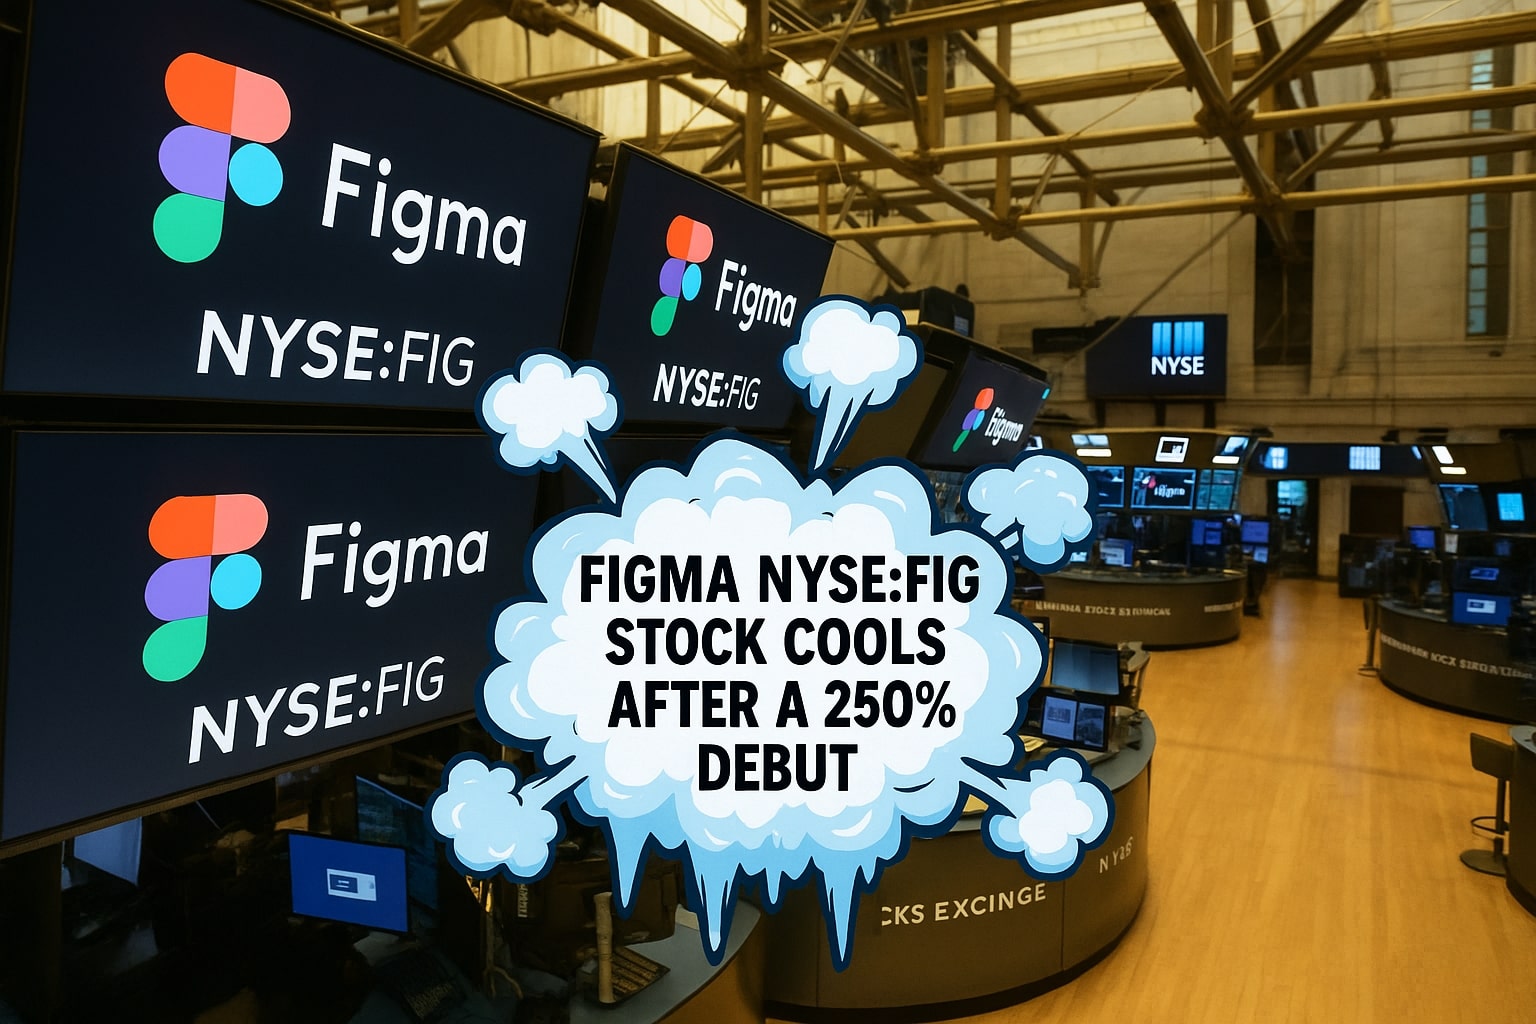
Figma Stock NYSE:FIG — Price Action, Liquidity, And What The Market Is Really Paying For
NYSE:FIG priced its IPO at $33, opened around $85, ripped to a first-day close near $115–$116, printed a 52-week range of $33.00–$142.92 almost immediately, and then bled back into the $90s before slipping into the high-$80s and, at one point, the high-$70s ($77.9–$88 prints were recorded on subsequent sessions). That price swing toggled market cap from roughly $60 billion intraday to the mid-$40 billions on the pullback, with day ranges like $77.82–$87.78 underscoring how little supply is truly trading. The float is tight: roughly 43 million shares were offered, near 10% of outstanding, with a lockup that runs into early 2026, so each $5 move adds or erases ~$2.5–$3.0 billion of equity value on thin liquidity. The valuation math at $100 per share implies well north of 40x forward revenue; at $80–$90 it’s still ~35–40x on a $0.9–$1.0 billion run-rate, which is why the stock whipsaws every time price approaches a new big-figure.
NYSE:FIG — Revenue, Margins, And Operating Cadence Behind The Print
Topline of $228.2 million in Q1 2025 grew 46% year-over-year, implying a $900 million–$1.0 billion annualized run-rate as the pipeline converts. FY24 revenue of ~$749 million rose ~48% year-over-year. Gross margin hovers near 88%–91%, operating margin was ~17% in the most recent profitable quarter, and net income near $44.9 million underscores genuine operating leverage at scale. Rule-of-40 sits in the low-60s (growth ~46% plus operating margin ~17% ≈ 63), which is elite for collaboration software at this revenue base. The balance sheet carried about $1.54 billion in cash versus ~$544 million in total liabilities pre-IPO, giving real dry powder to fund product expansion without relying on dilutive secondaries at $80–$100 per share.
NYSE:FIG — Customer Quality, Expansion Engines, And Why Net Retention Matters At This Price
Roughly 95% of the Fortune 500 use the platform, 13+ million monthly actives keep the usage flywheel spinning, and net dollar retention around 132% means existing customers expand spend by ~32% net of churn. Gross retention near 96% caps the leaky bucket risk. Cross-sell is working: teams add whiteboarding (FigJam), dev handoff (Dev Mode), presentations (Slides), and sites, with two-thirds of users now outside “pure design.” The international mix is heavy—about 80% of weekly actives are ex-U.S.—which both broadens TAM and adds FX and pricing nuance. At $85–$95 per share the market is paying a premium multiple for that expansion math; the burden is on management to keep net retention above 120% and grow enterprise seats double-digit quarterly to defend anything above 30x forward sales.
NYSE:FIG — AI Feature Set, Product Velocity, And The Path To A Larger TAM
Dev Mode translating designs to code, prompt-driven layout generators (First Draft-style workflows), and automated asset tasks extend the surface area of monetization beyond UI/UX. The practical test is revenue per seat: if AI features lift ARPU by 10–20% while keeping gross margin ≥88%, then a $1.0 billion run-rate becomes $1.2–$1.4 billion without heroic seat growth. The strategic lens is simple: AI that shortens design-to-dev cycles by days gets priced in contracts; AI that’s a toy does not. At $90 the stock already discounts a multi-year AI upsell—miss the adoption curve and a re-rating toward 20–25x forward revenue is on the table; execute, and sustaining 30–40x is possible even as revenue crosses $1.5–$2.0 billion over the next 8–12 quarters.
NYSE:FIG — Competitive Set And Why Pricing Power Is The Real Moat
The closest incumbent alternative can bundle aggressively, but collaboration-first workflows and cloud-native performance keep switching costs high. The KPI investors will punish or reward is realized price per enterprise seat versus discounting. If list-to-realized spread widens as the share price dips (say, $90 down to $80) that’s a warning on pricing power; if realized prices hold or rise while the stock pulls back, that’s a setup for multiple resilience. Watch big logos adding Dev Mode or Slides into renewals; one 10,000-seat expansion at a $5–$10 uplift per seat per month is $600k–$1.2 million annualized from a single customer, and a dozen of those quarter-to-quarter closes move the revenue needle at this scale.
NYSE:FIG — Valuation Reality Check At $77–$116 And What Must Happen To Grow Into It
At $100, with revenue trending ~$1.0 billion and a credible 40% growth year, you’re paying ~40x forward sales. For comparison, a mature peer often trades between 6–8x forward revenue at ~10% growth; even high-growth, profitable SaaS leaders today skew closer to mid-teens to mid-20s sales multiples. For FIG to justify 35–45x, two conditions need to hold: multi-year revenue CAGR ≥35% and durable non-GAAP operating margin expanding from high-teens toward low-20s as AI features monetize. The bull math: $1.0 billion → $1.35 billion → $1.8 billion over two years; at $1.8 billion and 30x, equity is ~$54 billion; at 35x, ~$63 billion; at 40x, ~$72 billion. The bear math: growth decelerates to mid-20s, ARPU uplift is slow, and the multiple compresses to 22–25x; on $1.4 billion that’s $31–$35 billion—equity 25%–40% below a $55–$60 billion handle.
NYSE:FIG — Supply Overhang, Lockup Dynamics, And Why The Tape Trades Like It’s Thin
Only ~10% of shares were freely tradable at listing—about 43 million shares—hence the $33 → $115 → $90 rollercoaster. A lockup through January 2026 keeps supply tight, but secondary prints from early holders or any incremental unlocks can add pockets of liquidity. With day volume swinging from ~14 million to ~35 million shares around headline days, price can gap $10 on routine order flow. Map your expectations accordingly: at $83 the same buy ticket that barely moved the stock at $115 can be a 100–150 bps intraday catalyst now. Use the real-time chart to monitor these squeezes: TradingNEWS-Realtime.
Figma NYSE:FIG — Insider Ownership, Transactions, And What To Read Into Form 4s
Voting control is heavily concentrated—leadership influence north of 70% is a fair proxy—so governance risk isn’t theoretical. The signal to watch is insider behavior into and after unlock windows. Net insider buying near $75–$85 would be a strong endorsement; programmed selling into strength at $105–$120 could cap rallies. Track filings and aggregated prints here to separate noise from signal: Insider Transactions and the broader Stock Profile. If the first significant Form 4s are option-related and small relative to ownership, that’s housekeeping; if multiple senior execs sell sizable blocks into thin tape, expect technicians to lean on the offer.
NYSE:FIG — What The Tape Is Saying Right Now And The Levels That Matter
The stock’s early base has carved out key waypoints: $85–$88 as a battle zone, $97–$100 as the psychological magnet, $115–$116 as the IPO-day close pivot, and the spike zone up to ~$142. If price reclaims and holds $100 on rising volume and pushes through $110–$116, momentum players will chase and you can see a fast re-test of $125–$130; fail to hold $85 on a market-down day and bids can vanish to the mid-$70s in a hurry. On a valuation-sensitive name like this, macro beta matters: a 1% move in the broader software cohort can be a 3–4% move in FIG when the float is starved and the book is thin.
NYSE:FIG — Risk Ledger And Offsetting Catalysts With Dollar Signs Attached
Principal risks at $80–$100 are multiple compression, a potential wave of supply when lockups expire, and the possibility that AI-assisted design compresses willingness-to-pay faster than the company can invent new SKUs. Offsetting catalysts are concrete: enterprise expansions that lift ARPU by mid-teens, AI add-ons that monetize at $10–$30 per seat per month, and continued 40%+ revenue growth that keeps non-GAAP operating margin tracking from ~17% toward 20%+. Each 100 bps of margin expansion on $1.0 billion is ~$10 million of incremental operating income; stack that for eight quarters and a high-multiple equity story becomes a compounding cash-flow story, which is how you keep 30x+ sales alive through 2026.
NYSE:FIG — Positioning Call With A Number On It
At $77–$85 the stock prices in a lot of fear but still embeds a premium; at $95–$105 it assumes near-perfection on growth and AI monetization. On the data in hand—$228.2 million Q1 revenue (+46% y/y), ~$44.9 million net income, ~90% gross margin, 132% net retention, 95% F500 penetration, $1.54 billion cash—this is a Hold at $85–$100 with a neutral-to-slightly-bearish near-term skew until the market digests supply and the company strings together two more quarters at ≥40% growth and stable 17%–20% operating margins. Tactical buyers can accumulate closer to $75–$82 with a risk line just below recent lows; momentum participants should wait for a decisive break and hold above $110–$116 before leaning bullish for a run at $125–$130. If insider prints on this feed flip net-buy and the company prints $250–$270 million in a quarter with operating margin ≥18%, the stance shifts to constructive even at a higher tape.