


GLD ETF at $437.82: Gold Crashed 11.4% in March on Forced Liquidations and Real Yield Pressure
Open interest fell 33% as speculative longs were wiped out, Turkey sold 60 tonnes to fund energy imports, and $70B in leveraged ETFs triggered a mechanical cascade | That's TradingNEWS
Key Points
- Gold fell 11.4% in March — its worst monthly loss since September 2011 — as forced institutional liquidations, $70B in leveraged ETF rebalancing
- The March 23 low of $4,100 absorbed the selling as COMEX open interest collapsed 33% from 541,033 to 361,409 contracts
- Gold posted its 10th consecutive quarterly record high in Q1 2026 despite March's decline
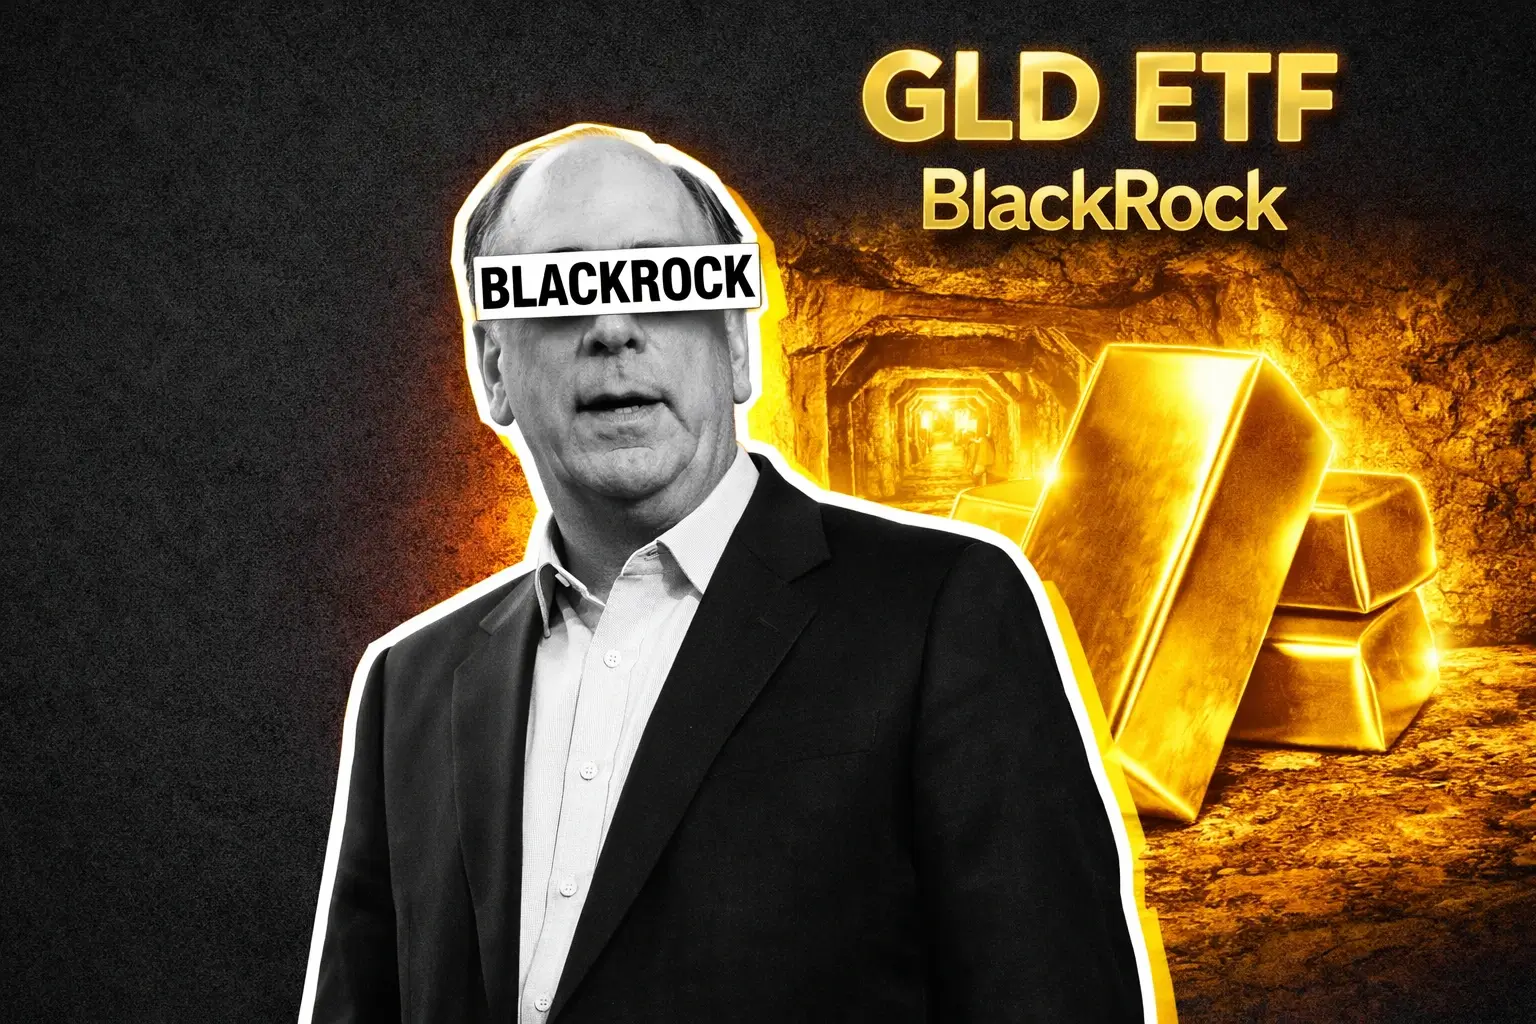
GLD ETF (SPDR Gold Trust) is trading at $437.82 on April 1, 2026, up 1.75% or $7.53 on the session with a day range of $433.79 to $440.18. The 52-week range runs from $272.58 at the low to $509.70 at the high. Market cap is $160.30 billion. Average daily volume is 14.25 million shares. AUM stands at $155.11 billion. The GLD ETF — the oldest and most successful commodity ETF, introduced in November 2004 — tracks physical gold bullion directly, holding 100% of its AUM in physical gold stored in allocated vaults. At $430.29 per ounce at the end of Q1, GLD's underlying gold price was $4,647.60 per ounce on the COMEX continuous futures contract as of the March 31 close — itself an 11.43% decline from the February close of $5,247.90. The January 29, 2026 intraday record high of $5,626.80 per ounce on COMEX gold futures represents the peak from which the current correction is measured. From $5,626.80 to the March 23 intraday low of $4,100 — a 27.2% drawdown — is a correction that has eliminated virtually all of the speculative froth that built during gold's parabolic 2025 advance. Wednesday's recovery to $4,747 on spot and $437.82 on GLD represents a 15.8% bounce from the March 23 low. The question is whether $4,100 was the cycle bottom or merely a pause before further downside.
Gold's 11.43% March Decline Was the Worst Monthly Performance Since September 2011 — and the Context Explains Everything
COMEX gold futures settled March 31, 2026 at $4,647.60 per ounce, posting an 11.43% monthly loss — the largest single-month percentage decline since September 2011. Silver futures fell 19.7%. Platinum declined 18%. Palladium dropped 18.65%. Despite gold's double-digit loss, it was the best-performing precious metal in March by a significant margin. The January 29 intraday record of $5,626.80 and the January 28 closing record of $5,400 represent levels that are now approximately $750 to $980 above current prices. Understanding why gold declined 27.2% from its all-time high during a period of active military conflict requires abandoning the simple "gold rises in wars" framework and replacing it with a more sophisticated three-variable model: the type of inflation, the mechanics of institutional liquidation, and the interest rate opportunity cost dynamic. Gold's underperformance was not a failure of the asset — it was a predictable consequence of supply-shock inflation, margin-call-driven liquidation, and rising real yields acting simultaneously on a market that had accumulated excessive speculative long positions. Each of those three forces contributed to the decline, and each of them has a defined reversal condition that will trigger the Phase 3 recovery.
Supply-Shock Inflation Versus Monetary Debasement: The Single Most Important Analytical Distinction for Gold in 2026
The central analytical error that caused gold investors to be surprised by GLD's 15% decline during the Iran war is confusing two fundamentally different types of inflation. Monetary debasement — the deliberate or structural expansion of money supply through quantitative easing, debt monetization, and fiscal dominance — is gold's natural operating environment. When governments cannot fund their deficits through taxation and resort to printing currency, gold's purchasing power is preserved relative to the debased currency. The $38 trillion-plus in U.S. public debt, combined with annualized interest expenditures projected to exceed $1 trillion in 2026, creates the fiscal dominance backdrop that drove gold from $252.80 per ounce in Q3 1999 — the 27-year bull market bottom — to $5,626.80 in January 2026. That is a 22-times price appreciation driven by the structural logic of monetary debasement. Supply-shock inflation — the type generated by the Iran war's disruption of the Strait of Hormuz and the resulting surge in energy costs — operates through completely different mechanics. When oil rises from $60 to $118 in five weeks, the inflationary pressure is not coming from money printing. It is coming from a physical supply constraint that raises the cost of everything requiring energy to produce or transport. Central banks respond to supply-shock inflation not with accommodation but with restriction — rate hikes, quantitative tightening, and higher real yields. That restrictive response is precisely what damages gold. When traders' bets on another Fed rate increase by October reached 50% probability in March 2026, the market was explicitly pricing in monetary tightening in response to supply-side inflation — the exact environment in which gold's opportunity cost rises most sharply.
Three Simultaneous Forces Drove GLD Lower: Trading Programs, Margin Calls, and $70 Billion in Leveraged ETF Unwinds
The mechanics of gold's March decline were not sentiment-driven — they were structurally mechanical, which is important because it means the decline was temporary by definition. Three distinct forced-selling mechanisms operated simultaneously. First: institutional trading programs. When a major macro shock hits — in this case the Iran war's equity market selloff and crude oil surge — institutional fund managers execute mechanically forced liquidations to raise cash and reduce gross exposure. The standard playbook is to sell the assets with the greatest unrealized appreciation first, because those positions provide the most cash per dollar of book value sold. Gold, which had appreciated more than 50% over the prior year and more than 150% over five years, was the institutional cash machine of choice. This selling had nothing to do with gold's fundamental value — it was purely positional. Second: margin calls. As stock markets fell and bond prices declined simultaneously during the Iran war, leveraged institutional portfolios received margin calls from prime brokers. Under margin call conditions, managers do not sell what they want to sell — they sell what they can sell with maximum liquidity and minimum market impact. Gold, as the most liquid commodity in the world, was liquidated precisely because it was liquid and profitable, not because the fundamental thesis changed. Third: $70 billion in leveraged gold ETFs — products offering 2x and 3x daily exposure — created automated selling pressure through daily rebalancing. When gold prices fall, these leveraged ETFs must mechanically sell gold futures contracts to maintain their leverage ratios. As gold declined, the rebalancing triggered more selling, which caused further price declines, which triggered more rebalancing — a self-reinforcing cascade that amplified the move well beyond what fundamental supply-demand analysis would suggest. All three mechanisms are transitory. Trading programs complete their repositioning. Margin calls get satisfied. Leveraged ETF positions are reset. When the forced selling exhausts itself, the underlying bid — central bank accumulation, de-dollarization demand, inflation protection allocation — reasserts.
Open Interest Fell 33.2% From 541,033 to 361,409 Contracts — the Weak Hands Are Out
The most structurally significant data point in the entire gold technical picture is the 33.2% decline in COMEX gold futures open interest from 541,033 contracts on January 22 — before gold reached its latest record high — to 361,409 contracts on March 31. In a futures market, falling prices accompanied by declining open interest represents long liquidation — existing buyers exiting rather than new sellers entering. When the long liquidation process exhausts itself, the remaining open interest represents the committed holders rather than the momentum-chasing speculators who entered during the parabolic advance. The 179,624 contracts removed from open interest during March represent the speculative excess that was always going to come out on a correction — the approximately $70 billion in leveraged ETF positions, the institutional trading program exits, and the margin-call-forced liquidations. With open interest 33% lower, the remaining long positions belong to longer-duration holders who are not sellers at current prices. That cleaned-up positioning is the technical foundation for the next leg higher in GLD and gold prices. The March 23 low of $4,100 per ounce represents the level at which the last of the forced selling found buyers willing to absorb the supply — and the subsequent 15.8% rally to current levels confirms that institutional buying emerged at that price point.
Gold's 10th Consecutive Quarterly Record High — The 27-Year Bull Market Trend Remains Intact
Despite March's 11.43% single-month decline, gold closed Q1 2026 at $4,647.60 — 7.41% above the Q4 2025 closing price. This marked gold's 10th consecutive quarterly record high, extending an unbroken streak that has been running for over two years. The longer-term quarterly chart going back to 1970 shows gold's ascent from the $252.80 bottom in Q3 1999 — a price that represented gold's cyclical low after two decades of monetary restraint under Volcker and Greenspan — to the $5,626.80 peak in January 2026. That is more than 22 times the original price over 27 years, with every correction along the way ultimately proving to be a buying opportunity followed by new highs. The 2008 correction from $1,000 to $720 — a 28% decline triggered by Lehman Brothers and the global financial crisis — was followed by a 165% recovery to $1,921 by 2011. The 2020 COVID crash from $1,683 to $1,474 in 10 days was followed by a rapid recovery to new highs. The current correction from $5,626.80 to $4,100 represents a 27.2% drawdown — remarkably similar in magnitude to the 2008 correction. If the historical pattern repeats, the recovery from the March 23 low will ultimately prove far more substantial than the correction itself.
Turkey Sold 60 Tonnes of Gold Worth $8 Billion — the Energy Importer Liquidation Thesis That Changed the Demand Picture
One of the most analytically underappreciated drivers of gold's March decline is the forced selling by energy-importing nations whose current account positions have been devastated by oil at $100 to $118. The Central Bank of Turkey sold approximately 60 tonnes of gold — valued at approximately $8 billion — to obtain liquidity through currency swap arrangements as the Turkish lira came under pressure from surging energy import costs. Turkey is not alone. Among the world's largest gold reserve holders — Germany, Italy, France, Switzerland, India, Japan, and Turkey — the majority are significant energy importers whose import bills surged by hundreds of billions of dollars when oil prices doubled within five weeks. Energy-importing central banks that had been accumulating gold as a dollar-alternative reserve asset since 2022 are now liquidating those same reserves to finance energy imports they cannot avoid. This is the mechanism that decoupled gold from its traditional safe-haven behavior during the Iran war. The same geopolitical event that should have driven gold higher — a war in a major oil-producing region — simultaneously created the energy import shock that forced the most price-sensitive gold holders to sell. When the Strait of Hormuz reopens and oil prices normalize toward $80, this forced selling pressure disappears immediately. The gold that energy-importing central banks sold to finance oil imports does not disappear — it changes hands to value-accumulating buyers who purchased at $4,100 to $4,700.
China Bought 790 Tonnes of Silver in Early 2026 — Including 470 Tonnes in February Alone
While gold attracted the majority of analytical attention during March's precious metals correction, silver's on-chain accumulation data reveals something important about the medium-term precious metals demand picture. China purchased silver at the fastest pace in eight years in early 2026, with total purchases reaching over 790 tonnes in the beginning of the year. February alone saw 470 tonnes purchased — the highest level ever recorded for that month. Chinese silver demand reflects two simultaneous buyers: retail investors treating silver as the affordable alternative to gold at current elevated gold prices, and solar energy manufacturers in China front-loading silver purchases as exchange inventories decline and solar panel production costs accelerate with every additional day of energy supply disruption. The iShares Silver Trust ETF (SLV) fell 22% during the Iran war period — the largest of all precious metal declines — and the price target of $108 per share for SLV represents 71% upside from the current publication price of approximately $63. Silver's industrial demand component — primarily solar energy, electronics, and electric vehicle production — means its recovery is tied not just to gold's monetary recovery narrative but to the global clean energy capital expenditure cycle, which continues to accelerate regardless of short-term geopolitical disruptions.
Read More
-
CHAT ETF Holds Near $98 as the Generative-AI Trade Gets Stress-Tested — $1.02B in Inflows Meets the Bubble Scare
03.07.2026 · TradingNEWS ArchiveStocks
-
XRP ETFs Do Everything Right and Get Nothing for It — XRPI at $7, XRPR at $10 Await the CLARITY Catalyst
03.07.2026 · TradingNEWS ArchiveCrypto
-
Henry Hub Stuck at $3.20 as Record Supply Meets the Heat Wave — but December Above $4 Tells the Real Story
03.07.2026 · TradingNEWS ArchiveCommodities
-
Dollar-Yen Holds 161 Below Its 162.5 Four-Decade High as the Carry Trade Meets Tokyo's Intervention Threat
03.07.2026 · TradingNEWS ArchiveForex
The Three-Phase Framework and Where Gold Sits Today
The analytical framework that best contextualizes the current GLD position describes three sequential phases in gold's response to major financial shocks. Phase 1 (2024 through early 2026): gold rises on monetary debasement thesis, central bank accumulation, de-dollarization, and the structural case built by $38 trillion in U.S. public debt with $1 trillion in annual interest expense. Gold more than doubled from end-2024 levels to the January 29 peak of $5,626.80. Phase 2 (present — March 2026): an external supply shock — war, oil price surge, high real yields, strong dollar, forced liquidation — causes gold to be sold as the financial system's most liquid asset to satisfy margin calls and raise cash. This is the phase we are completing. The historical precedents are precise: 2008 saw a 28% correction followed by a 165% recovery. 2020 saw a 12% COVID crash followed by a rapid new all-time high within months. 1983 saw oil-revenue-driven OPEC gold sales collapse the price before recovery. The current 27.2% correction fits squarely within the historical Phase 2 pattern. Phase 3 (approaching): the financial system absorbs the liquidity stress, the Strait of Hormuz reopens or conflict de-escalates, forced selling from energy-importing central banks ends, real yields stabilize or decline as the Fed eventually responds to labor market deterioration, and gold transitions from being the financial system's cash ATM back to being the primary beneficiary of the monetary debasement thesis that drove its 27-year bull market. The Phase 3 trigger is explicit: the reopening of the Strait of Hormuz or credible evidence of U.S.-Iran de-escalation. Trump's statement that U.S. forces will leave Iran in two to three weeks is the precise catalyst that initiates Phase 3.
GLD at $437.82 vs. IAU at $88.16 vs. BAR at $46.13 — Which Physical Gold ETF Is Right for Different Profiles
The three primary physical gold ETFs offer meaningfully different cost and liquidity profiles that matter for different holding periods and portfolio sizes. GLD at $437.82 carries a 0.40% annual management fee and $155.11 billion in AUM with average daily volume of 14.95 million shares — the most liquid gold ETF available and the institutional standard for large-block trading. Seeking Alpha's Quant rating for GLD is Buy at 4.42 with A+ grades in both momentum and liquidity. The 0.40% expense ratio receives a B- grade — the highest cost among the three options. IAU at $88.16 carries a 0.25% management fee — 37.5% cheaper than GLD — with $70.52 billion in AUM and 15.9 million shares in average daily volume, actually surpassing GLD in daily trading liquidity. IAU's expense ratio receives a B+ grade. IAU is the preferred instrument for most retail and institutional holders who prioritize cost efficiency without sacrificing liquidity. BAR at $46.13 carries the lowest expense ratio of the three at 0.17% — less than half of GLD's cost — with $1.59 billion in AUM and approximately 522,000 shares in average daily volume. BAR's lower AUM and volume receive an A- in liquidity versus GLD and IAU's A+ ratings, making it less suitable for large institutional positions but excellent for buy-and-hold retail allocations where the 57.5% annual cost savings relative to GLD compound significantly over a multi-year holding period. All three ETFs hold 100% of their AUM in physical gold bullion, providing identical exposure with the only meaningful differentiation being cost and liquidity.
Real Yields, the 18-Year Duration Analogy, and Why 4.336% 10-Year Yields Are the Primary Technical Headwind
Gold's sensitivity to real interest rates is the mathematical framework that most accurately explains both the decline and the recovery conditions. PIMCO's research estimated gold's effective "real duration" at approximately 18 years — meaning a 100-basis-point increase in real yields produces approximately the same price impact on gold as a 100-basis-point rate increase would produce on an 18-year bond. At current 10-year Treasury yields of 4.336% and with inflation expectations embedded in TIPS, real yields are running at their highest levels in over a decade. When real yields are elevated, the opportunity cost of holding gold — which pays no coupon and generates no income — rises sharply. Capital that might otherwise allocate to GLD sits in 4.336% Treasuries instead. The reversal trigger for this headwind is Friday's nonfarm payrolls report. If the March payroll number confirms the February -92,000 deterioration with another weak print, Federal Reserve rate cut expectations for June or July rebuild rapidly. Each 25-basis-point reduction in expected short rates reduces the opportunity cost of holding gold by an equivalent amount and removes one layer of the real yield headwind. At 3.50% to 3.75% Fed funds with a potential path to 3.00%, the real yield pressure on gold eases materially, and the Phase 3 recovery accelerates.
The Verdict on GLD at $437.82: Buy With a $6,000 XAU/USD Target and IAU as the Cost-Efficient Vehicle
GLD at $437.82 is a buy — specifically, a buy on any pullback toward the $420 to $410 range that corresponds to gold testing the $4,200 to $4,300 support zone around the 200-day EMA. The $4,100 March 23 low is the definitive stop-loss: a daily close below $4,100 challenges the Phase 3 recovery thesis and opens the door to a test of $3,800 — Goldman Sachs' bear-case scenario. Above $4,800 — the 50-day moving average — the path to $5,000 opens and the Phase 3 recovery is confirmed. The upside targets from institutional analysts: Goldman Sachs at $5,400, UBS at $5,600, JPMorgan and Wells Fargo at $6,300, with the gold price target from Multiplo Invest at $6,000. At $6,000 gold, GLD trades at approximately $600 per share — a 37% gain from current levels. The Phase 3 catalyst is Trump's Iran exit materializing, the Strait reopening, energy-importing central bank selling stopping, and real yields declining as the Fed eventually responds to labor market deterioration. All four conditions are moving in the right direction as of April 1. For cost efficiency, IAU at 0.25% expense ratio is the preferred instrument over GLD at 0.40% for most holding horizons. For smallest cost, BAR at 0.17% is ideal for retail buy-and-hold. For institutional liquidity and options market depth, GLD remains the standard.


