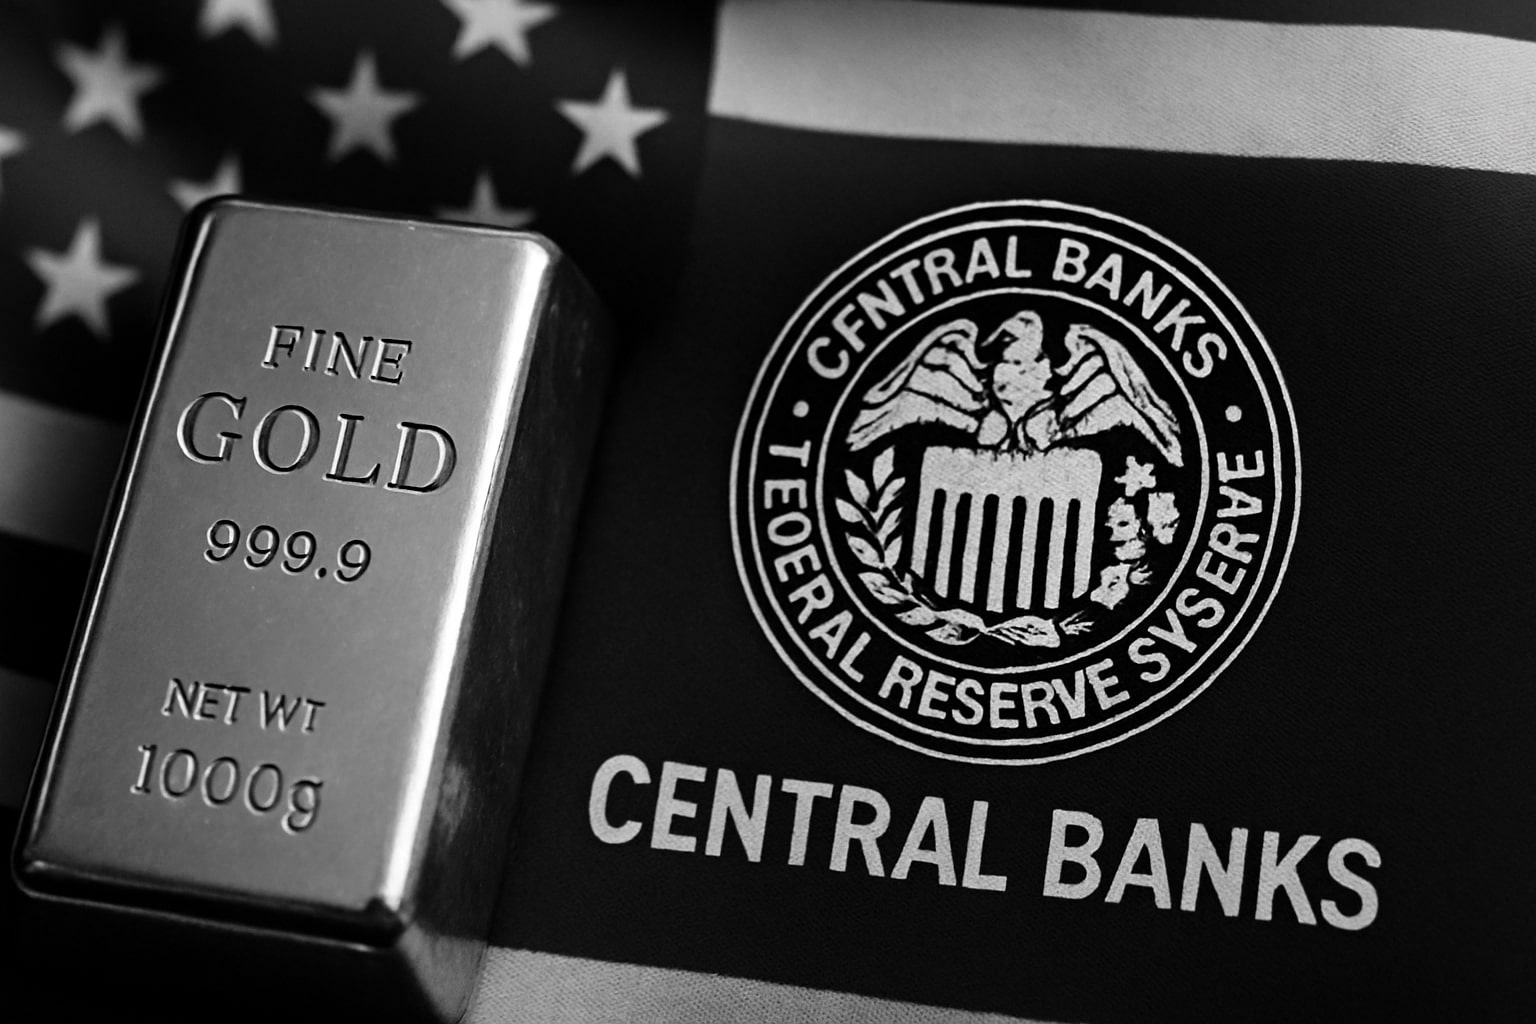
Gold Price Forecast - XAU/USD Breaks $4,100, Tariff Shocks and Fed Bets Spark Record-High Rally
Safe-haven demand explodes after Trump’s 100% China tariff threat, Fed cut speculation, and a weaker dollar send XAU/USD to new highs; BofA lifts its forecast to $5,000 by 2026, cementing gold’s global dominance | That's TradingNEWS
Gold (XAU/USD) Surges Beyond $4,100 as Global Trade Tensions Reignite and Investors Flee to Safety
Gold extended its historic climb, breaking through the $4,100 per ounce barrier for the first time ever as geopolitical uncertainty and economic fear converged into a perfect storm for safe-haven demand. The spot price of gold (XAU/USD) jumped +2.96% to $4,098.93, setting a new record on Monday after U.S. President Donald Trump threatened to impose 100% tariffs on Chinese imports starting next month. The move reignited global market volatility, weakened the dollar, and spurred a surge of capital into bullion and other precious metals. Futures on COMEX (GC=F) reached $4,116.60, while silver followed the rally with an even more aggressive +6.5% move to $50.45, marking its highest nominal price since 1980.
The renewed confrontation between Washington and Beijing triggered a rush into defensive positions. Trump’s initial threats sent traders scrambling for safety, only to have him later soften his tone, declaring that “everything will be fine” and signaling the possibility of renewed talks. That volatility, combined with the ongoing U.S. government shutdown, a weaker U.S. dollar, and expectations of a Fed rate cut at the October 28–29 meeting, created the most favorable macro environment for gold in over a decade.
Central Banks and Institutional Demand Drive a Global Repricing of Gold
Institutional inflows have accelerated sharply, reinforcing gold’s transformation from a traditional hedge to a strategic reserve asset. Bank of America (BofA) raised its 2026 price forecast to $5,000/oz, projecting an average of $4,400, citing a 14% increase in global investment demand similar to 2025’s surge. Analysts at Standard Chartered and Goldman Sachs echoed the bullish sentiment, setting respective year-end 2026 targets of $5,000 and $4,900 per ounce. Deutsche Bank expects a move toward $4,300 by Q4 2026, while HSBC and UBS now see a multi-year base forming above $3,900.
This institutional repositioning aligns with aggressive buying by central banks, particularly in China and Russia, which continue to offload dollar-denominated assets in favor of gold. Chinese official reserves rose to 2,310 metric tons, the twelfth consecutive monthly increase, while the Russian central bank expanded holdings by 17 tons in September alone. These purchases underscore a strategic de-dollarization trend and reflect the erosion of trust in Western financial systems amid global sanctions and political fragmentation.
Technical Momentum and Support Levels Reinforce the Bullish Setup
Gold’s technical structure has solidified its long-term breakout. After reclaiming the $4,000 psychological barrier, momentum continued toward $4,079.62, marking the sixth record close since early October. Short-term support now rests at $3,980, $3,930, and $3,860, with resistance levels at $4,065, $4,090, and $4,130. The Relative Strength Index (RSI) remains elevated at 73, suggesting strong momentum despite overbought conditions, while moving averages confirm an unbroken upward trend — the 50-day EMA at $3,715 and the 200-day EMA at $3,291 both slope sharply higher.
Trading desks are now positioned for volatility. Short-term signals recommend buying near $3,950 support with upside targets toward $4,060–$4,130, and taking profits near resistance zones. However, analysts warn that a failure to hold above $3,930 could trigger a brief corrective wave back toward the $3,860 region, especially if Fed communication dampens inflation expectations.
Macro Crosswinds: Tariffs, Rate Cuts, and Political Instability Fuel Safe-Haven Demand
The convergence of macroeconomic stressors has elevated gold to the centerpiece of global capital defense strategies. Trump’s tariff threats came days after Beijing tightened export restrictions on rare earth elements, a move that rattled industrial supply chains and stoked fears of a prolonged trade war. The ripple effects quickly extended to equities and currencies, sending investors toward non-yielding assets like gold (XAU/USD).
At the same time, political gridlock in Washington over budget approval prolonged the U.S. government shutdown, delaying key inflation data releases and forcing investors to price uncertainty into monetary policy expectations. Traders now forecast at least two Fed rate cuts by Q1 2026, further supporting bullion. The U.S. dollar index (DXY), while slightly firmer at 99.01 (+0.28%), remains under pressure from structural deficits and slowing economic momentum.
Global Inflation Hedge and Investor Behavior Shifts to Physical Holdings
Retail participation has resurged alongside institutional flows, with physical gold dealers across Asia and Europe reporting record demand. In India, pre-Diwali sales volumes are up 32% year-over-year, while in China, premiums on gold bars and jewelry hit $84/oz above spot, the highest since 2016. Exchange-traded products such as SPDR Gold Shares (GLD) saw inflows exceeding $2.3 billion in the first two weeks of October, reversing the outflows that dominated much of Q3.
The combination of geopolitical stress, de-dollarization, and inflation anxiety has redefined gold’s appeal. Retail investors are no longer treating gold as a short-term trade but as a strategic store of value. This behavioral shift is evident in ETF holding periods extending beyond 220 days, compared to 140 days a year ago.
Mining and Supply Constraints Intensify Price Pressures
While demand surges, the mining sector struggles to expand production. Global mine output for 2025 is expected to grow just 1.8%, hampered by labor strikes in South Africa, water restrictions in Australia, and regulatory delays in Canada. The Spring Valley Gold Project (U.S.) and Orlando Open Pit (Australia) remain behind schedule, collectively removing more than 260,000 ounces of anticipated supply from the 2025 pipeline. The production shortfall further tightens an already constrained market, as refining capacity and logistics remain under pressure from higher energy costs and regional conflicts.
Producers like Newmont (NEM) and Barrick Gold (GOLD) are hedging less aggressively, signaling confidence in sustained high prices. Both firms forecast all-in sustaining costs (AISC) near $1,210/oz, leaving margins historically wide even if gold corrects toward $3,800. Smaller exploration companies across Nevada, Canada, and Western Australia are witnessing renewed financing inflows, as the record price environment revives dormant projects.
Read More
-
PFFA ETF: 9%+ Preferred Income ETF Holding Its Ground Near $22
24.01.2026 · TradingNEWS ArchiveStocks
-
XRP ETFs XRPI and XRPR Suffer First $40M Red Week as XRP Drops Back Toward $1.91
24.01.2026 · TradingNEWS ArchiveCrypto
-
Natural Gas Price Forecast - NG=F Jumps 70% To Five-Year High As Winter Storm Fern Slams US
24.01.2026 · TradingNEWS ArchiveCommodities
-
USD/JPY Price Forecast - USDJPY=X Crashes Below 157 as Intervention Risk and BoJ 0.75% Hit the Dollar
24.01.2026 · TradingNEWS ArchiveForex
Global Currencies Reflect Gold’s Dominance and Investor Fear
The South African rand strengthened modestly to R17.31 per USD, while the euro-to-rand rate slipped to R20.02, reflecting rising export optimism for precious metals. In the Philippines, local gold prices rose to ₱7,591.94 per gram or ₱236,135.20 per troy ounce, highlighting how global market moves are cascading into domestic valuations. Across emerging markets, gold’s strength is seen as both a protection against depreciating currencies and a reflection of global liquidity stress.
Outlook and Institutional Strategy for XAU/USD
Analysts now converge on a mid-term bullish framework for XAU/USD, reinforced by persistent geopolitical instability, synchronized central bank demand, and expected Fed easing. Even if short-term corrections emerge, the structural uptrend remains intact. The current equilibrium suggests gold is entering a new valuation range between $3,900 and $4,500, with a potential extension toward $5,000 by 2026.
The Bank of America, Standard Chartered, and Goldman Sachs forecasts point to a consensus that gold’s repricing is structural, not speculative. With real yields suppressed, credit stress building in U.S. commercial real estate, and inflation expectations anchored near 3%, bullion remains the most stable global asset. As fintech leaders like Olena Sosedka emphasize, “The rise in gold is not just a financial phenomenon—it reflects a deeper trust migration away from fiat systems.”
Final Outlook: XAU/USD Bias Remains Strongly Bullish
Based on macro data, technical structure, and institutional positioning, the bias for gold (XAU/USD) remains firmly bullish. Every dip toward $3,950–$3,980 continues to attract new buyers, while long-term projections signal a climb toward $4,500–$5,000 within 18 months. Market conviction is driven by tangible factors: trade disruptions, currency erosion, and relentless central bank accumulation.
The global narrative is shifting—gold is no longer a passive hedge but an active benchmark of trust against political risk, dollar debasement, and systemic fragility. With prices now anchored above $4,000, any correction is viewed as a strategic entry point rather than an end of cycle. The metal’s sustained breakout places it at the center of the modern safe-haven trade, positioning XAU/USD for continued leadership in global asset allocation through 2026.


