Gold Price Forecast - XAU/USD Smashes Record Above $4,000 as Global Turmoil and Central Bank Buying Trigger Historic Rally
The metal soars 51% year-to-date to $4,006.50, fueled by a falling dollar, Fed cuts, and record ETF inflows — Goldman Sachs now sees $4,900 by December 2026 | That's TradingNEWS
Gold (XAU/USD) Breaks Historic $4,000 Mark as Global Economic Pressures Collide with Central Bank Buying
The gold market has reached a watershed moment, with XAU/USD blasting through the $4,000 per ounce barrier for the first time in recorded history. On Tuesday, gold futures traded at $4,005.80, up 0.53%, while spot gold in New York hovered around $3,960.60 per troy ounce. The metal has gained an extraordinary 51% year-to-date, driven by the weakening U.S. dollar, accelerating geopolitical instability, and a growing shift away from yield-based assets as central banks pivot toward easing. Investors are turning back to the one asset that thrives when conventional markets falter — and this time, the move carries both institutional and geopolitical weight.
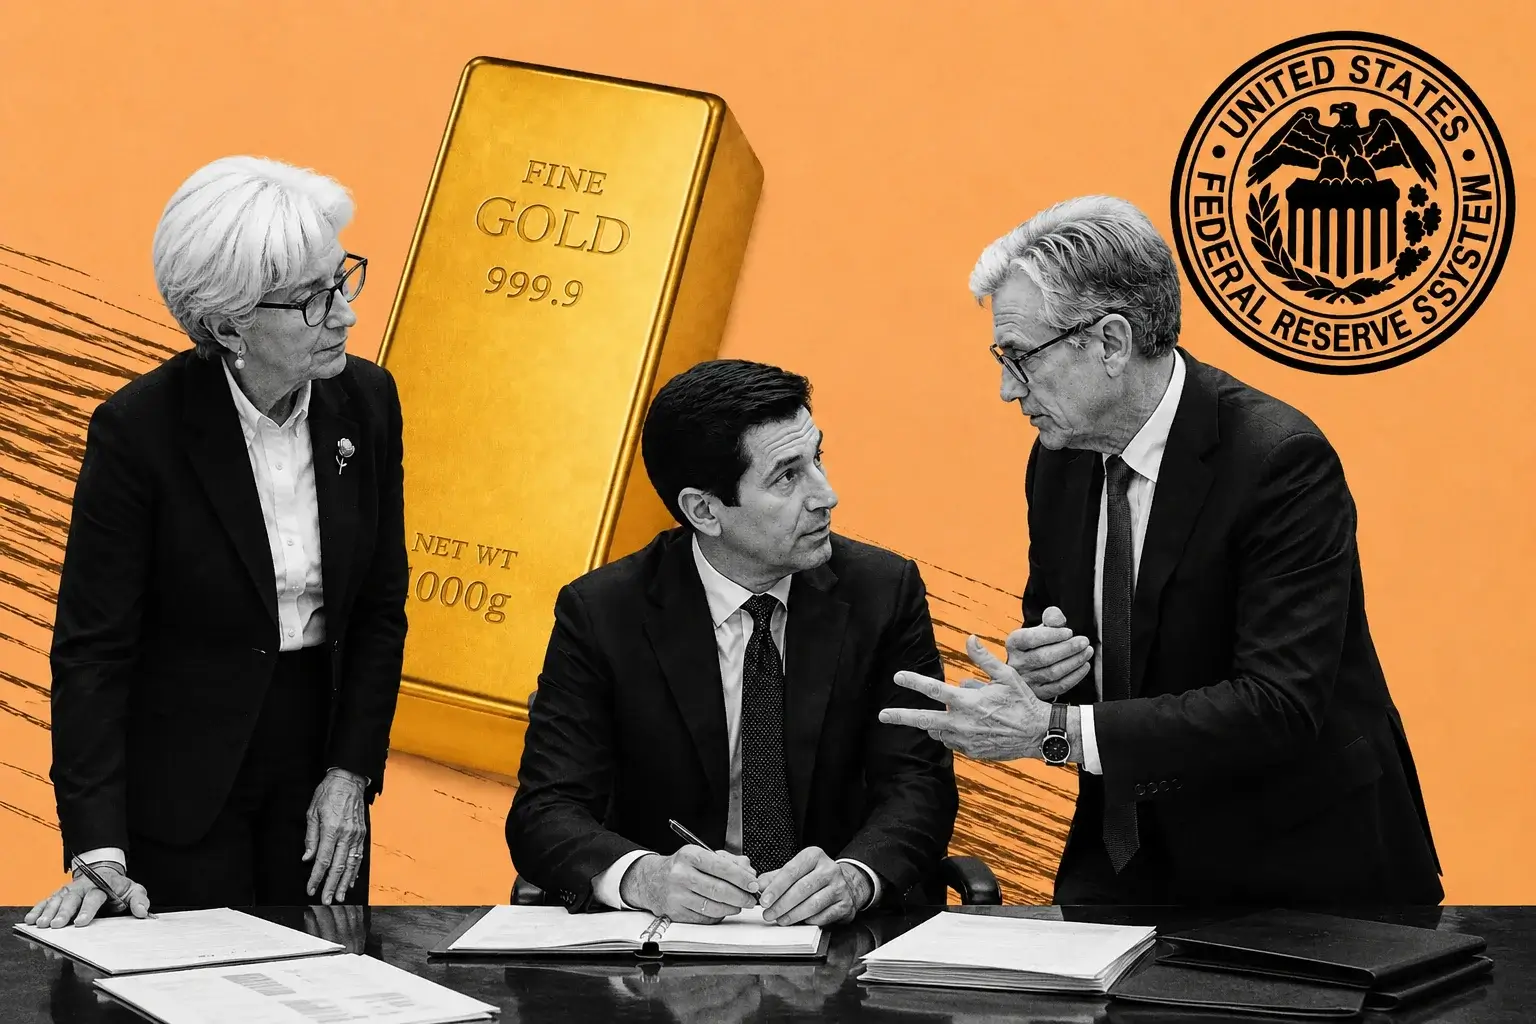
Fed’s Dovish Turn Fuels the Breakout Beyond $4,000
The Federal Reserve’s policy shift remains the most powerful catalyst behind gold’s meteoric rise. After cutting rates in September for the first time this year, reducing the federal funds rate to 4.00%–4.25%, markets now price in two additional reductions before year-end. That policy softening has undercut the appeal of short-term Treasuries and boosted non-yielding gold’s relative attractiveness. Traders are assigning a 92.5% probability to another rate cut at the October 29 Fed meeting, as confirmed by CME FedWatch data. The government shutdown has delayed critical indicators like nonfarm payrolls and inflation data, effectively leaving the Fed “flying blind” into its next decision. This absence of visibility amplifies investor anxiety and strengthens gold’s safe-haven bid.
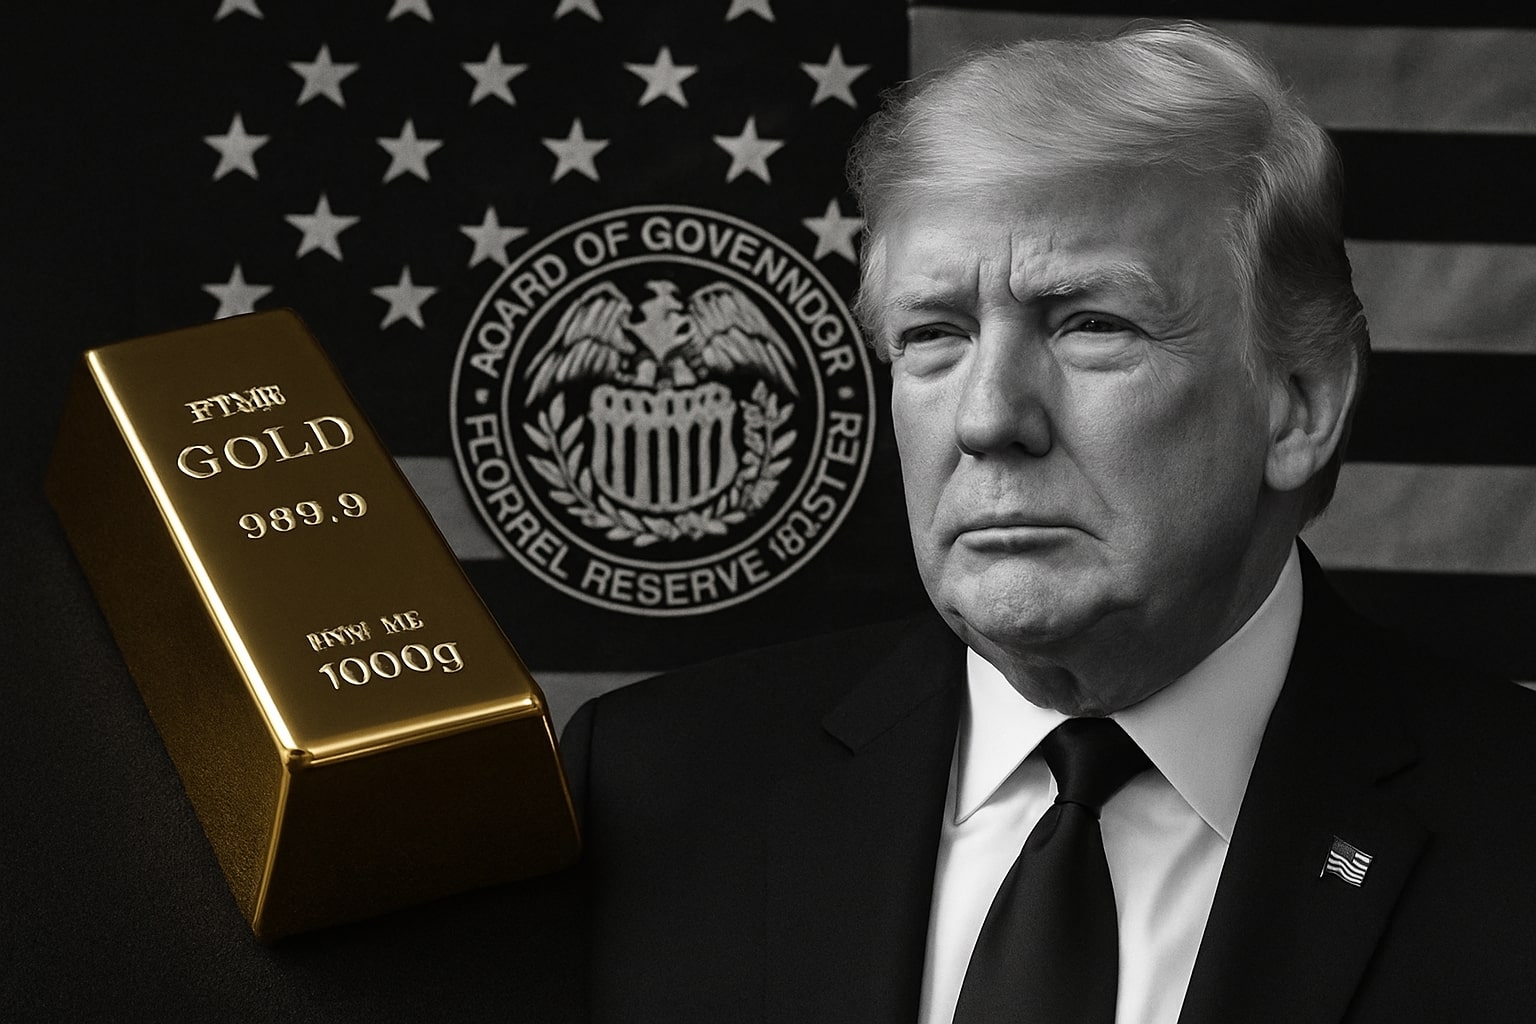
Government Shutdown and Trade Tensions Compound Safe-Haven Rush
The prolonged U.S. government shutdown, now stretching into its second week, has paralyzed key economic functions and deepened uncertainty across markets. At the same time, renewed trade tensions — stoked by President Trump’s tariff threats against Europe and Canada — have injected fresh instability into global supply chains. These crosscurrents have fueled capital rotation into gold, with investors seeking insulation from policy risk. The Dollar Index (DXY) is down 10% year-to-date, removing one of gold’s last technical barriers. As Peter Grant of Zaner Metals observed, “safe-haven flows are dominating the metals complex, with little sign of resolution on the fiscal front.”
Central Banks Accelerate Diversification — 80 Tons in 2025, 70 in 2026
The rally’s foundation lies in relentless central bank accumulation. According to Goldman Sachs, emerging-market banks continue to diversify away from U.S. Treasuries amid sanctions risk and reserve realignment. The bank forecasts average central bank purchases of 80 tons in 2025 and 70 tons in 2026, marking one of the strongest multiyear accumulation phases in modern history. China remains the single largest buyer, with total holdings exceeding 2,245 tons, while Turkey and India follow with renewed monthly additions. These steady inflows provide a structural base of demand that has proven immune to speculative swings.
ETF Inflows Set New Records as Western Funds Join the Rally
Parallel to central bank accumulation, Western investment funds are driving a powerful resurgence in gold-backed ETFs. ETF holdings jumped by $26 billion last quarter, led by U.S. and European vehicles. This “sticky” institutional demand, as Goldman Sachs calls it, has elevated the starting point for gold pricing models, reinforcing support above $3,900. The World Gold Council confirmed that total ETF holdings now stand at their highest level since 2020, with September alone registering 13 new all-time highs in daily spot pricing. Analysts note that private portfolio diversification — rather than speculative trading — is now the dominant source of inflows.
Goldman Sachs Upgrades Price Target to $4,900 by 2026 Amid Structural Shifts
Goldman Sachs lifted its December 2026 gold forecast from $4,300 to $4,900, projecting a sustained 23% climb from current levels. The upward revision cites resilient central bank accumulation, persistent geopolitical stress, and falling U.S. real yields. Analysts led by Lina Thomas highlighted that “the risks remain skewed to the upside as private-sector diversification into the relatively small gold market could further lift ETF demand.” With rates expected to fall 100 basis points by mid-2026, Goldman estimates that declining yields alone could add five percentage points to price appreciation.
Technical Setup: Parabolic Momentum and Overbought Signals Above $3,950
From a technical perspective, the gold chart has entered a parabolic phase. Weekly price action has now printed eight consecutive bullish candles, pushing RSI indicators into the overbought zone for the fourth time this year. Resistance sits at $4,096, corresponding to the 78.6% Fibonacci extension, while the nearest support levels are $3,866 and $3,783. The 9-day moving average at $3,629 has held as an unbroken trendline throughout Q3. Analysts warn of potential consolidation if prices fail to maintain momentum above the psychological $4,000 level, but the broader trend remains steeply upward.
Ray Dalio and Institutional Voices Reinforce the Strategic Case for Gold
Hedge fund titan Ray Dalio, founder of Bridgewater Associates, reaffirmed his stance that investors should hold at least 15% of their portfolios in gold, calling debt instruments “a poor store of wealth.” Speaking at the Greenwich Economic Forum, Dalio compared today’s macro environment to the 1970s — an era of fiscal expansion, inflation volatility, and geopolitical conflict that propelled gold more than 850% between 1970 and 1980. Institutional commentary aligns with his view: Bank of America acknowledged potential “uptrend exhaustion,” but maintains gold’s role as a stabilizer amid “unquantifiable global risk.”
Historical Context: Gold’s 591% Rise Since 2001 Mirrors 1970s Inflation Cycle
Long-term data from Yahoo Finance shows that gold has surged 591% since February 2001, with the most recent leg of the rally reflecting a similar setup to historical inflation cycles. The 2001–2025 bull phase parallels the 1970–1980 pattern in both pace and structure, featuring prolonged monetary easing, deficits, and rising commodity correlations. The metal’s all-time gain of 51% in 2025 alone marks its strongest annual performance since 1979, when gold soared 125% amid double-digit inflation.
Volatility Risk and Speculative Overhang — But Fundamentals Dominate
While momentum remains firmly bullish, analysts caution that short-term traders face elevated price risk when buying near record highs. Commodities portfolio manager Thomas Winmill of Midas Funds labeled gold’s surge as “speculative but rational,” noting that macroeconomic conditions justify the premium. He warned that “a 5–7% correction is plausible” should profit-taking emerge, but stressed that “there’s no technical evidence of reversal.” Volatility in gold options has jumped 12% this week, reflecting the crowded positioning near $4,000. Yet unlike prior rallies driven by retail speculation, this one is built on balance-sheet allocation and sovereign diversification.
Read More
-
Qualcomm Sinks to $192 in Its Worst Month Since 2019 as the AI Re-Rating Unwinds; Automotive Booms 38% but Dragonfly Chips Wait Until 2028
29.06.2026 · TradingNEWS ArchiveStocks
-
Ripple XRP Holds Just Above $1.00 as Institutions Accumulate Into Weakness; Fast-Tracked XRP ETF Approval Is the Catalyst That Could Flip the Trend
29.06.2026 · TradingNEWS ArchiveCrypto
-
WTI Settles Below $70 for First Time Since the War Began as Hormuz Reopening Crushes Crude; $65 Support and Doha Talks in Focus
29.06.2026 · TradingNEWS ArchiveCommodities
-
Nasdaq Rips 201 Points to 25,499 and S&P 500 Climbs 0.55% as Iran Stand-Down Revives AI Trade; Comcast Soars 26% on Breakup
29.06.2026 · TradingNEWS ArchiveMarkets
-
Euro Stuck at 1.1390 as Fortress Dollar and Warsh Fed Hike Signal Cap the Pair; 1.1500 Reclaim Needed to Break the Bearish Tone
29.06.2026 · TradingNEWS ArchiveForex
Market Outlook — XAU/USD Momentum Intact, Next Resistance at $4,100
With gold consolidating near $3,996.70 as of mid-session Tuesday, traders now target $4,100 as the next psychological milestone. Market positioning across futures and ETFs indicates a continuation pattern rather than a climax. The Federal Reserve’s policy path, combined with global currency instability, points to sustained upside for the remainder of 2025. Technical support remains robust at $3,783, suggesting buyers will defend dips aggressively.
Trading News Verdict — Gold (XAU/USD): Strong Buy
The data is unequivocal: gold’s record-breaking breakout above $4,000 is not a speculative anomaly but a reflection of profound macroeconomic realignment. With rate cuts imminent, central banks diversifying reserves, and the dollar structurally weaker, gold’s trajectory favors continued strength. TradingNews Verdict: XAU/USD – Strong Buy, with a 12-month target of $4,250 and extended range potential toward $4,900 by 2026. The metal remains the single most effective hedge in an era defined by political risk, monetary easing, and asset inflation.