Gold Price Forecast - XAU/USD Surges to $3,863 as Fed Cut Bets, Shutdown Risks, and Tariffs Ignite Historic Safe-Haven Run
XAU/USD up 12.5% in September and 45% year-on-year, breaking records as central banks accumulate, ETFs swell, and traders weigh support at $3,825–$3,835 against targets at $3,880–$3,900 amid political and economic turmoil | That's TradingNEWS
Gold (XAU/USD) Opens at $3,863 as Shutdown and Tariff Shocks Push Safe-Haven Demand
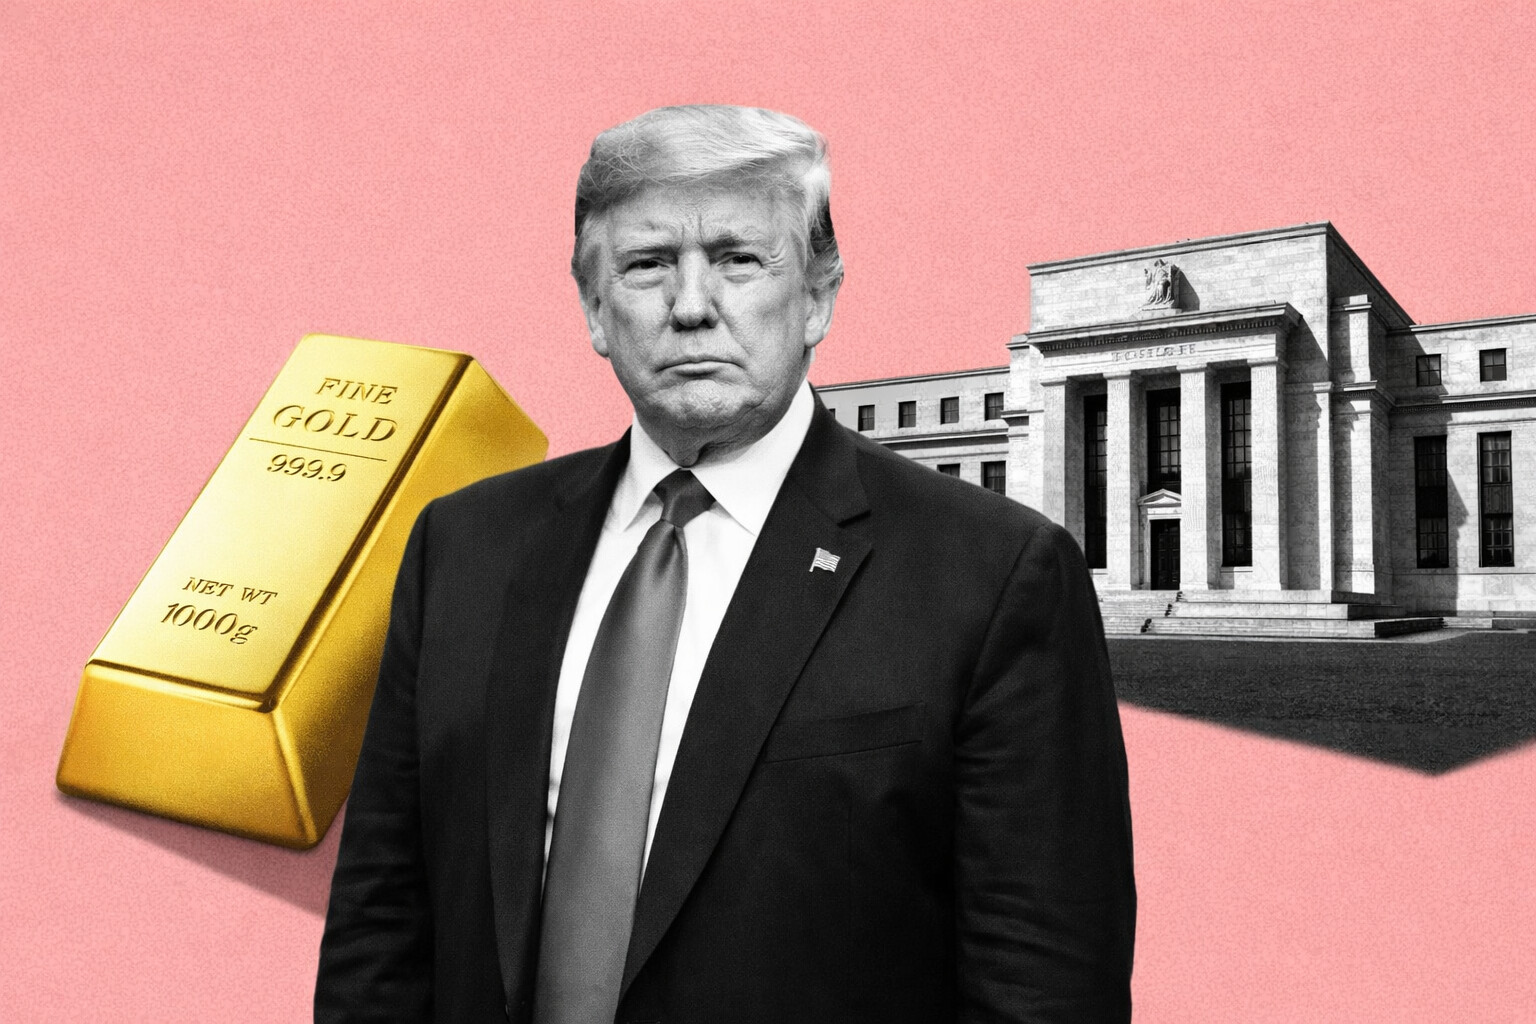
Gold surged to new heights, with XAU/USD trading at $3,881.60 (+0.68%) as of late Tuesday in New York, after hitting an intraday peak of $3,871.89. Futures opened at $3,863.10, marking the first time gold has ever opened above the $3,800 threshold. This breakout comes against a backdrop of escalating U.S. political risk, renewed tariffs on global trade, and heightened speculation around Federal Reserve rate cuts. The precious metal has climbed 12.5% in the past month and is up 45.2% year-on-year, cementing its role as the strongest-performing major asset of 2025.
Record Levels Fueled by Political Stalemate and Federal Reserve Bets
The rally coincides with Washington’s gridlock, as President Trump’s Monday meeting with congressional leaders failed to avert a government shutdown. If funding expires at 12:01 a.m. ET Wednesday, the Labor Department confirmed that nonfarm payrolls data and other economic releases will be delayed, leaving the Federal Reserve partially “data blind” ahead of its October 28–29 policy meeting. Markets are already pricing in an 89% probability of a 25 bps cut, with nearly 42 bps of easing expected by December, according to CME FedWatch. Lower real yields directly lift gold’s relative attractiveness, and the probability of extended dovish policy has underpinned demand for bullion above the $3,800 zone.
Tariff Announcements Intensify Safe-Haven Rotation
Trump’s new tariffs — covering foreign films, softwood timber, lumber, and upholstered wood products — add to last week’s levies on heavy trucks, cabinets, and furniture. The broadening scope of protectionism has rattled risk markets while reinforcing safe-haven flows. Gold’s $3,863 open was 1.1% above Monday’s close at $3,820.90, and 3.1% higher than last week’s $3,747 open. The cumulative tariff impact is difficult to quantify, but with uncertainty rising and growth data at risk of delay, bullion has become the preferred hedge against political and trade volatility.
Technical Landscape: $3,880 Breakout Meets Reversal Risk
Technically, gold has left behind a Fair Value Gap (FVG) between $3,825–$3,835, which now serves as immediate support. A clean defense of this zone would strengthen the bullish case toward $3,880 and the $3,900 psychological milestone. However, Tuesday’s sharp rejection from $3,871.89 triggered talk of a potential reversal top, raising the risk of a 2–3 day correction. Short-term pullback targets include $3,794.70 (50% retracement of the $3,717–$3,871 rally) and successive swing lows at $3,749.92 and $3,742.36. Deeper supports sit at $3,691.82 and $3,591.72, levels that coincide with broader Fibonacci retracements of the $3,311–$3,871 advance.
Central Banks and ETF Flows Cement Structural Support
Beyond speculative flows, structural buying continues to drive momentum. Central banks from China, India, and emerging markets remain net buyers, diversifying away from the U.S. dollar. ETFs have absorbed record inflows, with assets under management surging as investors chase exposure to non-yielding stores of value in an environment of falling real returns. Analysts at Goldman Sachs recently lifted their 2025 forecast to $3,700/oz, a level already surpassed, and JPMorgan now sees gold at $4,000 by March 2026, reflecting a 21% long-term upward revision in its model.
Global Perspectives: Saudi and Australian Pricing Data
Gold’s rally is resonating globally. In Saudi Arabia, prices rose to SAR 466.04 per gram and SAR 14,495.40 per troy ounce, reflecting local currency adjustments tied to the USD rally. In Australia, JPMorgan upgraded Capricorn Metals (ASX:CMM) to Overweight, raising its price target from AUD 10.50 to AUD 13.00, citing rising forward curves. The bank now expects long-term gold at $3,750, underscoring how mining equities are being repriced to capture the windfall of bullion’s strength. Evolution Mining and Newmont were also highlighted as beneficiaries, given their copper-linked diversification.
Read More
-
Sterling Infrastructure Price Forecast: From $351 Today Toward a $400 STRL Stock Target
25.01.2026 · TradingNEWS ArchiveStocks
-
XRP Price Forecast - XRP-USD Near $1.89: $1.85 Breakdown Risk Versus A $2.40–$3.00 Recovery Path
25.01.2026 · TradingNEWS ArchiveCrypto
-
Oil Price Forecast - Oil Surge on Iran Tensions, But WTI (CL=F) and Brent (BZ=F) Remain Trapped in a Supply Glut
25.01.2026 · TradingNEWS ArchiveCommodities
-
Stock Market Today: S&P 500 6,915, Nasdaq 23,501 And Dow 49,098 Face Fed, Tariffs And Tesla Test
25.01.2026 · TradingNEWS ArchiveMarkets
-
GBP/USD Price Forecast - Pound Tests 1.35 Ceiling as UK Data Beat and Fed Cut Odds Undermine the Dollar
25.01.2026 · TradingNEWS ArchiveForex
Macro Crosscurrents: Dollar Weakness and Treasury Moves
The Dollar Index slipped to 97.785 (-0.1%), reflecting haven rotation into gold and currencies such as the yen (USD/JPY down 0.4% to 148.02) and the Swiss franc (USD/CHF down 0.2% to 0.796). Treasury yields were mixed, with the 10-year at 4.143% and the 2-year at 3.619%, as bond markets positioned defensively for a shutdown. Historically, full shutdowns have provided modest support for Treasurys, but the delayed data risk now strengthens the bullion case, with investors preferring to hedge via physical and paper gold.
Year-to-Date Momentum and Market Psychology
From a broader lens, gold’s rally has been relentless. Prices have surged from $2,660.90 on September 30, 2024, to $3,863.10 today, a gain of 45.2% year-on-year. Just in September, gold rose 12.5%, one of the strongest single-month gains in over a decade. Unlike the 2009–2011 rally, which stalled after failing to set new highs for nine years, this surge has been powered by a unique alignment: central bank buying, ETF flows, aggressive Fed easing bets, and an overlay of geopolitical and trade risks. This confluence explains why each dip has been bought aggressively and why new highs have been quickly followed by extensions rather than reversals.


