Gold Struggles Below $3,347 as Fed Signals Cuts and Trump Tariffs Reignite Inflation Fears
XAU/USD stuck near $3,325 as bulls seek breakout above resistance while central bank demand and ETF flows cool | That's TradingNEWS
XAU/USD Pressured Near $3,325 as Bulls and Bears Fight Over Fed, Tariffs, and Yields
Gold’s Momentum Wanes After 68 Record Highs and a 130% Surge Since Late 2022
After climbing from $1,429/oz in November 2022 to a peak of $3,287/oz on June 30, 2025, gold (XAU/USD) logged 68 record highs in less than three years. But that parabolic momentum has now softened. The second quarter delivered a modest 5.5% gain versus a blistering 19% rally in Q1. Current price action reflects hesitation rather than conviction: gold futures (GC=F) opened at $3,322.20 on July 10, rising 0.3% from the prior close but still below the $3,400 ceiling breached in mid-June. On a weekly basis, gold is down 1.2%, and it hasn’t touched $3,400 all month.
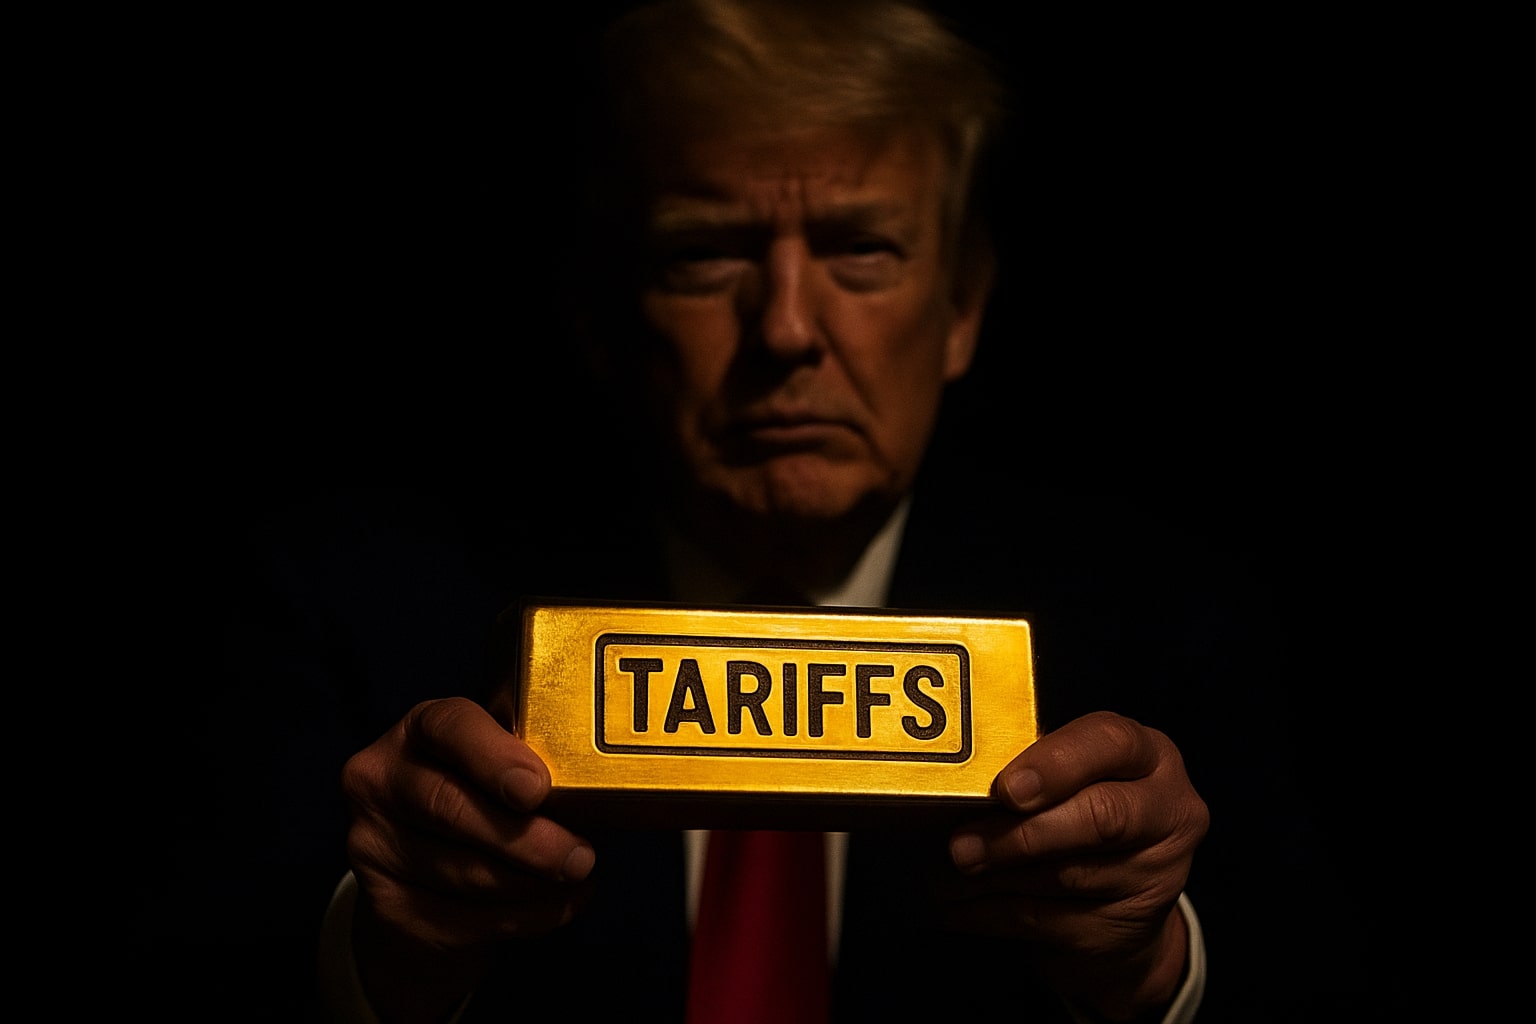
Trump’s Tariff Tsunami Creates Inflation Shock Potential
President Trump’s 50% retaliatory tariffs on Brazilian imports, including copper and energy-linked commodities, kick in August 1. Combined with new 20–40% levies on over 22 trading partners, this has the potential to reignite global supply chain pressure. While equities have largely shrugged off the move, XAU/USD may benefit from a renewed inflation hedge bid. Traders are now re-positioning for rising input costs, especially if oil and copper spike. A commodity-linked inflation shock would historically translate to a bullish environment for gold.
Fed Rate Cut Odds Climb, Pushing Real Yields Lower
Federal Reserve minutes from the June meeting revealed that most members now favor rate cuts if hiring and inflation soften. Treasury yields dropped in response, with the 10-year falling to 4.342% and the 2-year sliding to 3.853%. This drop in real yields bolsters the case for gold: lower opportunity costs for holding non-yielding assets make gold more attractive. Despite this, gold’s upside has been capped below $3,345, suggesting bulls need a firmer catalyst to reclaim June’s top of $3,452.
Technical Indicators Signal Neutral to Bearish Bias Below $3,347
The Relative Strength Index (RSI) on the 4-hour chart has crossed 50, hinting at bullish pressure. But price action remains stuck below descending trendline resistance, now sitting at $3,325. Breaking above the July 4 and 7 highs near $3,345 is required for any sustained trend reversal. Resistance clusters near $3,347.97 and $3,365.92, while support lies at $3,285 and deeper at $3,244.41. A drop below $3,282 would likely lead to profit-taking down toward the May lows at $3,205.
Gold ETF Flows and Central Bank Buying Decelerate
Gold’s multi-month rally was largely driven by relentless central bank accumulation and robust ETF demand. However, recent data points to softening flows. Gold-backed ETFs saw light outflows in early July, while central bank net purchases have slowed compared to Q1. This dampens one of the core drivers of the previous surge. A material slowdown in global central bank demand—especially from China and Russia—could signal a shift from accumulation to neutral posture, limiting further upside.
Dollar Weakness Adds Temporary Lift to Gold
The U.S. Dollar Index (DXY) fell 0.2% amid expectations of Fed easing. IMF reserve data revealed a shift in global currency reserves: the dollar's share fell to 57.7%, while allocations to the Swiss franc and euro rose. This subtle but persistent change could support gold in the short term by reducing its USD-denominated drag. Still, dollar softness alone has not been enough to lift XAU/USD above resistance, signaling sentiment remains cautious.
Historic Bear Trends Suggest Caution Amid Cooling Demand
Post-Bretton Woods, gold has seen five major bear markets, all triggered by similar catalysts: a strengthening dollar, rising real rates, or booming equities diverting capital. In those cycles, gold underperformed as investors pursued riskier returns. If geopolitical tensions ease or if yields rebound unexpectedly, gold could slip into a similar corrective phase. Furthermore, a structural reversal would require central banks to halt purchases and retail investors to shift out of gold in favor of higher-yielding instruments.
Forecast Range Tightens: Gold Awaits Catalyst for Breakout or Breakdown
Swing chart analysts are eyeing a near-term band between $3,244.41 and $3,365.92, with a pivot at $3,305.17. The 50-day MA at $3,323.50 continues to cap upside attempts. Without a major policy shock or geopolitical escalation, gold (XAU/USD) appears locked in consolidation. But a confirmed break above $3,347 could invite a fast move to $3,400, while failure to hold $3,282 risks deeper correction toward the $3,205–$3,245 band.
Verdict: Hold
Gold’s bullish engine is cooling but not broken. The technical chart shows compression awaiting catalyst. While Trump’s tariff escalation introduces upside risk, and Fed easing keeps yields suppressed, slowing ETF inflows and central bank purchases signal caution. XAU/USD is a Hold at current levels, with a bullish bias if price clears $3,347 and macro headwinds persist. Support near $3,285 must hold or downside risk expands quickly.
That's TradingNEWS
Read More
-
Broadcom Stock Price Forecast: AVGO at $325 Ahead of AI-Driven Earnings
14.02.2026 · TradingNEWS ArchiveStocks
-
XRP Price Forecast: Ripple XRP-USD Climbs Back to $1.47 but $1.80 Wall and Sub-$1 Risk Still Dominate
14.02.2026 · TradingNEWS ArchiveCrypto
-
Oil Prices Forecast - Oil Hold WTI at $63 and Brent at $68 While New Supply and IEA Surplus Weigh on the Market
14.02.2026 · TradingNEWS ArchiveCommodities
-
Stock Market Weekly Recap: S&P 500 Stalls, Nasdaq Leads the Decline, Dow Eases as AMZN, NVDA, AAPL Sell Off
14.02.2026 · TradingNEWS ArchiveMarkets
-
GBP/USD Price Forecast - Pound Stuck at 1.36 as Fed Cut Hopes Clash With UK Weakness
14.02.2026 · TradingNEWS ArchiveForex


