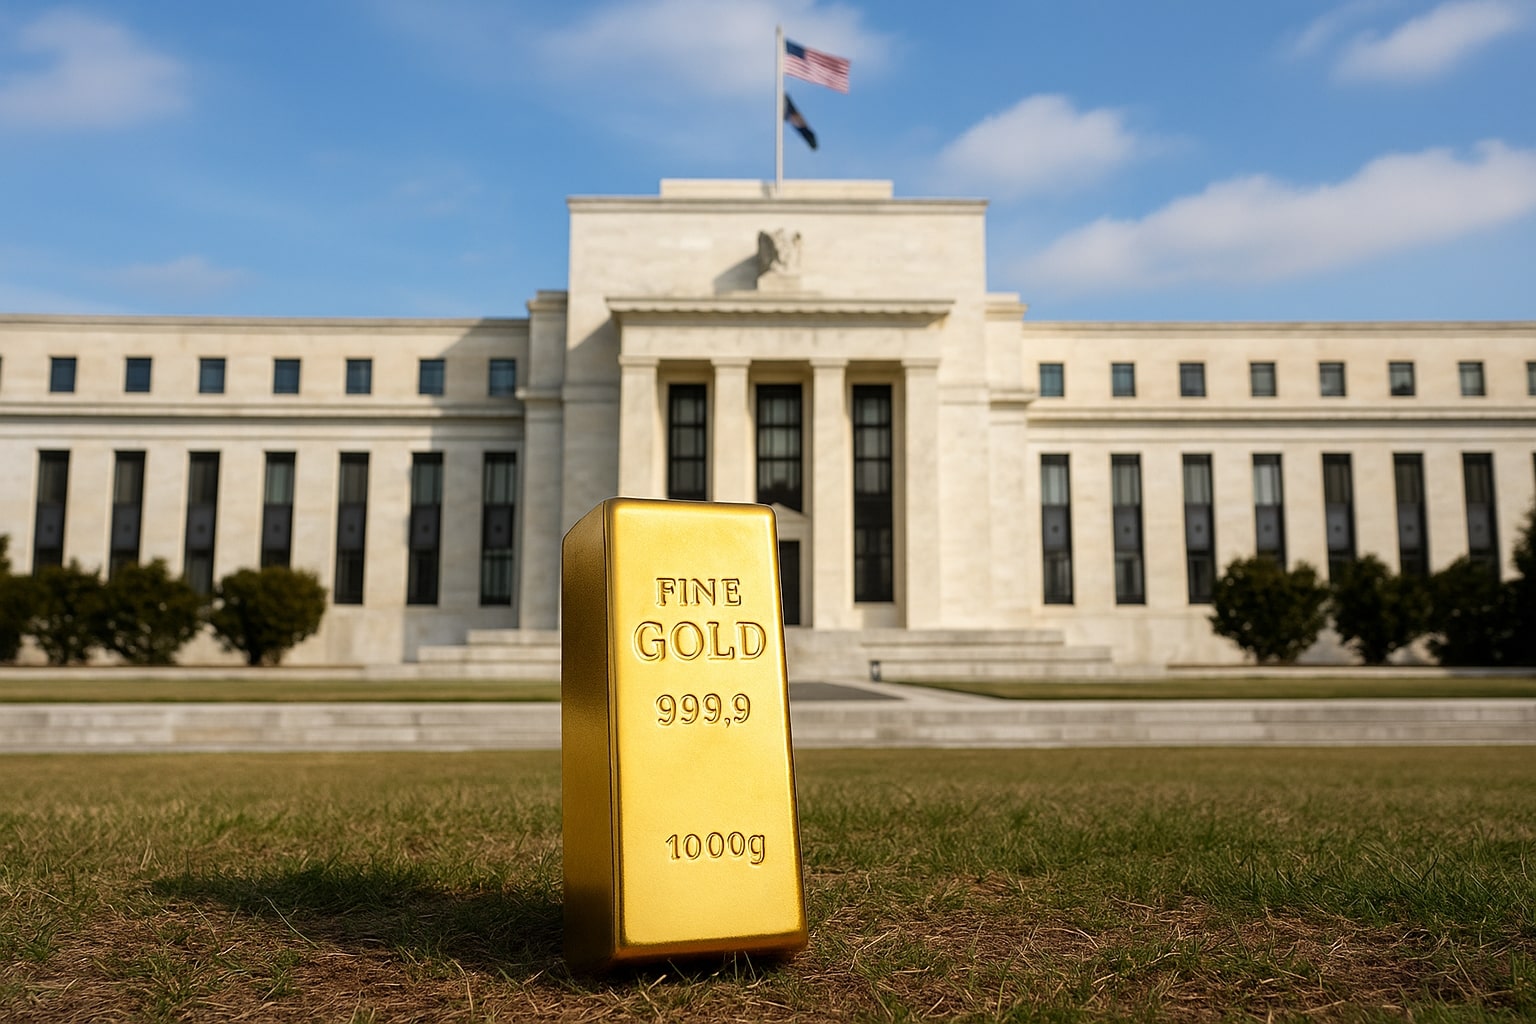
Gold (XAU/USD) Steadies at $3,334 as Trump Tariffs and Fed Uncertainty Collide
Price coils near breakout zone; triangle pattern, inflation fears, and trade war risks build tension around $3,321–$3,344 | That's TradingNEWS
Gold (XAU/USD) Stabilizes Near $3,334 Amid Escalating Tariff Tensions and Yield Pressure
Trade Shock: U.S. Tariffs Hit Asia as Gold Holds the Line
Gold (XAU/USD) hovered near $3,334 per ounce in Tuesday’s early session, with futures opening at $3,348.90, up 0.5% from Monday’s close of $3,332.20. The gains were modest but significant in context: safe-haven appetite remained constrained despite U.S. President Donald Trump’s declaration that 25–40% tariffs would be imposed on imports from 14 nations—including Japan, South Korea, Malaysia, and South Africa—starting August 1. The tariff expansion, which followed a series of letters Trump revealed Monday, added uncertainty to global trade, traditionally a bullish trigger for gold. However, broader market calm and climbing Treasury yields capped upside momentum.
Yields Compete With Bullion as Fed Minutes Loom
Gold's performance was shaped not just by tariffs but also by the rising 10-year Treasury yield, which hovered near a two-week high, increasing the opportunity cost of holding non-yielding bullion. This yield pressure played a critical role in halting XAU/USD’s upward momentum despite geopolitical risk. Investors now await the FOMC minutes from the June 17–18 meeting, due Wednesday, which could influence Fed rate path expectations. Should the tone turn hawkish, gold may face short-term headwinds.
Technical Compression: Triangle Pattern Coils Toward Breakout
The 4-hour chart for XAU/USD shows consolidation inside a symmetrical triangle, with overhead resistance at $3,344 and trendline support at $3,321. A breakout above resistance opens upside targets at $3,366 and $3,390, while a breach below support exposes $3,297 and $3,275. Key dynamic support lies at the 50-SMA around $3,323, with RSI holding at 52.18, maintaining a neutral-bullish tone. The triangle's compression phase suggests a volatility spike is imminent once macro or policy signals break the balance.
Medium-Term Structure Holds: Trendlines and EMAs Underpin Support
Daily technicals show gold trading just below the 20-day EMA at $3,334, reinforcing the current range-bound structure. Price action remains supported by the lower bound of an ascending triangle drawn from the April 7 low of $2,957, with horizontal resistance near $3,500 from the April 22 high. A drop below the May 29 low of $3,245 would open risk toward $3,200 and potentially the May 15 low of $3,121. On the flip side, a strong daily close above $3,500 targets $3,550 and $3,600, with breakout potential extending to $3,800 per ounce.
Investor Flow and ETF Activity Lag Despite Macro Noise
Despite increased trade tension, investor flows into gold remain measured. Unlike previous trade war phases, ETF inflows have not surged aggressively, suggesting a muted risk-off shift. That may reflect investor confidence in short-term equity resilience or await clarity from the Fed. Meanwhile, exchange-traded volumes remain concentrated in futures contracts, with $3,327 cited as the key spot level at 9:05 a.m. ET, up $19 from the previous day and over $963 higher year-over-year. In 2025 so far, gold has rallied nearly 27%, from an opening base of $2,633 on January 2.
Tariffs, Trade, and Volatility: China Retaliation Risks Remain a Trigger
While the market has yet to panic, China’s warning about U.S. “bullying” over tariffs raises the specter of a reciprocal move. This geopolitical friction has historically supported bullion, but the current environment has yet to fully reflect that. With U.S. equities softening—the S&P 500 fell ~30 points Monday—further escalation could flip sentiment and ignite inflows to gold. Until then, price action appears trapped between risk appetite and protective bids.
Historical Trends and Central Bank Demand Reinforce Strategic Support
Gold has gained 40.6% year-over-year, climbing from $2,364 to $3,327. That performance contrasts with historical norms, where traditional equities returned 10.7% annually compared to gold’s 7.9% since 1971. But with central banks continuing to increase bullion holdings and global inflationary risks reemerging, long-term structural demand remains intact. Goldman Sachs recently projected gold to reach $3,700 by year-end 2025, citing elevated reserve buying and growing uncertainty over U.S. monetary and trade policy.
Support Zones Intensify Near $3,245–$3,275: Key Breakdown Triggers
The 3289–3303 range, which captures the June/July open, continues to act as initial support. Below this, critical demand lies at $3,240–$3,246, the 61.8% Fibonacci extension of the June correction and the May LDC. A decisive break under $3,240 would threaten to dismantle the yearly uptrend, exposing $3,132 and the 100% extension at $3,072 as inflection targets. Bulls must defend this range to maintain any mid-cycle momentum.
Volatility Setup Nears: $3,344 Break or $3,321 Breach to Define Direction
With XAU/USD’s trading range compressing and macro catalysts aligned, a directional move appears imminent. If the Fed minutes signal dovishness and global tensions rise, expect gold to surge past $3,344, retesting $3,366 and beyond. Conversely, if Treasury yields spike post-Fed, and trade risks moderate, XAU/USD may slide below $3,321, targeting $3,297 and $3,275 in short order. Until clarity emerges, gold is a hold—but leveraged traders should prepare for breakout setups in both directions.
Verdict: Hold for Breakout, Bullish Bias Above $3,344, Breakdown Risk Below $3,240
That's TradingNEWS
Read More
-
Broadcom Stock Price Forecast: AVGO at $325 Ahead of AI-Driven Earnings
14.02.2026 · TradingNEWS ArchiveStocks
-
XRP Price Forecast: Ripple XRP-USD Climbs Back to $1.47 but $1.80 Wall and Sub-$1 Risk Still Dominate
14.02.2026 · TradingNEWS ArchiveCrypto
-
Oil Prices Forecast - Oil Hold WTI at $63 and Brent at $68 While New Supply and IEA Surplus Weigh on the Market
14.02.2026 · TradingNEWS ArchiveCommodities
-
Stock Market Weekly Recap: S&P 500 Stalls, Nasdaq Leads the Decline, Dow Eases as AMZN, NVDA, AAPL Sell Off
14.02.2026 · TradingNEWS ArchiveMarkets
-
GBP/USD Price Forecast - Pound Stuck at 1.36 as Fed Cut Hopes Clash With UK Weakness
14.02.2026 · TradingNEWS ArchiveForex


