





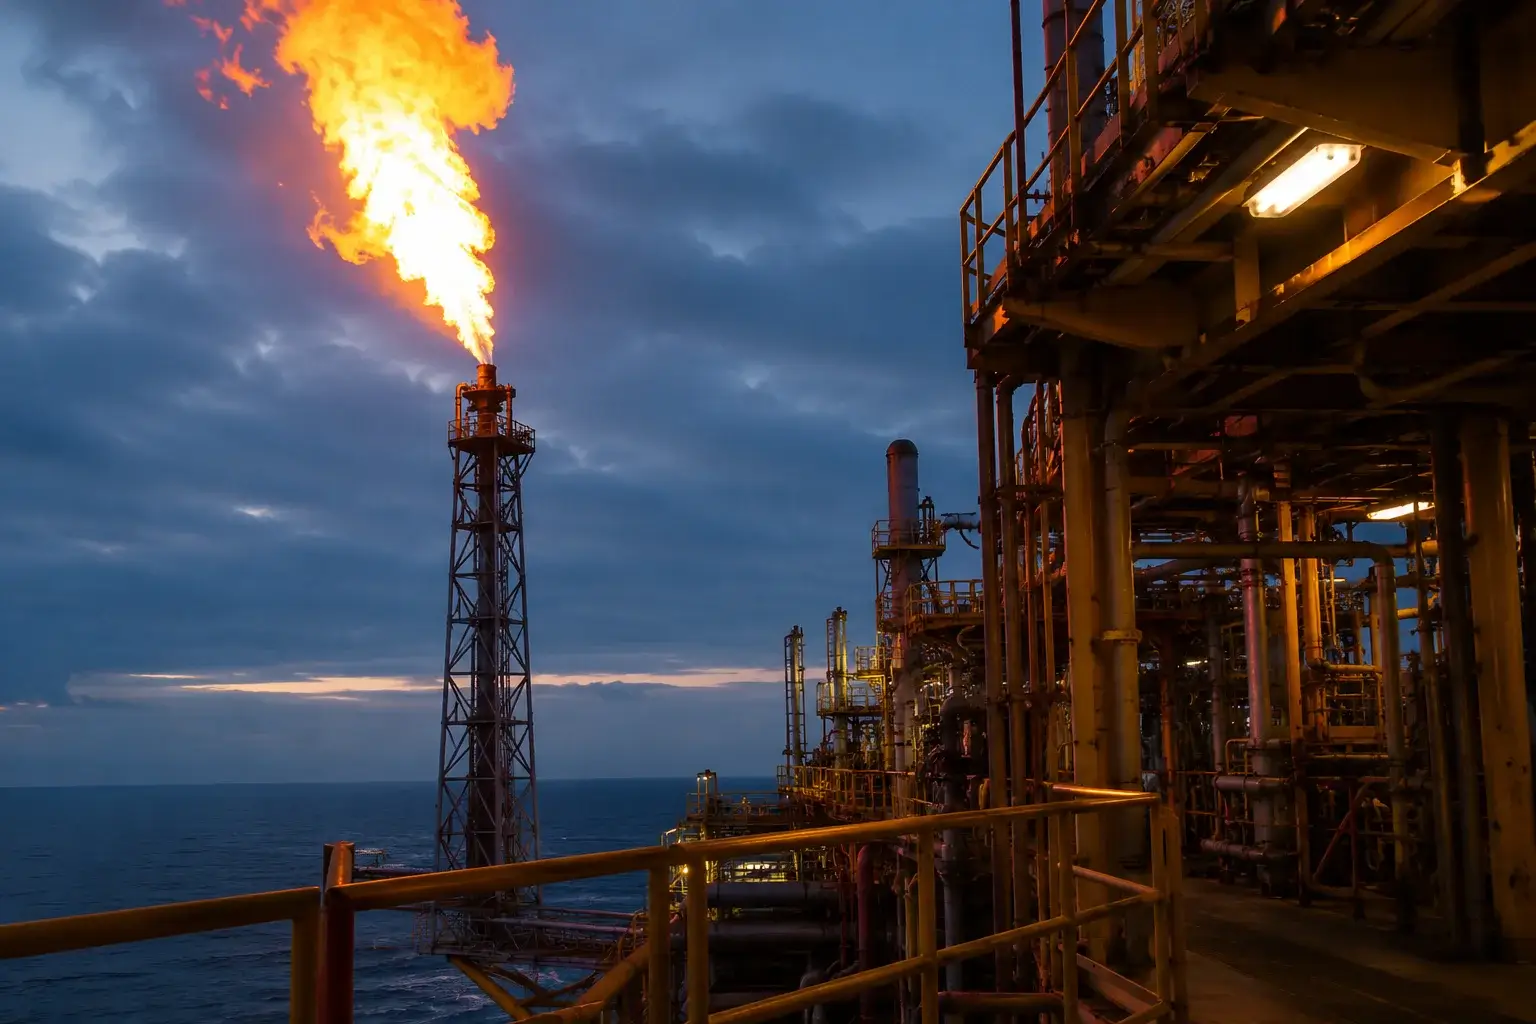
Henry Hub Slides to a 6-Week Low as Cooler Models Pull the Only Bid — Down 19.35% YOY While Heating Oil Runs 54.54% Higher
August NYMEX settled $2.94 after smashing through the April 30 bottom at $2.974, with the next reference on the chart at $2.857 from December 2021 | That's TradingNEWS
Key Points
- Natural gas trades $2.86, down 9.17% on the month and 19.35% year over year at a six-week low.
- Storage crossed 3 Tcf with inventories 185 Bcf above the five-year average and a path to 3,966 Bcf by October.
- Lower 48 production runs 110.2 Bcf/d against a 110.6 Bcf/d record as the gas rig count holds at 126.
Natural gas fell to $2.86 per MMBtu, down 2.31% from the prior session. Over the past month the contract has dropped 9.17%. It sits 19.35% below where it traded a year ago. August NYMEX futures settled $2.94 on the most recent Friday, down 7.2 cents or 2.39%, the third straight day of selling and the lowest close for a nearby contract in about six weeks. Henry Hub spot printed $2.83 on July 13.
Now hold that against the rest of the energy complex. August WTI trades $79.74. September Brent is $85.01. Both are up more than 11% this week, their best performance since late April, on a sixth consecutive night of U.S. strikes against Iran that hit five bridges in Hormozgan province, the Chabahar maritime control tower, and a railway terminal near Bandar Abbas. The blockade is reimposed. The Iranian sanctions waiver expired at 12:01 this morning. Heating oil is up 54.54% year over year. Gasoline is up 21.89%.
Natural gas is down 19.35%.
That divergence is the entire thesis and it is correct. Henry Hub is a domestic market. It does not clear against seaborne barrels, it does not transit Hormuz, and it does not care what happens in Bandar Abbas. What it cares about is production at 110.2 Bcf/d, storage above 3 trillion cubic feet, a 185 Bcf surplus to the five-year average, and a weather model that just turned cooler.
Every one of those is bearish and they arrived together.
The bulls have no argument right now. Production is running 5.2% above last year, storage sits 185 Bcf above the five-year average, and the weather models took away the one thing keeping a floor in place. That is not sentiment. That is the balance.
The one channel through which the war reaches Henry Hub is Ras Laffan, and it is a genuine medium-term floor under a market with no short-term floor. Qatar lost 17% of the world's largest LNG plant's export capacity to Iranian attacks in March, and the repair runs three to five years.
That matters in 2028. It does not matter on July 17, and $2.857 is the last support on the chart.
The 41 Bcf Print Was Bullish and the Market Sold It
Thursday's storage report was the cleanest test of this market's direction and the answer was ugly.
The EIA reported an injection of 41 Bcf into storage for the week ended July 10. The consensus expectation was 41 Bcf against last year's 46 Bcf and a five-year average of 45 Bcf. The actual result fell shy of expectations and historical norms. That is a bullish print — a smaller build than both the prior-year comparison and the seasonal norm, which underscores stronger power-sector demand amid persistent heat.
Natural gas futures retreated anyway.
That is the signature of a market that has stopped rewarding fundamentals. A 41 Bcf build is 4 Bcf tighter than the five-year average and 5 Bcf tighter than last year — call it a 10% undershoot on the seasonal norm during the peak of cooling season — and it produced nothing.
The prior week explains why nobody trusts a single print. The EIA reported a 61 Bcf net injection for the week ended July 3, a bearish surprise that outpaced expectations of 49 Bcf despite record heat across key demand markets. That build topped both the 53 Bcf increase in the same week last year and the five-year average of 51 Bcf. It followed an 87 Bcf injection the week before.
So the sequence runs 87, then 61 against a 49 expectation, then 41 against a 45 average. The builds are decelerating and the market is not paying for it, because the level is what matters and the level is comfortable.
Wednesday's session showed the indecision in miniature. The front-month contract opened $2.904, dipped to $2.865, then recovered to an intraday high of $2.937 at 1:00 p.m. before the August contract closed higher, signaling positioning ahead of the report. Then the report landed bullish and the market sold it.
The regional detail beneath the headline is worth noting. South Central salt storage posted a 1 Bcf withdrawal, and South Central nonsalt remained 5.6% below last year. Those are the pockets where a squeeze would originate. They are not enough to move a national balance carrying a 185 Bcf surplus.
Storage Crossed 3 Trillion Cubic Feet and the Surplus Is 185 Bcf
The inventory position is the reason this market cannot rally, and the numbers are not close.
Inventories stood at 2,983 Bcf as of July 3 — 15 Bcf below year-earlier levels but 185 Bcf above the five-year average, or 6.6% above the seasonal norm. Add the 41 Bcf injection for the week ended July 10 and working gas crosses 3,024 Bcf. Storage has surpassed 3 trillion cubic feet in the middle of July with a full three and a half months of injection season remaining.
That is a comfortable national inventory read by any measure, and the trajectory makes it worse. At the end of June, U.S. working natural gas inventories were 6% above the five-year average. The forecast has inventories reaching 3,966 Bcf by the end of October, 5% above the five-year average, with above-average stocks heading into winter.
Run that math. To get from 3,024 Bcf on July 10 to 3,966 Bcf by October 31 requires 942 Bcf of net injection across roughly 16 weeks — an average of 59 Bcf per week. The last three prints ran 87, 61 and 41. The market is already tracking at or above the pace required to hit a level 5% above the five-year average heading into heating season.
Inventories remain above the five-year average through much of the forecast, helping limit upward price pressures. That is the official framing and it is the correct one.
The year-over-year comparison is the only number bulls can point to, and it is thin. Storage sits 15 Bcf below where it stood a year ago — about 0.5%. That deficit has narrowed from wider levels earlier in the season and it is being erased by production rather than closed by demand.
Compare the winter picture for context. Working gas totaled 3,065 Bcf at the equivalent point in a prior withdrawal season, 177 Bcf or 6% above the five-year average and 141 Bcf or 5% above the prior year. The surplus structure is the same. The difference is that this time production is at a record.
Storage remains above average today, and strong LNG exports could quickly erase the surplus by fall. That was the argument a month ago. LNG feedgas has since fallen.
Production at 110.2 Bcf/d and Running 5.2% Above Last Year
The supply side is the structural problem and it is not going away on any timeframe that matters to this contract.
Average gas production in the Lower 48 states increased to 110.2 Bcf/d so far in July from 110.0 Bcf/d in June, potentially contributing to inventory builds amid expectations of weaker demand. Dry gas production averaged 110.4 Bcf/d for the most recent reporting week, up 1 Bcf week over week. The monthly record high is 110.6 Bcf/d, set in December 2025. Production is running 5.2% above last year.
The market is operating within 0.2 Bcf/d of an all-time production record during the peak of injection season with storage already 185 Bcf above the five-year average.
The forward guidance is worse. The EIA raised its forecast for 2026 U.S. dry natural gas production to 111.2 Bcf/d from a June estimate of 111.0 Bcf/d. That is a 0.2 Bcf/d upward revision on a number that is already at a record, and the agency delivered it in the same week the weather models turned cooler.
Record U.S. natural gas production helps meet rising demand, putting moderate downward pressure on prices. That is the official assessment and it is why inventories remain relatively high — the Permian is leading the growth, and Permian gas is associated production. It comes out of the ground because someone is drilling for oil, and WTI at $79.74 is a strong incentive to keep drilling for oil.
That is the trap in this market. The war that lifted crude 11% this week makes the natural gas supply problem worse, not better, because higher crude means more Permian activity and more associated gas that has to find a home.
Canadian imports averaged 5.64 Bcf/d, up from 5.47 Bcf/d the first week of July. Add that to 110.4 Bcf/d of domestic dry production and total available supply is running 116 Bcf/d.
Infrastructure is compounding it. Kinder Morgan's Gulf Coast Express expansion added new Permian Basin takeaway capacity, which means gas that was previously stranded behind pipeline constraints now reaches Henry Hub. That is bearish for the benchmark by construction.
The rigs are not leaving the field fast enough to tighten supply, and the production forecast is going higher rather than lower.
126 Rigs Is Not a Supply Response
The one mechanism that could fix this market is not engaging, and the rig count proves it.
Baker Hughes reported the number of active U.S. natural gas drilling rigs in the week ending July 10 held unchanged at 126. That sits moderately below the 2.5-year high of 134 rigs set in February 2026 — a decline of eight rigs, or 6.0%, across five months.
Eight rigs is not a supply response to a 19.35% year-over-year price decline. It is noise.
The arithmetic is what matters. Production is running 110.2 Bcf/d with 126 rigs working. In February, 134 rigs produced meaningfully less. That is the shale efficiency treadmill — the rig count is not a proxy for output because each rig drills faster, laterals get longer, and completions get more productive every year. Cutting eight rigs while output climbs to within 0.2 Bcf/d of a record is the definition of a supply curve that does not respond to price.
The deeper problem is who is drilling. The Permian is leading production growth, and Permian gas is a byproduct of oil drilling. A producer running rigs in West Texas because WTI is $79.74 does not shut them in because Henry Hub is $2.86. The gas comes out regardless, and it has to go somewhere. Waha, the Permian benchmark, averaged $1.811 recently — a discount that tells you exactly how desperate that gas is to find takeaway.
At 126 rigs and holding, the supply side has told the market it will not blink. Prices would need to break something — a producer's hedge book, a credit facility, a dividend — before the rig count moves enough to matter, and $2.86 is not that level for operators who hedged the strip.
The equity complex is where that pressure shows up first. Pure-play gas producers running Appalachian acreage do not have oil economics subsidizing their gas, and a sustained sub-$3 strip against a $3.70 modeled average is a margin problem they cannot drill around.
The rigs are not leaving. The EIA just told the market production is going higher.
Freeport Traps 2.4 Bcf/d Until Late August
The demand side lost a specific, quantifiable chunk of volume last week and it does not come back for six weeks.
Maintenance at the 2.4 Bcf/d Freeport LNG terminal began on July 10 and will last until late August. That is expected to trap more supply within the domestic market — gas that would have been liquefied and shipped now competes for storage space in a market already 185 Bcf above the five-year average.
Run the number. Six weeks of 2.4 Bcf/d is roughly 100 Bcf of gas that has nowhere to go except into inventories. Against a 185 Bcf surplus, that is a 54% expansion of the overhang from a single terminal outage, and it lands during the only stretch of the year when cooling demand can absorb it.
The feedgas data already shows the damage. LNG feedgas fell to 18.15 Bcf/d during the most recent reporting period from 18.99 Bcf/d — a decline of 0.84 Bcf/d, or 4.4%, week over week. That is before Freeport's full outage is reflected.
The context makes the drop starker. LNG exports were projected to average 18.5 Bcf/d earlier in the summer, not far from records north of 20 Bcf/d and more than 3 Bcf/d above year-earlier levels. Export terminals' feedgas consumption climbed through June as seasonal maintenance culminated, and the expectation was that strong LNG exports could quickly erase the storage surplus by fall.
Instead, feedgas is at 18.15 Bcf/d and falling, with Freeport down until late August.
The complications extend beyond one terminal. Bearish signals from U.S. LNG feedgas demand have continued to fluctuate as operational trips during Freeport's maintenance and swings at Golden Pass further cloud a fall in nominations. That is two of the largest export facilities on the Gulf Coast producing unpredictable demand at the exact moment the market needs the export pull to work.
Elsewhere, ample domestic supply contrasts with limited LNG flows to major European and Asian consumers as Iran and the U.S. resumed blockading tankers from leaving the Persian Gulf. That is the paradox — the world is short LNG and Henry Hub is drowning in gas, because the molecules cannot get from one to the other fast enough.
The Weather Models Took Away the Only Bid
The single event that broke this market was a forecast revision, and it deserves to be named precisely.
Forecasts turned cooler, with below-average temperatures anticipated in the Southwest through July 23, likely limiting cooling demand. That assessment landed on a Tuesday and the market has not recovered from it. Cooler weather forecasts pulled the demand bid out from under the market and there was nothing underneath it.
That last clause is the whole story. Weather is the single largest driver of short-term natural gas price moves, and in a market with record production and a 185 Bcf storage surplus, cooling demand is the only variable capable of generating a bid. Take it away and the balance is naked.
The prior week showed what the demand actually did. Cooling degree days were up 14.5% week over week according to the national weather agency. Electric power generation demand fell to an average of 50.34 Bcf/d from 51.71 Bcf/d, though there were still three consecutive days of 50-plus Bcf/d power burn. Henry Hub weekly prices fell 18.5 cents to an average of $3.130/MMBtu.
Read that carefully. Cooling degree days rose 14.5%, power burn held three days above 50 Bcf/d, and the weekly price still fell 18.5 cents. Demand delivered and price fell anyway.
The market thinks the heat wave is going to be short-lived and that temperatures cool back to normal, with production remaining strong. That combination keeps the market relatively well supplied and drives prices lower.
The electricity data is the one genuine bullish input. Lower-48 electricity output in the week ended July 4 rose 7.73% year over year to 100,996 gigawatt hours. That is real, measurable demand growth in the sector that consumes the most gas.
It has not helped. The mid-summer heat wave of 2026 served as a case study in regional market insulation — East Coast markets experienced dramatic moves while the national balance absorbed them without a ripple. New York basis values held steady for the current summer strip while New England basis values increased, reflecting localized demand strength and infrastructure constraints heading into winter procurement.
Regional heat produces regional basis. It does not produce a Henry Hub rally when the hub itself is oversupplied.
Read More
-
Yen Stalls at 160 Despite a 3% JGB and Tokyo Core CPI at 2.0% — Intervention Sits at 164, Friday's Payrolls Decide
02.09.2026 · TradingNEWS ArchiveEnergy
-
QQQ ETF ($706.22) Slides 7.4% Below Its High as the Market Reprices the AI Capex Bill — $686.57 Target if $700 Breaks
22.10.2026 · TradingNEWS ArchiveStocks
-
XRPI ($7.00) and XRPR ($10.74) Slide Toward 52-Week Lows as Spot XRP ETF Flows Stall at $708,510
22.10.2026 · TradingNEWS ArchiveCrypto
-
NG ($2.775) Decoupled From Europe’s €88 Gas Crisis as LNG Feedgas Hits 18.9 Bcf/d — $3.30 Upside on Cold Weather
22.10.2026 · TradingNEWS ArchiveCommodities
-
Dollar-Yen (157.35) Loses 157.65 as the Yen Rallies on Haven Demand — 155 Target if 156 Breaks
22.10.2026 · TradingNEWS ArchiveForex
Solar and Wind Are Eating the Power Burn
The structural demand erosion nobody is pricing showed up in the July data and it is not seasonal.
Solar and wind power generation stateside rose to near record highs in July, taking market share from gas-powered power plants. That happened in the same month electricity output rose 7.73% year over year — meaning total demand for electrons grew and gas's share of supplying them shrank.
That is the worst configuration available for this contract. Rising electricity demand should be the structural bull case for natural gas. The official forecast has consumption in the electric power sector increasing 2% in 2026 and another 4% in 2027 to 38.1 Bcf/d, reaching a record. Summer consumption is forecast to average 42.2 Bcf/d, 0.5 Bcf/d more than the same period in 2025. Data reported by generators show 508 gigawatts of gas-fired generating capacity by the end of 2027, up 3% from 2025.
And renewable generation growth, particularly from solar, supplies much of the year-over-year increase in total U.S. output.
Read those together. Gas-fired capacity grows 3%. Gas consumption in power grows 0.5 Bcf/d this summer — 1.2%. Total electricity output grows 7.73%. Solar and wind take the difference.
The generation stack is the mechanism and it is not reversible. Solar has near-zero marginal cost. It gets dispatched first, every time, in every hour it produces. A gas plant with a heat rate and a fuel bill sits behind it in the merit order and only runs when solar cannot cover the load. Adding 508 gigawatts of gas capacity does not add gas burn if solar keeps taking the daylight hours — it adds capacity that runs fewer hours at higher cost.
The forward numbers still look constructive on paper. Summer 2027 consumption is forecast at 46.3 Bcf/d, 2.1 Bcf/d more than summer 2026. Monthly consumption is projected to reach 50.6 Bcf/d in July 2027, the most in any month on record.
That is a 2027 story. Wholesale electricity prices are forecast to average about $45 per megawatt hour this summer — lower than last summer, primarily because of lower costs of gas delivered to power plants.
Cheaper gas producing cheaper power producing no bid for gas. That is the loop.
The Chart: $2.974 Broke and $2.857 Is All That Is Left
The technical structure is the thinnest in the energy complex and the levels are worth stating exactly.
August NYMEX natural gas settled $2.94, down 7.2 cents or 2.39%, in its third consecutive session of selling and the lowest close for a nearby contract in about six weeks. It smashed through the April 30 bottom at $2.974 and fell sharply to $2.874 before rebounding into the close at $2.940. Spot has since traded $2.86.
The April 30 bottom at $2.974 is gone. That was the reference that had held since spring, and losing it removes the last structure above the current price.
The next support is $2.857, and finding it required going back to December 2021 on the full contract chart. That is $0.003 — one-tenth of one percent — below spot at $2.86. The market is sitting directly on a level derived from a chart four and a half years old, with nothing between here and there.
Below $2.857 there is no reference at all on this contract.
The recent range gives the operating picture. The July 16 session opened $2.904, dipped to $2.865, and recovered to an intraday high of $2.937. The prior Friday traded $2.874 at the low. The August contract's first day as front-month saw it fall 8.2 cents, or 2.5%, to $3.20, and it was down 2.7% for the month at that point. The expiring July contract settled $3.147, down 3.3% or 10.6 cents.
Track that decay: $3.20 on the roll, $3.147 on the July expiry, $2.94 on Friday, $2.86 today. That is a 10.6% decline in the front month across roughly two weeks with a bullish storage print in the middle of it.
The modeled path says more of the same. The consensus operating range is $2.85 to $3.10 through July, with upside tied to sustained heat and export recovery. One forecast has July averaging $2.972 with the month ending at $2.753 — a 15.4% monthly decline — and August ending at $2.582. Another model puts the five-day at $2.51, the one-month at $2.46, and the three-month at $2.50.
The 14-day RSI reads 60.89, which is neutral. Green days run 3 of 9, or 33%. The Fear and Greed reading for the contract sits at 23 — extreme fear.
Spot is $0.003 above a level from 2021.
Ras Laffan Is the Bulls' Only Card and It Is a Real One
There is exactly one argument for owning this contract and it has nothing to do with the weather.
On March 19, Qatar reported extensive damage at the world's largest natural gas export plant at Ras Laffan Industrial City. Iranian attacks damaged 17% of the facility's LNG export capacity. The repair is expected to take three to five years. Ras Laffan accounts for roughly 20% of global liquefied natural gas supply.
Run that. Seventeen percent of a facility that supplies 20% of the world's LNG is 3.4% of global liquefaction capacity, removed, with a multi-year repair timeline attached. That is not a maintenance outage. It is a structural reduction in the world's ability to move gas, and it is permanent on any horizon a trader can position for.
The transmission to Henry Hub is direct. A reduction in Qatari capacity boosts U.S. LNG exports, because the molecules have to come from somewhere and the U.S. is the marginal supplier with the most available liquefaction. Every cargo Qatar cannot load is a cargo the Gulf Coast can, and every cargo the Gulf Coast loads is feedgas pulled off the domestic balance.
That is the one thing holding a floor under this market long-term. Nat gas prices have medium-term support on the outlook for tighter global LNG supplies.
The problem is the timeline mismatch. Ras Laffan's damage is a 2027 through 2030 story. It requires U.S. liquefaction capacity that does not exist yet to be built, permitted, and commissioned. Meanwhile Freeport is down 2.4 Bcf/d until late August, feedgas fell to 18.15 Bcf/d from 18.99, and Golden Pass is producing operational swings that cloud nominations.
The competitive picture cuts the same way. The economics for the next wave of U.S. LNG export projects could become increasingly competitive as developers face more expensive Henry Hub prices. That is the self-limiting mechanism — Ras Laffan's loss lifts U.S. export demand, which lifts Henry Hub, which makes the projects that would capture the demand less economic.
Three to five years is the repair estimate. The August contract expires in two weeks.
Hormuz Reaches Henry Hub Through One Channel
The war is not irrelevant to this market. It is just slow, and the transmission runs through a single pipe.
Qatari LNG loads at Ras Laffan and transits the Strait of Hormuz. There is no alternative route. The strait typically handles around 20% of the world's oil traffic and it has been the defining supply variable of 2026 — effectively closed since February 28, reopened under a June memorandum, and now constrained again with tanker traffic down sharply after six consecutive nights of U.S. strikes.
Ample domestic supply contrasts with limited LNG flows to major European and Asian consumers as Iran and the U.S. resumed blockading tankers from leaving the Persian Gulf. That is the war reaching global gas. It has not reached Henry Hub.
The reason is structural rather than temporary. U.S. gas is landlocked by liquefaction capacity. The Lower 48 produces 110.4 Bcf/d and can export roughly 18 to 20 Bcf/d of it — under 20% of production. Everything else clears domestically against domestic demand, which is why a chokepoint carrying a fifth of the world's seaborne energy can be constrained for five months while Henry Hub falls 19.35% year over year.
Europe and Asia are short. Henry Hub is long. The bottleneck between them is steel that takes four years to build.
That asymmetry is why this contract is the cheapest energy on the board and will stay that way until liquefaction catches up. Heating oil is up 54.54% year over year and gasoline is up 21.89% because both clear against a global barrel. Natural gas is down 19.35% because it clears against a Louisiana pipeline hub.
The one scenario that changes it fast is a Hormuz closure severe enough to pull every uncommitted U.S. cargo into a bidding war, with European buyers paying whatever it takes and Gulf Coast terminals running at absolute maximum. That would take feedgas from 18.15 Bcf/d toward the 20-plus Bcf/d record and beyond, and it would erase 185 Bcf of surplus in weeks rather than months.
It requires Freeport back online, Golden Pass stable, and a chokepoint event materially worse than six nights of strikes.
Tehran has told the Houthis to stand ready to close Bab el-Mandeb if Iranian power infrastructure is hit. That is the second chokepoint, and the president has committed to striking infrastructure next week.
The EIA Says $3.70 and the Tape Says $2.86
The forecast gap is enormous and one side of it is going to be badly wrong.
The Henry Hub spot price is projected to average close to $3.70 per MMBtu in 2026 before declining below $3.50 next year. A separate framing in the same publication puts it at close to $3.60 over 2026 and 2027 combined, roughly 10% below the inflation-adjusted 2016 through 2025 average. The first quarter of 2027 is modeled at $3.78, up 6% from the fourth quarter of 2026. For 2027 as a whole, just under $3.50, down slightly from close to $3.60 in 2025.
Spot is $2.83. Front-month is $2.86.
The gap to the 2026 modeled average is 84 cents, or 29.4%. To hit an annual average of $3.70 with seven months in the books running well below it, the back half of the year would need to average materially above $4.00. Nothing in the forward curve or the storage trajectory supports that.
The forecast was completed July 1 and released July 7. It predates the cooler weather revision, predates the Freeport outage that began July 10, predates the 41 Bcf print, and predates the break of the April 30 bottom at $2.974. It also predates the upward revision of 2026 dry production to 111.2 Bcf/d, which the same agency delivered days later.
The next update lands August 11 — the same day as the July CPI print.
The market's own forecasts sit far below. The operating range is $2.85 to $3.10 through July, with upside tied to sustained heat and export recovery. One model has July averaging $2.972 and ending at $2.753, August ending at $2.582, September at $2.555. Another puts the one-month at $2.46 and the three-month at $2.50.
That is a $1.24 spread between the official annual average and the private one-month model — a 50% disagreement about the price of the same molecule.
The resolution is storage. The forecast has inventories reaching 3,966 Bcf by end-October, 5% above the five-year average. If that path holds, the winter strip has no scarcity to price and $3.70 does not happen. If a heat event or an LNG surge pulls 300 Bcf out of the trajectory, it does.
Injections are decelerating — 87, then 61, then 41. That is the only bullish sequence on this page.
The Trade: $2.857 Floor, $3.10 Cap, and Nothing Underneath
The levels are tight and the asymmetry is bad. Natural gas trades $2.86. Support is $2.857 — three-tenths of a cent below spot, derived from a December 2021 reference and the last structure on the contract. Below it there is nothing. The April 30 bottom at $2.974 has broken and now sits 4.0% overhead as resistance. The operating range is $2.85 to $3.10 through July, putting the ceiling 8.4% up. The July settle at $3.147 and the August roll at $3.20 are the levels this contract has already failed.
The base case is a grind at the bottom of the range. Injections are decelerating — 87 Bcf, then 61, then 41 — and the last print undershot both the five-year average of 45 Bcf and last year's 46 Bcf. That is genuine tightening and the market ignored it. The 14-day RSI at 60.89 is neutral. Green days run 3 of 9.
The bear case needs nothing new. Production at 110.2 Bcf/d sits 0.2 Bcf/d from a record and 5.2% above last year, with the 2026 dry gas forecast just revised up to 111.2 Bcf/d. Storage crossed 3 Tcf with a 185 Bcf surplus and a modeled path to 3,966 Bcf by end-October. Freeport traps 2.4 Bcf/d until late August. Feedgas fell to 18.15 Bcf/d from 18.99. Below-average temperatures run through July 23. Solar and wind hit near-record output while electricity demand grew 7.73%. Break $2.857 and there is no reference until someone finds one on a chart older than the contract.
The bull case is Ras Laffan and it is real. Seventeen percent of a facility supplying 20% of global LNG, damaged in March, three to five years to repair, with Qatari cargoes transiting a strait that six nights of strikes have already thinned. That is a structural bid for U.S. export capacity that does not exist yet.
Watch $2.857 and watch feedgas. Crude ripped 11% this week on a war. This contract fell 2.31% on a weather model. That is the correct pricing of a landlocked molecule, and it stays correct until the liquefaction catches up.





