Microsoft $508 vs Apple $237: AI Cloud Expansion vs iPhone 17 Cycle — Which Stock Wins?
With Microsoft targeting $626–$700 on AI growth and Apple capped near $305 despite iPhone 17 demand, Wall Street bets on MSFT for superior upside | That's TradingNEWS
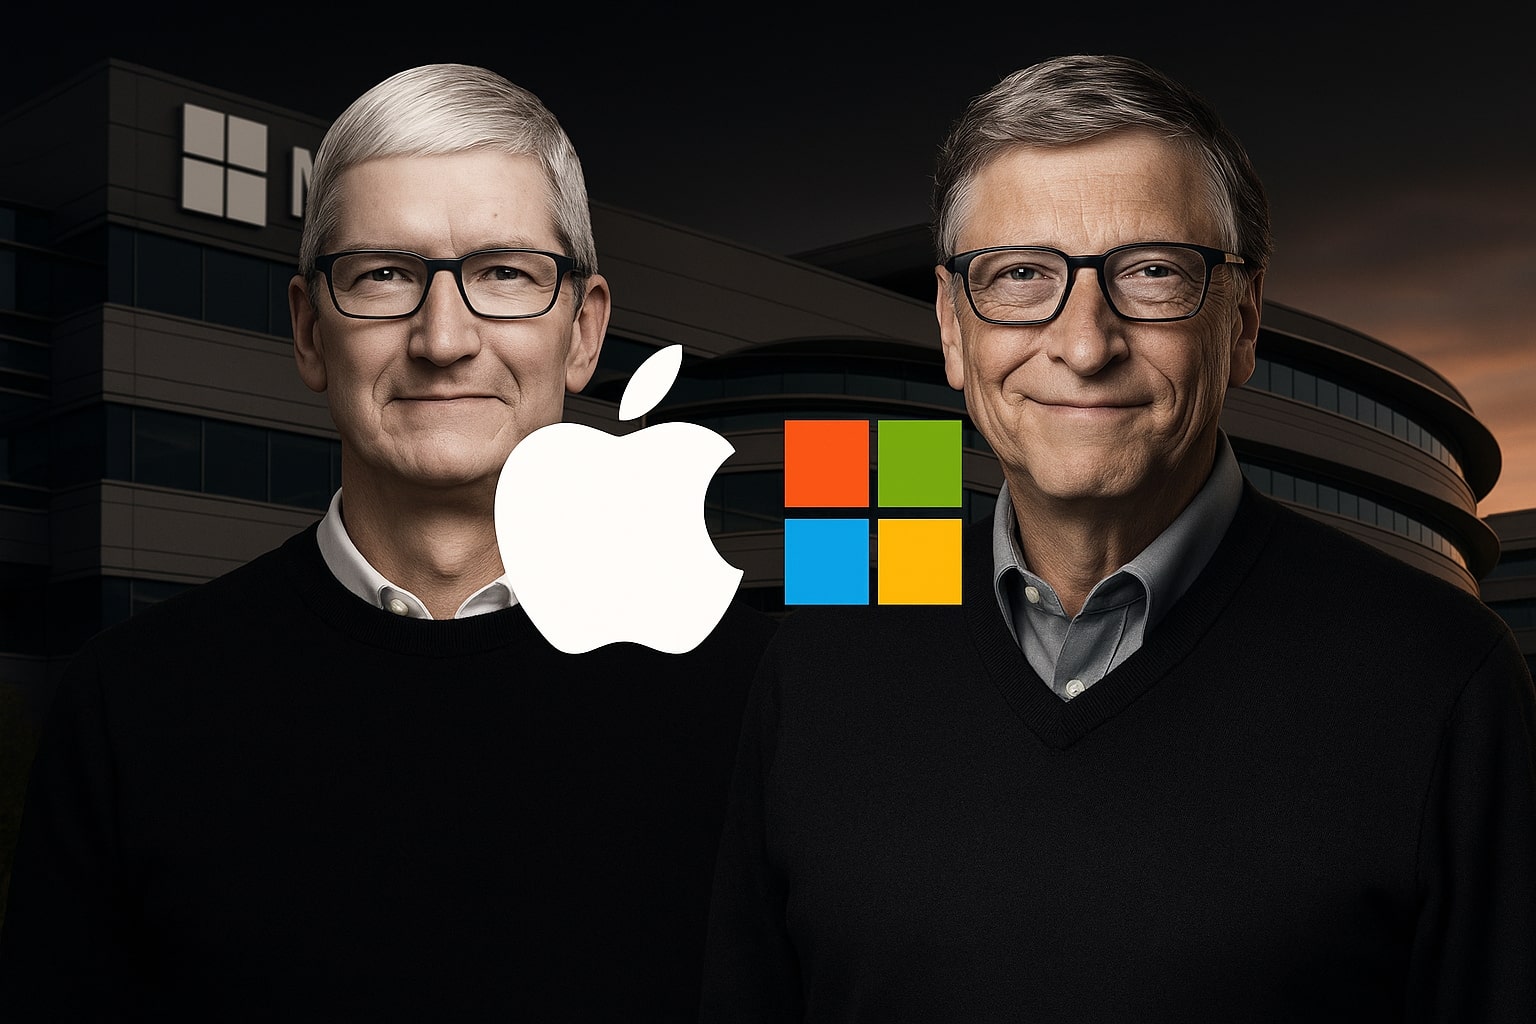
Microsoft (NASDAQ:MSFT) vs Apple (NASDAQ:AAPL): Two Trillion-Dollar Giants, Different Growth Engines
Revenue and Earnings Trajectories Diverge
Microsoft (NASDAQ:MSFT) and Apple (NASDAQ:AAPL) remain at the center of global equity markets, but their financial engines are increasingly distinct. Microsoft most recently reported $76.44 billion in revenue and earnings per share of $3.65, beating expectations by $0.30. Net income jumped 23.6% to $27 billion, sustaining gross margins of 68%. Apple posted a larger top line of $94 billion and $23.4 billion in profit, also ahead of consensus, with the iPhone 17 cycle lifting sales 25% in preorder demand above supply.
Microsoft has now delivered 15 earnings beats in its last 16 quarters, while Apple has re-established consistency after a weaker 2024 in China. Investors looking at earnings momentum will see Microsoft in a stronger position to maintain double-digit profit expansion through AI infrastructure scale, whereas Apple’s trajectory is tied more closely to consumer cycles.
AI Cloud Scale vs iPhone Hardware Supercycle
Microsoft’s Azure cloud business continues to accelerate, with 33% year-over-year growth and total Microsoft Cloud revenues reaching $42.4 billion last quarter, up 20%. Azure now carries a run-rate exceeding $168 billion annually. AI remains the differentiator: Microsoft 365 Copilot is in use at 70% of Fortune 500 firms, GitHub Copilot adoption hit 20 million developers, and Microsoft Fabric analytics revenue grew 55% year-over-year. These ecosystem integrations reinforce Microsoft’s positioning as the most comprehensive AI platform globally.
Apple, by contrast, is leveraging its iPhone 17 launch to reignite hardware momentum. Early orders exceeded supply by 25%, providing Apple with one of its strongest product cycles since the iPhone X. At the same time, Apple Intelligence — its AI-powered iOS framework — is being rolled out across the new devices, embedding AI features directly into the hardware experience. Apple’s services segment, now over 25% of revenue, continues to provide margin stability even as hardware sales ebb and flow.
Capex Intensity vs Buyback Dominance
Microsoft is deploying $20 billion in capex every quarter, channeling capital into AI supercomputers and hyperscale data centers. Its $7.3 billion Fairwater project in Wisconsin — housing hundreds of thousands of Nvidia GB200 GPUs — is set to be the world’s most powerful AI facility. A second Wisconsin site adds $4 billion more, while global commitments include $400 million in Switzerland, $15.5 billion in the UK, and a $19.4 billion rental agreement in Amsterdam.
Apple takes a different capital approach, prioritizing shareholder returns. In the past year alone, Apple has returned more than $110 billion to investors through buybacks and dividends, supported by $100 billion in annual operating cash flow. Where Microsoft chooses reinvestment for future growth, Apple continues to shrink its float and enhance per-share earnings power.
Valuation Premiums Reflect Growth vs Stability
Microsoft trades at 37.31x trailing earnings and 33x forward P/E, placing it at a premium to many peers. Its PEG ratio of 2.23 suggests investors are willing to pay more for growth visibility in AI. Apple’s forward P/E of ~30x is slightly lower, reflecting steadier growth. Both offer modest yields — Microsoft at 0.71% and Apple at 0.54% — but with conservative payout ratios under 25%, ensuring flexibility.
The valuation difference highlights investor perception: Microsoft is treated as a high-growth AI infrastructure leader, while Apple is priced more like a mature but cash-generative hardware-and-services powerhouse.
Balance Sheet and Free Cash Flow Strength
Microsoft ended the quarter with $94.56 billion in cash and generated $136.16 billion in operating cash flow over the last twelve months. Free cash flow was $61.07 billion, enough to fund capex and dividends simultaneously. Debt remains manageable at $112.18 billion, with a 32.66% debt-to-equity ratio.
Apple has historically held the largest cash pile among U.S. corporates, with liquidity also above $90 billion, though its net cash position has narrowed as it prioritizes buybacks. The strength of its services business ensures durable cash generation, but unlike Microsoft, Apple does not face massive quarterly infrastructure outlays.
Institutional Backing and Insider Activity
Institutional ownership is massive for both. Microsoft’s float is nearly 75% held by funds, led by Vanguard, BlackRock, and State Street, holding 1.57 billion shares collectively. Apple’s ownership skews similarly, with institutions also accounting for more than two-thirds of outstanding shares. Insider stakes are minimal for both, under 0.1%, with investors able to track Microsoft through its insider transactions profile.
Read More
-
QQQ ETF At $626: AI-Heavy Nasdaq-100 Faces CPI And Yield Shock Test
11.01.2026 · TradingNEWS ArchiveStocks
-
Bitcoin ETF Flows Flip Red: $681M Weekly Outflows as BTC-USD Stalls Near $90K
11.01.2026 · TradingNEWS ArchiveCrypto
-
Natural Gas Price Forecast - NG=F Near $3.33: NG=F Sinks as Supply Surges and China Cools LNG Demand
11.01.2026 · TradingNEWS ArchiveCommodities
-
USD/JPY Price Forecast - Dollar Breaks Toward ¥158 as Yen Outflows and US Data Fuel Dollar Charge
11.01.2026 · TradingNEWS ArchiveForex
Analyst Ratings and Market Targets
Microsoft has 33 Buys and 1 Hold, with price targets spanning $550 to $700, and a median at $626.88, representing 22.6% upside. More cautious projections put year-end fair value closer to $563.64, still a double-digit gain. Apple’s consensus is $270–$305, a potential 14–28% upside from its current $237.74. Notably, Microsoft’s upside reflects aggressive AI buildout expectations, while Apple’s ceiling depends on sustaining iPhone 17 demand and navigating China headwinds.
Key Risks for Investors
Microsoft’s risks stem from capex burn and supply chain exposure, particularly its dependency on Nvidia GPU availability and tariff-related costs for servers. The $20 billion quarterly spend could compress margins if AI adoption slows. Apple’s risk profile is more geographic: 18% of its revenue is tied to China, where demand has softened under local competition and political friction. Regulatory scrutiny is a shared overhang, though Apple’s App Store practices face heavier pressure than Microsoft’s AI partnerships.
Final Verdict: Microsoft or Apple?
At $508, Microsoft is priced for growth, but with $76.4B in quarterly revenue, $27B in profit, 33% Azure growth, and $61B in free cash flow, it remains the more compelling Buy. Street targets of $563–$626 are realistic, and if AI adoption accelerates further, a run toward $675–$700 cannot be ruled out.
At $237, Apple offers defensive exposure with upside toward $305. Its iPhone 17 surge and resilient services segment ensure cash flow durability, but growth is slower relative to Microsoft’s AI-driven momentum.
For investors choosing between the two, the distinction is clear: Microsoft is the growth leader in AI and cloud infrastructure, Apple is the stability play in consumer hardware and services. Both remain indispensable portfolio holdings, but in 2025, the edge tilts toward Microsoft.


