Microsoft Stock vs Oracle Stock Forecast: MSFT and ORCL Clash in Cloud and AI Growth
Microsoft’s $3.68T scale contrasts Oracle’s $653B surge, as both chase AI-driven cloud dominance | That's TradingNEWS
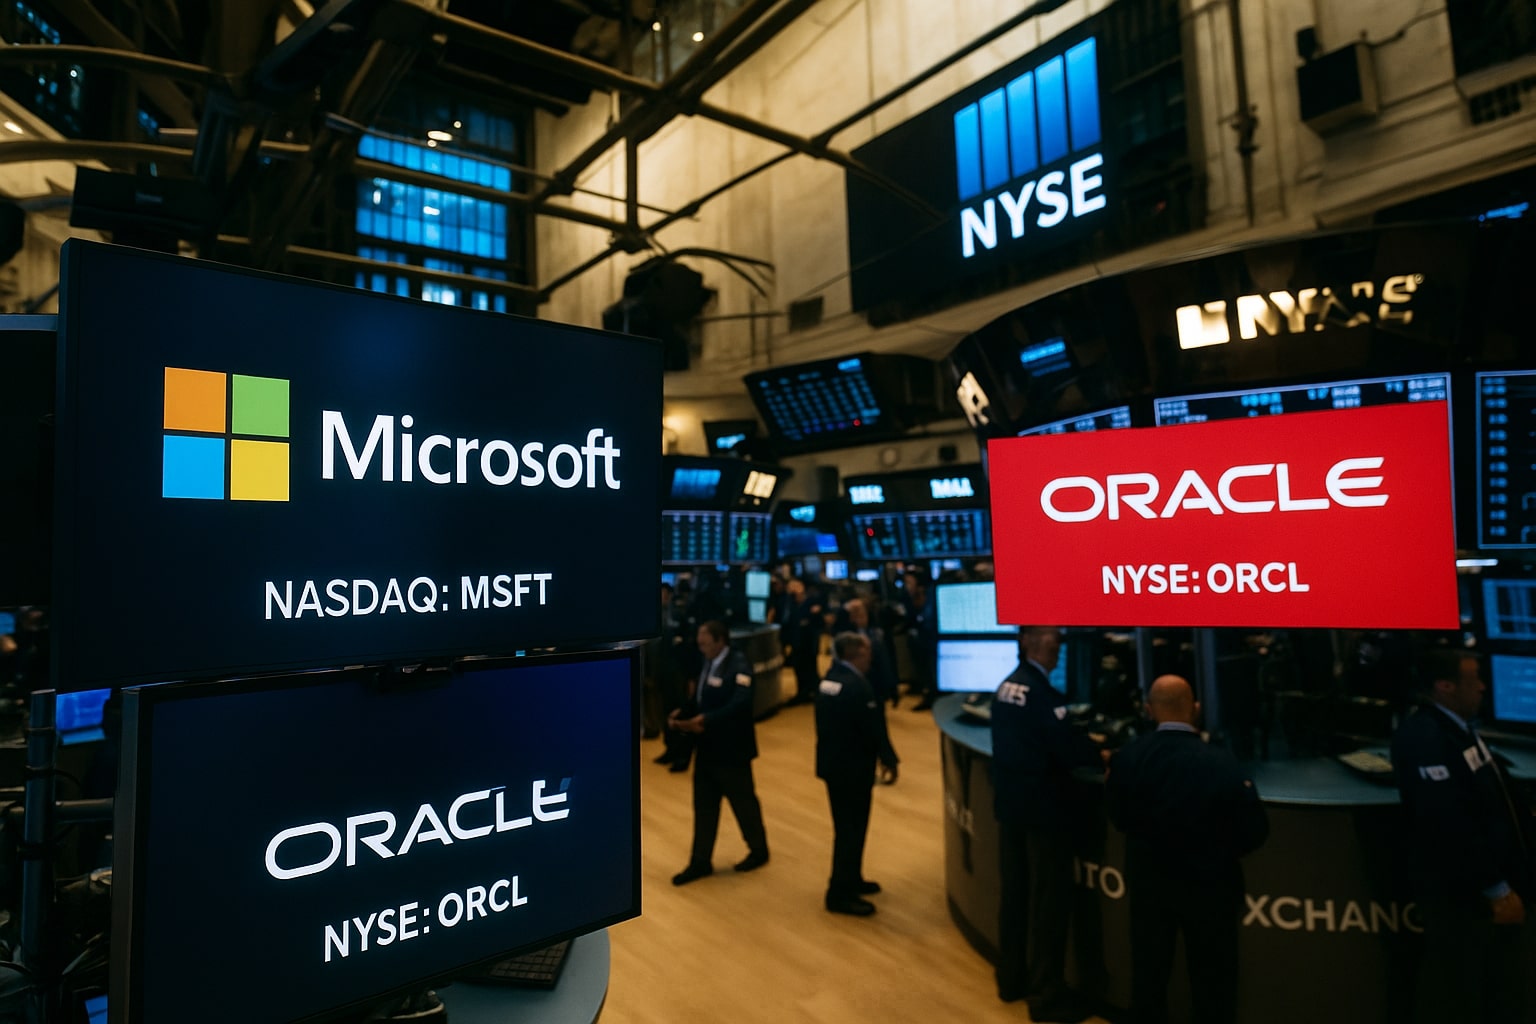
Microsoft (NASDAQ:MSFT) vs Oracle (NYSE:ORCL): Cloud Scale, AI Moats, and Valuation Clash
Stock Performance and Market Capitalization
Microsoft (NASDAQ:MSFT) trades at $495.00, down 2.55% on September 5, 2025, while Oracle (NYSE:ORCL) closed at $232.80, up 4.39%. Over the past year, MSFT has gained 22.12%, while ORCL surged 64.95%, highlighting investor enthusiasm for Oracle’s rapid cloud expansion compared to Microsoft’s steadier but larger-scale growth. Microsoft remains a behemoth with a $3.68 trillion market cap, dwarfing Oracle’s $653.9 billion. Five-year returns tell a similar story of divergence in scale and momentum: MSFT returned 140.96% while ORCL exploded 348.88%, reflecting Oracle’s rerating as it transitions from legacy databases to hyperscaler-level cloud positioning.
Revenue Scale and Growth Trends
Microsoft posted $281.72B in revenue over the past twelve months, with 18.1% YoY quarterly revenue growth in Q4 FY25, while Oracle delivered $57.4B, up 8% YoY. Despite the vast gap in topline size, Oracle’s growth in cloud infrastructure is accelerating faster. Oracle Cloud Infrastructure (OCI) grew 51% YoY to $10.2B, while SaaS rose 10% YoY to $14.3B. Combined cloud services reached $24.5B, or 74% of total revenue. Microsoft’s Azure grew 34% in FY25 to $75B, driving total cloud revenues to $168B, a 23% YoY increase. Azure now commands 20% cloud market share, compared with AWS at 30% and Google Cloud at 11%. Oracle’s smaller base allows for higher growth percentages, but Microsoft’s scale is unmatched.
Profitability and Margins
Microsoft maintains superior profitability with a 36.15% net margin and 44.9% operating margin, producing $101.83B net income. Free cash flow reached $61.07B, with $94.56B in cash reserves and a modest 32.66% debt-to-equity ratio. Oracle’s net margin is 21.68%, with an operating margin of 32.48%, translating into $12.44B in net income. However, Oracle’s balance sheet is more stressed: $11.2B in cash against $108.95B in debt, with a staggering 519% debt-to-equity ratio, leaving little margin for error if cloud growth falters. Free cash flow was just $678M, far below Microsoft’s liquidity firepower.
Backlog Strength and Revenue Visibility
Microsoft’s Remaining Performance Obligations (RPO) reached $368B, up 37% YoY, with 35% expected to convert into revenue within a year, giving unparalleled multi-year visibility. Oracle’s RPO stands at $138B, up 41% YoY, with cloud RPO alone surging 56%, building on last year’s 80% growth. Management guides for 100% RPO growth in FY26, signaling momentum, but Oracle still lags Microsoft in absolute backlog scale. The backlog conversion rate will be critical for both, as investors increasingly demand execution rather than backlog accumulation.
Capital Expenditure and Hyperscaler Expansion
Microsoft spent over $30B in recent quarters on AI infrastructure, adding 2GW of data center capacity and expanding to 400 facilities across 70 regions. Oracle is scaling aggressively too, with capex rising to $21B in FY25, guided toward $30B in 2026 and $40B in 2027, largely tied to its Stargate project in Texas. Stargate could deliver $30B–$60B in annual revenues, potentially transforming Oracle into a true hyperscaler alongside AWS, Azure, and Google Cloud. However, Oracle’s debt-heavy financing contrasts sharply with Microsoft’s cash-rich funding model, underscoring different risk profiles.
Read More
-
Wall Street's Biggest Comeback Story Meets Its Reality Check — INTC at $124 as a $200 Bull Call Clashes With a $101 Consensus
06.07.2026 · TradingNEWS ArchiveStocks
-
Ripple Keeps Winning, XRP Keeps Waiting — Token Bounces to $1.13 on Macro Relief as Good News Fails to Move the Price
06.07.2026 · TradingNEWS ArchiveCrypto
-
The War Premium Is Gone and the Glut Is Back — Crude Round-Trips From $114 to a 4-Month Low as OPEC+ Opens the Taps and Hormuz Clears
06.07.2026 · TradingNEWS ArchiveCommodities
-
Chip Trade Comes Roaring Back — Semis Lead Wall Street Higher as Intel Pops to $123.98 and the Dow Cools After Its Record Run
06.07.2026 · TradingNEWS ArchiveMarkets
-
Sterling Bounces to $1.3350 as Weak US Payrolls Hit the Dollar, but the 1.3400 Ceiling Caps the Rally Into a Pivotal Central Bank Week
06.07.2026 · TradingNEWS ArchiveForex
Valuation and Multiples
Microsoft trades at a trailing P/E of 36.29 and a forward P/E of 31.95, with a PEG ratio of 2.17. Oracle’s multiples are steeper: trailing P/E of 53.64, forward P/E of 34.48, and PEG ratio of 2.43, reflecting higher expectations relative to earnings delivery. On price-to-sales, Microsoft is at 13.12, while Oracle trades at 11.62, suggesting investors are pricing Oracle’s revenues slightly cheaper but attaching higher risk to its earnings stream. Microsoft’s EV/EBITDA of 22.76 compares to Oracle’s 31.23, reinforcing Microsoft’s more favorable valuation adjusted for profitability.
Dividends and Shareholder Returns
Microsoft pays a forward annual dividend of $3.32 per share with a yield of 0.67%, supported by a 23.75% payout ratio, while Oracle distributes $2.00 per share, yielding 0.86% with a 39% payout ratio. Oracle has a history of aggressive buybacks, shrinking shares outstanding by 33% over the past decade, at an average repurchase price near $54, versus today’s $232.80. Insider concentration is a differentiator: Larry Ellison owns ~40% of Oracle’s stock, reducing effective float to 1.64B shares out of 2.81B outstanding, amplifying scarcity and valuation. By contrast, Microsoft’s float of 7.42B shares with minimal insider holdings ensures deeper liquidity.
Growth Catalysts and Risks
For Microsoft, the AI supercycle and Azure’s 37% growth guidance for Q1 FY26 are core drivers. The OpenAI partnership, Samsung Copilot integration, and NFL deployment of 2,500 Copilot+ PCs showcase its broad ecosystem strategy. Risks lie in cloud margin compression, as Microsoft Cloud gross margin fell from 70% to 68% and is guided to 67%, exacerbated by a $6B government discount deal. For Oracle, the Stargate buildout, 70 planned cloud regions, and multicloud partnerships with Microsoft, Google, and Amazon could re-rate it permanently into hyperscaler territory. Risks are heavier debt, reliance on backlog conversion, and potential capex-driven free cash flow pressure.
Buy, Sell, or Hold Verdict
Microsoft remains the lower-risk AI and cloud giant, supported by scale, liquidity, and consistent growth, trading at fair but not stretched multiples. Oracle offers higher growth and rerating potential, with its $138B backlog and Stargate project positioning it as the “fourth hyperscaler,” but with debt risk and valuation compression threats if execution slips.
Verdict: Microsoft (NASDAQ:MSFT) is a Strong Buy for long-term investors seeking stability and AI-driven compounding, with upside targets around $613–$650. Oracle (NYSE:ORCL) is a Buy with higher risk, offering potential to reach $273–$300, but reliant on flawless backlog execution and capex discipline.