Nasdaq, S&P 500, Dow Face AI-Driven Stock Market Rally and Valuation Strain
Markets surge on AI momentum and Fed cut hopes, but record CAPE ratios, narrow tech leadership, and housing recession highlight fragile foundations | That's TradingNEWS
AI Integration Reshaping U.S. Stock Market Dynamics
The U.S. stock market — anchored by the Dow Jones Industrial Average (^DJI), S&P 500 (^GSPC), and Nasdaq Composite (^IXIC) — is in the middle of a structural shift. Artificial intelligence tools such as DeepSeek are no longer niche back-office products but market-moving engines. These systems scan terabytes of economic, earnings, and sentiment data to deliver real-time trading signals. DeepSeek’s predictive analytics amplify existing strategies, from long-term value investing to high-frequency trades executed in microseconds. Its output is reshaping capital allocation across both institutional and retail trading floors, compressing decision windows and magnifying momentum-driven cycles.
DeepSeek’s applications extend beyond technical charting. Its algorithms read earnings reports, social media sentiment, and macro releases faster than traditional analysts, providing traders with context-aware alerts. This has made the Nasdaq’s growth-heavy cohort — led by Apple (AAPL), NVIDIA (NVDA), Microsoft (MSFT), and Amazon (AMZN) — even more volatile, as AI-driven flows pile into or out of mega-cap positions within minutes of headline risk. The growing dependence on predictive analytics also magnifies systemic risk: a miscalibrated model could trigger herd-like liquidations across multiple indices simultaneously.
Nasdaq, S&P 500, and Dow Rally Meets AI-Driven Concentration Risk
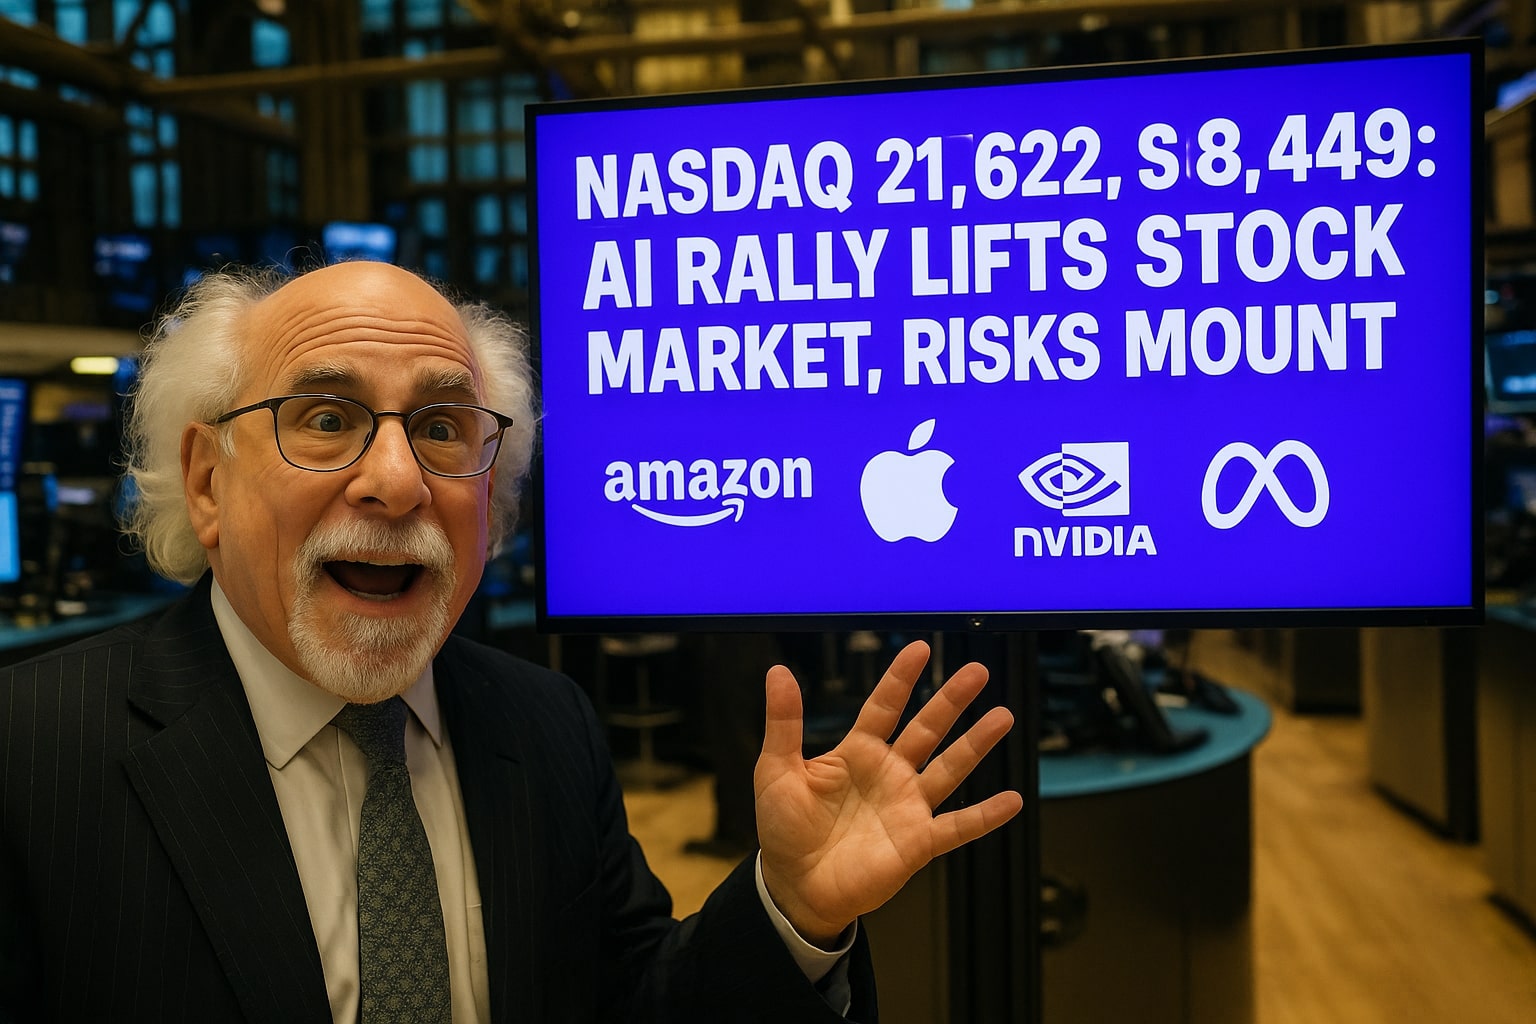
The summer of 2025 has seen a striking divergence across indices. The S&P 500 recently closed at 6,449.80, off 0.29% on August 15, but still near record territory. The Nasdaq Composite ended at 21,622.98, slightly weaker after its AI-fueled surge earlier in the year. The Dow Jones surged more than 450 points, approaching all-time highs last seen in December. Beneath the surface, however, market breadth remains alarmingly narrow.
Goldman Sachs warns that the rally rests heavily on a “Goldilocks” backdrop: moderate inflation, steady GDP growth, and hopes of a Fed rate cut. But its equity asymmetry model now signals higher downside risk than upside potential. The risk isn’t theoretical — the concentration of gains in a handful of large-cap technology firms mirrors the late 1990s dot-com bubble, where excessive optimism in growth stocks set the stage for violent drawdowns.
Valuations: The S&P 500 and the CAPE Ratio Warning
Valuation red flags are flashing. The S&P 500’s CAPE ratio sits at 37.8, far above the historical mean of 21.2 and in the 95th percentile of all readings since 1957. Historically, CAPE levels above 37 have preceded negative average returns: a -3% decline over one year, -12% over two years, and -14% over three years. This is eerily similar to valuations preceding the dot-com crash, where the market underperformed for years despite high enthusiasm for tech.
The “Magnificent Seven” — NVDA, AAPL, AMZN, MSFT, Alphabet (GOOGL), Meta Platforms (META), and Tesla (TSLA) — now represent one-third of the S&P 500’s total market capitalization. Their five-year performance has averaged +335%, dwarfing the S&P 500’s broader +92% gain. Such concentration exposes the index to asymmetric downside: any earnings miss or regulatory shock in these firms could ripple across the broader benchmark.
Algorithmic Trading’s Growing Influence on Market Volatility
Algorithmic trading (AT) is now estimated to account for more than half of all executed orders on U.S. exchanges. A recent study of Chinese markets showed that AT reduces intraday volatility by 0.817 standard deviations for every unit increase in trading algorithm intensity. Applied to U.S. markets, the implication is clear: algorithmic execution smooths order flow in liquid names like Microsoft (MSFT) or Apple (AAPL) but exacerbates fragility in small- and mid-cap stocks where liquidity is thinner.
More importantly, AT modifies investor behavior. By splitting large block trades into smaller executions, algorithms dampen the “herd effect” — the tendency of retail investors to mimic large visible orders. That said, AT also accelerates the feedback loop during risk events. In declining markets, algorithms may exit positions en masse, reducing depth and magnifying downside gaps.
Housing Weakness and Macro Headwinds Pressuring Equities
Beyond AI and algorithmic flows, the macro backdrop remains fragile. July’s CPI report showed inflation cooling, sparking bets on a September Fed rate cut of 50 basis points, fully priced into futures markets. Yet housing data tells a harsher story. Single-family building permits are down 30%, new home sales booked but not started are collapsing, and construction employment is weakening. Neil Dutta of Renaissance Macro describes housing as already in a “recession,” a condition that historically drags broader GDP through reduced consumer spending on durable goods.
For the Dow’s industrial components — Home Depot (HD) and Lowe’s (LOW) — earnings risk rises as falling home sales cut into renovation and construction demand. Housing’s weakness challenges the Fed’s balancing act: rate cuts could ease affordability but may arrive too late to stabilize employment in construction-heavy states such as Florida and Texas.
Investor Sentiment and “Buy the Dip” Dynamics
Retail flows remain pivotal. The Nasdaq’s August rebound following a weak labor market print highlighted a striking behavioral shift: every pullback has been met with aggressive dip-buying. Roughly 36% of U.S. household net worth is now tied directly to equities — the highest level since records began in the 1950s. This concentration of household wealth amplifies systemic risk, as any correction in indices like the S&P 500 could directly suppress consumer confidence and spending.
Algorithmic platforms such as DeepSeek compound this effect by detecting sentiment from Twitter (X), financial forums, and news headlines. A sudden swing in sentiment can therefore cascade more rapidly into equity pricing, magnifying volatility spikes in both the Nasdaq and the S&P 500.
Geopolitical and Policy Overhangs
Tariffs, trade frictions, and regulatory uncertainty remain unpriced risks. Goldman Sachs explicitly warns that “latent risks of unwinds” increase if growth slows or the Fed missteps. Meanwhile, energy-intensive AI buildouts raise utility costs, affecting both consumer spending and corporate margins. Geopolitical risk — particularly U.S.-China trade disputes — could further weigh on indices like the Dow Jones Industrial Average, with its heavy exposure to industrial exporters.
Verdict: Bullish or Bearish on U.S. Equities?
After restructuring all four data sources, the evidence points to a bearish tilt in the medium term despite short-term momentum. The Dow looks relatively resilient given its cyclical composition, but the S&P 500 (^GSPC) at 6,449.80 with a CAPE above 37 is priced for perfection. The Nasdaq (^IXIC) at 21,622.98 remains hostage to the “Magnificent Seven,” leaving it vulnerable to outsized swings on earnings surprises or policy shocks. AI tools like DeepSeek and algorithmic trading enhance efficiency but also compress reaction times, increasing systemic fragility.
That's TradingNEWS
Read More
-
GPIQ ETF Price Forecast: Can a 10% Yield at $52 Survive the Next Nasdaq Selloff?
09.02.2026 · TradingNEWS ArchiveStocks
-
XRP ETF Price Forecast: XRPI at $8.32, XRPR at $11.86 as $44.95M Inflows Defy BTC and ETH Outflows
09.02.2026 · TradingNEWS ArchiveCrypto
-
Natural Gas Futures Price Forecast: Will The $3.00 Floor Hold After The $7 Winter Spike?
09.02.2026 · TradingNEWS ArchiveCommodities
-
Stock Market Today: Dow Back Under 50K While S&P 500 and Nasdaq Push Higher as Gold Reclaims $5,000
09.02.2026 · TradingNEWS ArchiveMarkets
-
USD/JPY Price Forecast: Can Bulls Clear 157.5 Without Triggering a 160 Intervention Line?
09.02.2026 · TradingNEWS ArchiveForex


