Nat Gas Futures Retreat From a $3.29 Three-Month High as Maintenance Cuts LNG Demand to 16.0 bcfd
Henry Hub futures eased to ~$3.17/MMBtu, pulling back from a late-May three-month high of $3.29 after May's 18.9% surge | That's TradingNEWS
Key Points
- Henry Hub futures trade near $3.17/MMBtu, down from a late-May three-month high of $3.29 after an 18.9% May rally.
- LNG feedgas flows fell to a four-month low of 16.0 bcfd (from 17.1 in May, 18.8 record in April) on seasonal maintenance.
- Storage sits over 6% above the five-year average, a comfortable cushion that caps rallies.
Natural gas is catching its breath. Front-month Henry Hub futures have slipped to around $3.17 per MMBtu, retreating from a nearly three-month high of $3.29 reached in late May, as traders reassess a supply-demand picture that's pulling in two directions at once. The pullback follows a blistering 18.9% rally in May — one of the strongest monthly moves of the year — that carried the contract to its highest level since early February near $3.37. After a run that steep, a modest give-back is digestion, not a trend change, and gas remains comfortably in the upper half of its recent range.
The thesis for this forecast threads every level below: natural gas is a tug-of-war between near-term bearish supply signals and the bullish pull of summer cooling demand, all sitting on top of a structural LNG-export story that gets more powerful into 2027. The bearish weight is real — LNG feedgas demand has dropped to a four-month low on plant maintenance, and storage sits comfortably above the five-year average. The bullish counterweight is the heat — above-normal temperatures through mid-June are set to crank up power burn. Gas sits near $3.17 because those forces are close to balanced. The $3.00 floor and the $3.70 resistance frame the box, and the maintenance-versus-heat battle sets the near-term direction.
The Tape: Where Henry Hub Sits Right Now
Henry Hub futures are trading near $3.17 per MMBtu, down from the late-May peak of $3.29 and off the early-February high near $3.37 that marked the top of the recent run. The move tells a clear story: gas had risen sharply on expectations of stronger demand, hitting a multi-month high, and is now pulling back as the market reassesses whether those demand expectations are being met by the current fundamentals. The 18.9% surge in May — which followed a 4.1% decline in April — was a powerful move, and the current softness is the market working off some of that froth.
Context frames where this sits. Official energy forecasters peg the 2026 average Henry Hub price at just under $3.50, so current spot near $3.17 is trading slightly below the full-year forecast midpoint — neither cheap nor expensive by the year's expected range. The technical channel that's governed the market puts solid support around $3.00 and a mid-range ceiling near $4.00 to $4.20, which means $3.17 sits in the lower-middle of that band. The tape is range-bound and fundamentally driven, whipped by the weekly cadence of storage reports, weather forecasts, and LNG flow data rather than by any single dominant trend. This is a market in equilibrium, leaning on the next data point to pick a direction.
The LNG Maintenance Drag
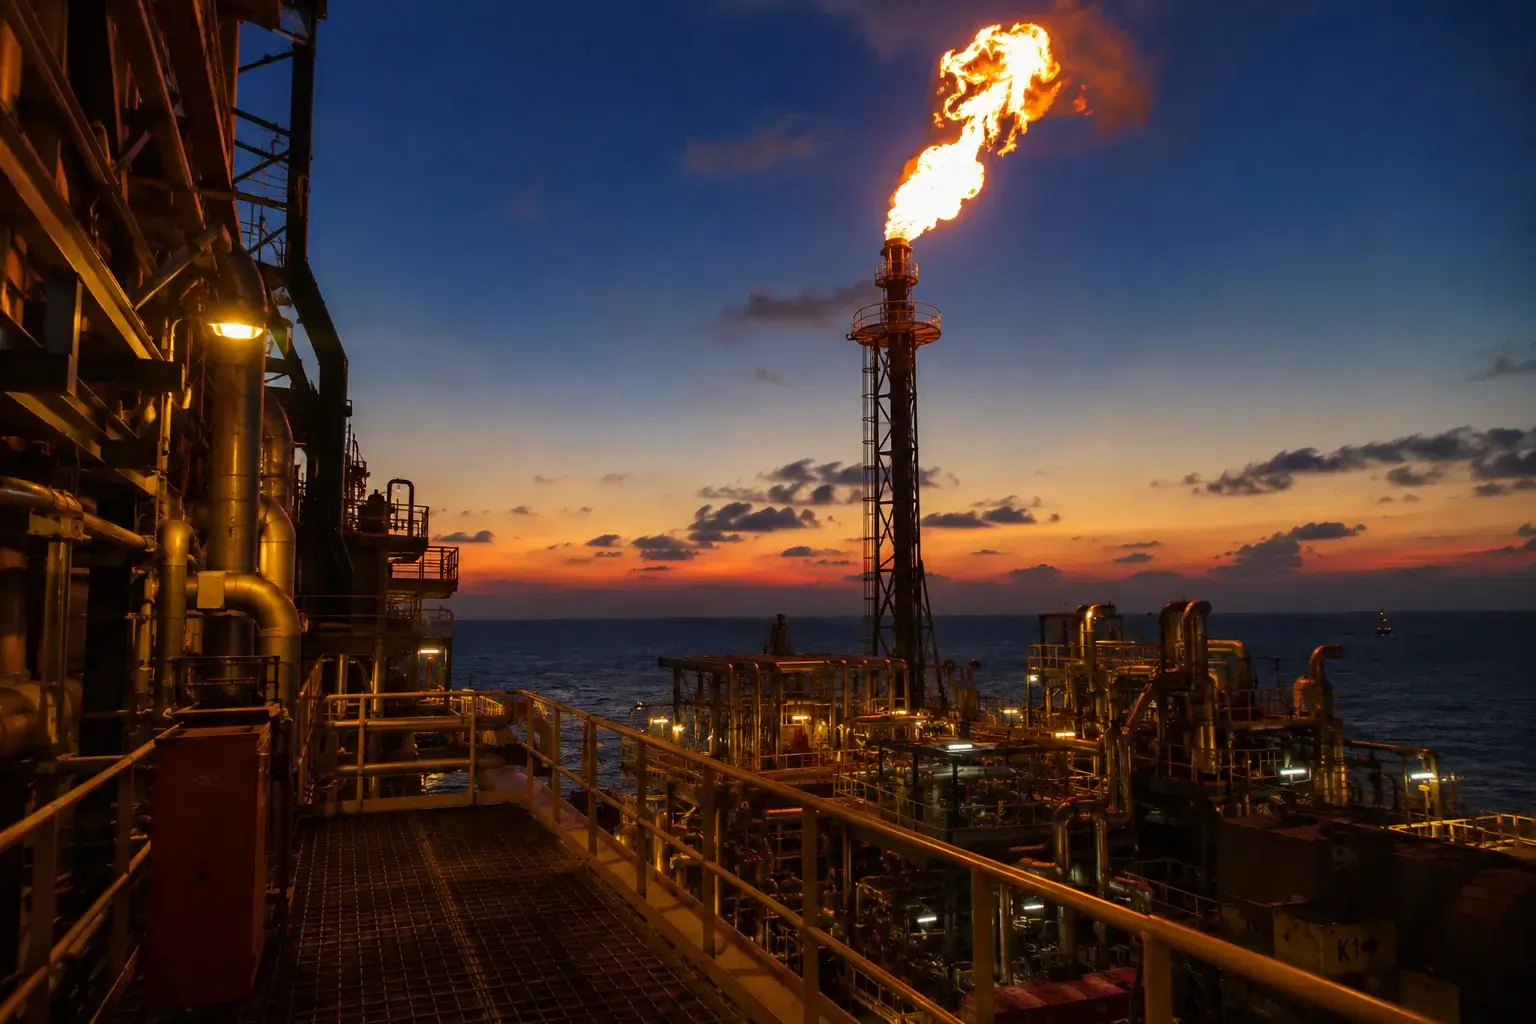
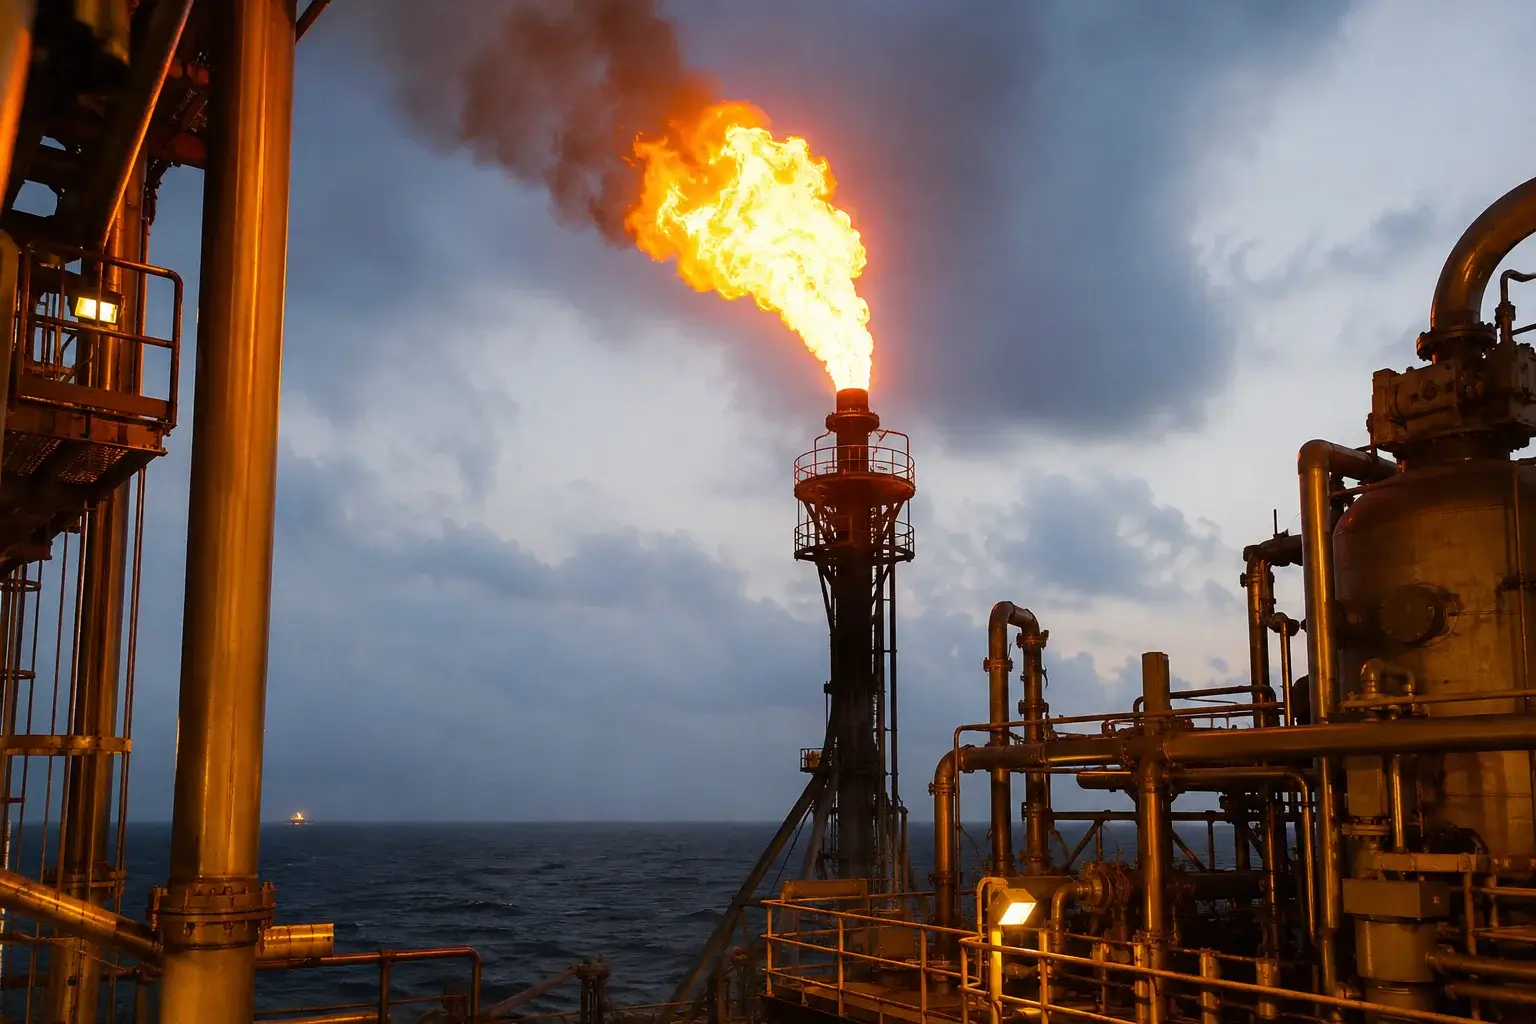
The biggest bearish weight on gas right now is a temporary one: LNG export demand has dropped on seasonal maintenance. Average feedgas flows to the major U.S. LNG export facilities declined from 17.1 billion cubic feet per day in May to 16.0 bcfd in early June, with daily flows falling to a four-month low as several plants went down for scheduled maintenance work. That's a meaningful chunk of demand pulled out of the market — and it comes off an April record of 18.8 bcfd, so the drop from peak is even sharper.
The mechanics are straightforward and they matter. When LNG export plants go offline for maintenance, the gas that would have been liquefied and shipped overseas instead stays home, which increases available domestic supply and loosens the balance. Less gas flowing to export terminals means more gas available for storage injection, which is bearish for near-term prices. That's a big part of why the contract pulled back from its three-month high — the demand side softened just as traders were pricing in stronger consumption. The key qualifier is "seasonal": maintenance is temporary, and feedgas flows typically recover once the plants come back online. So this drag is a near-term headwind, not a structural shift. But for the June tape, the four-month low in LNG demand is doing real work pulling the price down.
Storage Is Comfortable
The second bearish factor is the storage cushion. Natural gas in storage sits over 6% above the five-year average — a comfortable buffer that gives the market room to absorb demand without the supply anxiety that drives price spikes. When inventories are ample, the market has less reason to bid gas higher, because there's a healthy stockpile to draw on if demand surprises to the upside. A storage level 6%-plus above the seasonal norm is the opposite of the tight, drawn-down condition that produces explosive rallies.
That cushion is the structural reason gas isn't ripping despite the summer-demand setup. Comfortable storage caps the upside on any weather-driven rally, because traders know there's a buffer to meet incremental demand. It also amplifies the bearish effect of the LNG maintenance drag — with feedgas demand down and storage already ample, the injections building inventory get larger, pushing the cushion even higher. The storage picture is the ballast keeping the market range-bound: it doesn't force prices lower on its own, but it removes the scarcity that would otherwise let a heat-driven demand spike run away to the upside. As long as storage stays comfortably above the five-year average, rallies face a ceiling and the bulls have to work for every move higher.
The Heat Is the Bullish Counterweight
Against the bearish supply signals stands the summer's most reliable bull: the weather. Forecasts point to mostly above-normal temperatures through the middle of June, a trend expected to boost gas consumption from power generators as air-conditioning demand rises. In the summer, electricity demand for cooling is the dominant swing factor for natural gas, because gas-fired power plants ramp up to meet the air-conditioning load. Above-normal heat means more power burn, which means more gas demand, which is the counterweight limiting how far the maintenance-and-storage drag can push prices down.
This is the seasonal dynamic that defines summer gas trading. The market lives and dies on the temperature forecast — a hotter-than-expected stretch cranks up power burn and tightens the balance, while a mild spell collapses cooling demand and lets storage build. Right now the forecast leans hot, which is why the pullback to $3.17 has been contained rather than a freefall. The above-normal temperature outlook through mid-June is providing a demand floor under the market even as LNG maintenance pulls from the other side. The tug-of-war between bearish supply and bullish heat is the entire near-term story, and the weather models are the single most important input for predicting gas's next move. Watch the forecast more than the chart.
Production Holding Near Records
On the supply side, production is holding near record levels but ticking slightly lower, which adds a mildly supportive note. Gas production in the Lower 48 states averaged 108.8 bcfd so far in June, down modestly from 109.7 bcfd in May, which itself was slightly below April's 109.8 bcfd. The output is still enormous — near all-time highs — but the small sequential dip means producers aren't flooding the market with incremental supply, which provides a touch of support against the bearish storage and LNG-maintenance factors.
The production picture is the steady backdrop the whole balance rests on. Record-high output is the structural reason U.S. gas has been cheap and the reason official forecasters see supply growth roughly keeping pace with demand in 2026. But the slight recent dip matters at the margin: when production eases even modestly while summer cooling demand ramps, the balance tightens incrementally, which supports price. The key thing to watch is whether production stays flat-to-lower or whether the recent strength in prices pulls more output online — higher prices tend to incentivize drilling, and a production surge would loosen the balance and cap the upside. For now, output near records but edging lower is a mildly constructive factor in an otherwise two-sided market.
The LNG Export Story Is the Structural Bull Case
Step back from the weekly noise and the structural story is the one that matters most for the longer-term forecast: U.S. natural gas is increasingly connecting with global markets through LNG exports, and that's transforming the market's fundamentals. After years of being trapped within North America — which kept prices low and volatile around domestic weather — U.S. gas now has a growing export outlet that links Henry Hub to global demand. That connection is the single biggest structural shift in the market, and it's why analysts see gas entering a period of strengthening fundamentals even as oil faces oversupply.
The LNG export build-out is a one-way demand story. New export capacity coming online creates structural, growing demand for U.S. gas that doesn't disappear with the weather — it's baked into long-term contracts and physical infrastructure. The major capacity waves, with large new facilities ramping up through the middle of the decade, are set to pull progressively more gas out of the domestic market and onto tankers bound for Europe and Asia. That's why the consensus longer-term forecasts cluster meaningfully higher, in the $4.00 to $5.00 range, with the most bullish calls reaching $5-plus. The current maintenance-driven dip in feedgas flows is a blip against this backdrop. The structural direction of LNG demand is up, and it's the foundation of the bull case that the near-term softness obscures.
The 2027 Tightening on the Horizon
The structural story has a timeline, and it points to a sharp tightening in 2027. Official energy forecasters expect the Henry Hub price to dip slightly in 2026 — averaging just under $3.50, down about 2% from the prior year — as supply growth roughly keeps pace with demand, supply outpacing demand by about 0.5 bcf/d. But that balance flips hard the following year: in 2027, demand growth is forecast to outrun supply growth by 1.6 bcf/d, driven mainly by more feed-gas demand from LNG export facilities, which draws down storage and puts strong upward pressure on prices. The forecast has Henry Hub rising sharply to just under $4.60 in 2027 — a roughly 33% jump.
That 2026-versus-2027 contrast is the heart of the structural outlook. This year is the calm before the tightening: ample supply, comfortable storage, and a slight oversupply keep prices range-bound in the low-to-mid $3s. Next year, the LNG export ramp tips the balance into deficit, and the forecast jumps a third. For traders, the implication is that 2026's range-bound chop is setting up a more bullish 2027, as the export demand wave finally outpaces the production growth that's kept gas cheap. The current price near $3.17 reflects the comfortable 2026 balance; the longer-dated contracts and the 2027 outlook reflect the coming tightening. The market is pricing a transition, and the structural direction is toward higher prices as the decade progresses.
Read More
-
PSI ETF at $152.85, Down 19.2% From $189.24, After Returning 102.37% in 2026 Against SMH's 66.2% — AUM Reaches $3.82B
23.07.2026 · TradingNEWS ArchiveStocks
-
XRPI Falls 2.48% and XRPR Drops 2.59%, Both Underperforming XRP's 1.73% Decline
23.07.2026 · TradingNEWS ArchiveCrypto
-
August Futures Hold $2.957 With Production at 110.9 Bcf/d and LNG Feedgas at 17.9 Bcf/d — Bulls Need $2.974 Before $3.121
23.07.2026 · TradingNEWS ArchiveCommodities
-
Dollar Holds 163.06 After the Yen's 40-Year Low at 163.24 as Oil Breaks $100 and Tokyo Warns of Decisive Action — Bulls Eye 164 and 165, Bears Need 162.00
23.07.2026 · TradingNEWS ArchiveForex
The Global LNG and Geopolitical Dimension
There's a geopolitical layer worth noting, because U.S. gas is now a global commodity. The same Middle East conflict roiling oil markets touches LNG too — the Strait of Hormuz, the chokepoint carrying roughly one-fifth of the world's oil, also carries a comparable share of global LNG, including major flows from Qatar. Disruptions to that waterway tighten the global LNG market, which raises international gas prices and, by extension, strengthens the economics and pull of U.S. LNG exports. A world short of seaborne gas is a world that wants more American LNG.
For Henry Hub specifically, this dimension is more indirect than for oil, because the U.S. benchmark is driven primarily by domestic weather, storage, and production rather than by global prices directly. But the connection is real and growing: as U.S. export capacity expands, Henry Hub becomes more sensitive to global LNG demand and the geopolitical events that drive it. A tightening in global LNG supply — whether from Hormuz disruptions or other geopolitical shocks — incentivizes maximum U.S. export flows, which pulls more gas out of the domestic market and supports Henry Hub prices. It's a secondary factor for the near-term tape, where maintenance and weather dominate, but it's part of why the structural story leans bullish. The more connected U.S. gas becomes to the world, the more global events matter for the domestic price.
The Chart: Range-Bound Between $3 and $3.70
The technical picture has gas trading in a well-defined channel. Support sits firmly around $3.00 — a level the market has defended and one that analysts flag as the line where a break below would turn the structure decisively bearish. The first resistance overhead is the 50-week moving average near $3.70, and above that the mid-range of the channel runs to $4.00–$4.20, with the upper band stretching above $5.00 in the most bullish scenarios. Current spot near $3.17 sits in the lower-middle of that range, having pulled back from the late-May test toward the upper portion.
The levels frame the trade cleanly. On the downside, $3.00 is the floor that defines everything — holding it keeps the range-bound-to-bullish structure intact, while a decisive break below would signal the bearish supply factors have won and open a deeper slide. On the upside, reclaiming the late-May high near $3.29 and then challenging the 50-week average at $3.70 is what the bulls need to confirm the uptrend has resumed. Inside the $3.00-to-$3.70 band, gas is range-bound and headline-driven, whipped by weather forecasts and weekly storage data. The smart read on a channel like this is to respect the edges — $3.00 is the line that matters most, and a break of either boundary sets the next directional move. For now, the chart reads as a healthy consolidation after the May rally.
The Forecast: Scenarios Into Summer
The honest forecast is a set of scenarios, because gas is balanced between competing near-term forces and a bullish structural backdrop. The base case has Henry Hub chopping in a $3.00–$3.70 range through the early summer, with the bearish LNG maintenance and comfortable storage capping rallies while above-normal heat and near-record-but-easing production provide a floor — a range-bound, weather-driven tape that aligns with the sub-$3.50 full-year forecast. This is the path the fundamentals and the technicals favor for the months ahead.
The bullish case needs the heat to intensify and the LNG plants to come back: a hotter-than-forecast summer that cranks up power burn, combined with feedgas flows recovering from maintenance, would tighten the balance and push gas through the 50-week average at $3.70 toward the $4.00–$4.20 mid-channel, with the structural LNG-export story and the 2027 tightening providing the longer-term fuel toward $5. The bearish case is a mild-weather break: a cool spell that collapses cooling demand, combined with the comfortable storage cushion and extended LNG maintenance, would pressure gas toward the $3.00 floor, and a decisive break below would open a deeper slide as the oversupply asserts itself. The spread between a sub-$3 break and a push toward $4-plus is the range the summer will resolve. The path runs through the weather forecast and the LNG flow data, not through any chart pattern — watch the temperature outlook and the feedgas recovery above all else.
Bottom Line: A Weather-Driven Range Atop a Bullish Structural Story
Natural gas futures have slipped to around $3.17 per MMBtu, retreating from a late-May three-month high of $3.29 after a 18.9% May rally, as the market digests competing forces. The bearish weight is real: LNG feedgas demand fell to a four-month low of 16.0 bcfd on seasonal maintenance, and storage sits comfortably over 6% above the five-year average. The bullish counterweight is the heat — above-normal temperatures forecast through mid-June are set to boost power burn — alongside production easing slightly from record levels. Structurally, the LNG export story and the 2027 tightening, when official forecasters see Henry Hub jumping 33% to nearly $4.60, lean the longer-term outlook higher.
The level map is clean: $3.00 is the floor that defines the trade, the late-May high near $3.29 is the first resistance, and the 50-week average at $3.70 is the line the bulls must reclaim to target the $4.00–$4.20 mid-channel. The base case is a range-bound, weather-driven tape between $3.00 and $3.70 through the early summer, with the maintenance-versus-heat tug-of-war setting the near-term direction. The path runs through the temperature forecast and the LNG feedgas recovery. None of this is personalized financial advice — natural gas is among the most volatile commodities, and a single weather model shift can move it sharply in either direction.