





Natural Gas Futures Price Forecast — NG at $2.87 Is the Only Energy Market Falling, With $3.57 the Fourth-Quarter Path
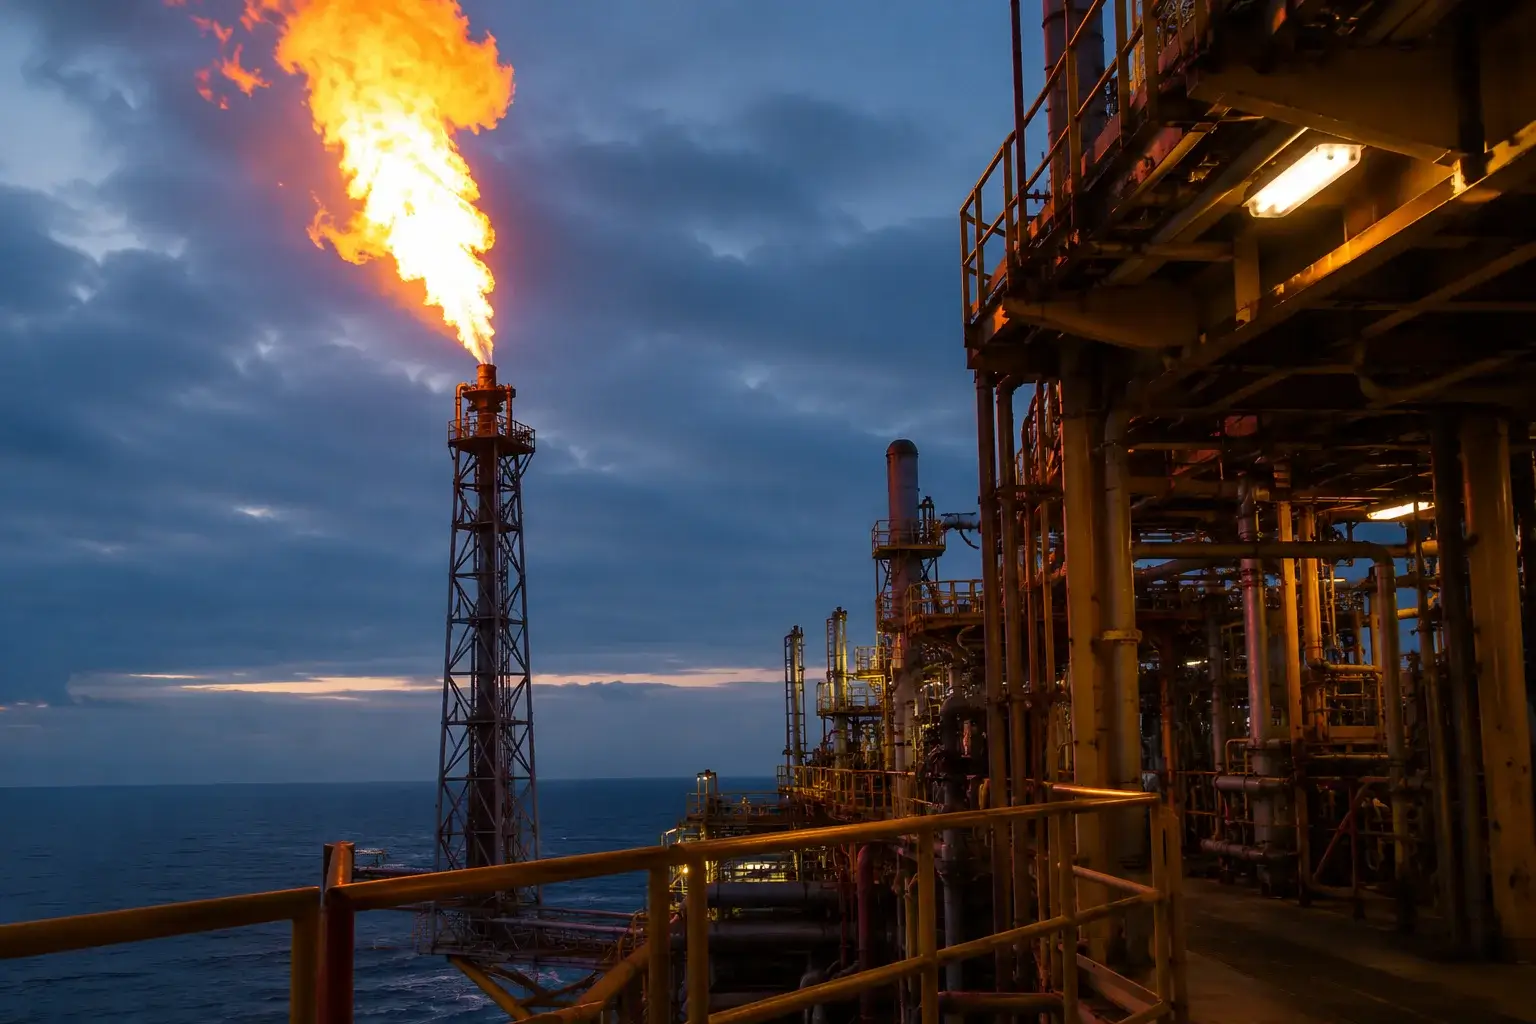
Freeport LNG took two of three trains offline on July 10 through late August, cutting feedgas to about 1 Bcf/d from 2.5 Bcf/d. JKM sits at $17.867 | That's TradingNEWS
Key Points
- Henry Hub trades $2.87, down 12.4% from the $3.28 August contract high on July 8.
- Storage built 61 Bcf against a 49 Bcf forecast, holding the surplus at 6.6% above average.
- Lower 48 production rose to 110.2 Bcf/d in July from 110.0 Bcf/d in June.
U.S. natural gas fell to around $2.87 per MMBtu on Wednesday, the lowest level in two months, pressured by rising production, weaker demand expectations and lower LNG export flows during planned maintenance at Freeport LNG in Texas. The front-month contract broke below $2.90 in a market that traded $3.15 to $3.34 through the second half of June.
On the same session, Brent sat at $85.92 with a reimposed naval blockade of Iranian ports, and WTI printed $79.06 after touching one-month highs above $80.
That divergence is the entire story. Henry Hub is the only energy benchmark on earth going down this week, and it is going down for reasons that have nothing to do with the Gulf.
The decline has been sequential and it is documented. The August contract fell 18.6 cents to $3.026 by late morning on July 9, closed down 13.9 cents or 4.3% at $3.073 for its lowest settlement since May 27, slid another 9 to 10 cents to around $2.90 by late morning July 10, and printed $2.91 by the end of that session. It has since broken $2.90 and reached $2.87. That is a 12.4% decline from the $3.28 top of the August range on July 8.
The July prompt-month contract averaged $3.21 per MMBtu, 11.4% higher than the June average, before expiring at $3.23 on June 26. The August contract opened its life trading $3.18 to $3.28 through July 8 and has lost 40 cents in five sessions.
Context for how unusual this is: ample domestic supply shielded the U.S. from the export pressures coming out of the Middle East. The rest of the world is paying a war premium. America is paying $2.87.
The forecast has Henry Hub spot averaging close to $3.70 across 2026. Spot is 22% below that.
Freeport Took Two Trains Offline and Stranded 1.4 Bcf/d at Home
Freeport LNG began a major maintenance turnaround at its Texas export facility on July 10, running through late August. The operator announced the work on July 9, said it would focus on the plant's pre-treatment and liquefaction facilities to ensure safe and reliable operations, and declined to specify how many units it was taking down or how much production would be affected.
The nomination data answered the question anyway.
Scheduled feedgas deliveries to Freeport fell to about 1 billion cubic feet per day on July 10, a decline of more than 700 million cubic feet per day from July 9, and amounted to roughly 35% of the maximum observed flows to the facility. That is down from about 2.5 Bcf/d during the first six days of July. Two of the plant's three liquefaction trains are offline.
The terminal can produce about 16.5 million metric tons per year of LNG and ship roughly 20 cargoes per month when running normally. It represents 2.4 Bcf/d of demand and roughly 2% of overall U.S. gas production.
That is the mechanism. Maintenance at an export plant is not a supply event. It is a demand event, and it traps supply inside the domestic market. Instead of creating tighter conditions, the outage has redirected additional gas into the U.S. balance at the exact moment production is climbing.
The aggregate feedgas numbers show the size. Overall U.S. LNG feedgas demand fell to about 18.3 Bcf/d on July 10 after averaging roughly 19.7 Bcf/d from the start of the month through July 6. Average flows to the nine big export plants have run 17.8 bcfd so far in July, up from 17.4 bcfd in June but below the April record of 18.8 bcfd.
1.4 Bcf/d of demand disappeared overnight and sits in the domestic market until late August.
Six weeks of it.
The 61 Bcf Injection Was a 12 Bcf Miss and It Broke the Tape
Energy firms added 61 billion cubic feet of gas to storage during the week ended July 3. Analysts had forecast a 49 Bcf build. The same week last year delivered 53 Bcf.
A 12 Bcf miss on a 49 Bcf estimate is a 24% overshoot, and it landed in the week that contained the first heatwave of the summer.
That is the number that broke the market. Record-breaking heat and soaring power demand had less impact on supply than most analysts expected, sending already-sinking futures lower. Natural gas demand for electric power generation averaged 45.6 Bcf per day for the week ending July 7, more than 15% higher than the previous week, and the balance still built 61 Bcf.
Read that sequence carefully because it is the whole bear case. The market got its heatwave. Power burn jumped 15%. Storage built 24% more than forecast. If a mid-summer heat event cannot produce a bullish print, nothing between here and October can.
The pattern is now self-reinforcing. Each time a new injection is reported, it tends to push the price lower unless the build comes in below expectations. Inventories remain around 6% above the five-year average and are still receiving fresh injections.
The next report lands Thursday and covers the week ended July 10. Market estimates show inventories staying around 6.6% above the five-year average for that week, which is unchanged from where they sat on July 3. That is a market forecasting that a full week of Freeport's outage plus 110.2 bcfd of production plus cooling demand nets to no change in the surplus.
No change in a 6.6% surplus during peak cooling season is a bearish outcome. The surplus is supposed to shrink in July.
Production Hit 110.2 Bcf/d and It Is Still Climbing
Average gas production in the Lower 48 states increased to 110.2 billion cubic feet per day so far in July, up from 110.0 bcfd in June. Record U.S. production is helping meet rising demand and putting moderate downward pressure on prices.
That 0.2 Bcf/d increment sounds trivial. It is not, because of what it happened against.
Production is rising in a month when the prompt contract fell from $3.28 to $2.87, a 12.4% decline. Producers are adding volume into a falling price, which means the marginal barrel of gas in this market is coming out of associated production and from wells with sunk capital rather than from a rig response to price signals. That supply does not shut in at $2.87. It does not shut in at $2.50 either.
The structural balance confirms it. Supply growth outpaces demand growth by 0.5 Bcf/d across 2026 before falling behind by 1.6 Bcf/d in 2027. That is a 2.1 Bcf/d swing, and all of it happens next year.
This year is the surplus year, and the market is trading it.
The demand side is not helping. Forecast natural gas demand across the economy rises slightly this year before increasing 3% in 2027. Consumption in the residential and commercial sectors falls 4% in 2026 to 22.1 Bcf/d on closer-to-normal temperatures against 2025's colder-than-normal winter months. Industrial consumption decreases in both 2026 and 2027 on closer-to-normal weather and decreased industrial activity as measured by the gas-weighted manufacturing index.
Residential down 4%. Industrial down. Production up. Exports interrupted for six weeks.
110.2 Bcf/d against that demand stack is what $2.87 looks like.
A 6.6% Storage Surplus in the Middle of Cooling Season
U.S. gas stocks sat 6.6% above the five-year seasonal average as of July 3, supported by mild spring weather that allowed producers to build inventories ahead of summer. Estimates put inventories around 6.6% above the average for the week ended July 10 as well.
A storage surplus that does not shrink through the first two weeks of July is the most bearish fact available in this market.
The seasonal mechanics explain why. Injection season runs April through October, and the surplus is supposed to erode through July and August as cooling demand eats into the build rate. Instead the surplus is static at 6.6% while the front-month contract has lost 40 cents. The market is pricing forward: it knows the Freeport outage runs to late August, it knows production is at 110.2 bcfd, and it knows the next seven weeks of injections land on a base that is already comfortable.
That comfort is why the forecast keeps Henry Hub spot relatively stable, supported by record production and above-average underground storage inventories.
The longer-term picture is where the bulls live. Storage inventories gradually move below the rolling five-year average across the forecast horizon as demand outpaces supply, a genuine change from 2024 and 2025 when inventories held 1.7% above the norm. The mechanism is LNG feed gas demand from export facilities drawing down the balance.
That is a 2027 story. The 2026 story is a static 6.6% surplus at the peak of the demand season.
Comfortable supply conditions is the exact phrase, and it is why $3.00 broke.
Solar and Wind Took the Share the Heat Should Have Given Gas
Solar and wind power generation across the United States rose to near record highs in July, taking market share from gas-fired plants.
That single line explains why 45.6 Bcf/d of power burn during a heatwave still produced a 61 Bcf injection.
The dynamic is structural rather than seasonal and it is new. Historically, a mid-summer heat event was a straight bid for gas: air conditioning load rises, the grid dispatches the marginal unit, and the marginal unit is a combined-cycle plant burning Henry Hub gas. That relationship is being diluted at the exact moment renewable capacity has scaled enough to serve the peak.
The same conditions that drive cooling demand drive solar output. A high-pressure heat dome over the central and eastern U.S. is a cloudless sky. The heat that lifts the load also lifts the generation that competes for it.
The offsetting force is real and it is large. Electric power consumption of natural gas rises 2% year over year in 2026 and 4% in 2027, reaching a record 38.1 Bcf/d. Monthly consumption is forecast to hit 50.6 Bcf/d in July 2027, which would be the most in any month on record. The increase is driven by rising overall electricity demand, additions to the gas generating fleet, and relatively low gas prices.
The unprecedented surge in electricity demand has also pushed the cost of new U.S. gas-fired power generation to its highest level in nearly two decades, which slows the fleet additions that the demand forecast depends on.
Wholesale electricity prices are forecast to average about $45 per megawatt-hour this summer, lower than last summer, primarily because of lower gas costs at the plant gate. Heatwaves could still cause spikes.
Gas is winning the volume war and losing the price war. That is what a commodity in structural surplus does.
The Weather Flipped on Tuesday
Forecasts turned cooler on Tuesday, with below-average temperatures anticipated across the Southwest through July 23, likely limiting cooling demand. That call landed against a backdrop where warmer-than-normal temperatures were forecast through July 28 and were supposed to support power sector demand.
The market took the cooler read and sold it.
That reaction function is diagnostic. In a tight market, a two-week cooling forecast in one region is noise. In a market carrying a 6.6% storage surplus, 110.2 bcfd of production and 1.4 Bcf/d of stranded feedgas, it is the marginal input that decides the direction, because there is nothing else supporting the price.
The July history frames how quickly this turned. The first heatwave of the summer spread across the central and eastern U.S. over the Fourth of July weekend and pushed electric power demand higher. Power burn hit 45.6 Bcf/d for the week ending July 7. Henry Hub futures stayed relatively steady inside a $3.15 to $3.34 range amid strong supply fundamentals.
Steady on a heatwave. Then Freeport, then the 61 Bcf miss, then the cooler forecast, and the contract is at $2.87.
The regional dispersion is worth flagging. The mid-summer heat wave of 2026 served as a case study in regional market insulation, with East Coast markets experiencing dramatic moves while the impact on Houston Ship Channel cash prices was muted as of July 10, coinciding with cooling temperatures across the Southeast.
That is a national benchmark that no longer reflects a national market. Basis is doing the work.
Weather is the only bullish variable left and it just turned.
JKM at $17.867 and the Arbitrage That Cannot Clear
The August JKM benchmark, reflecting LNG delivered to Northeast Asia, was assessed at $17.867 per MMBtu on July 10, down 10.9 cents from the previous assessment but roughly 67% above prewar levels. The DES Northwest Europe marker for August was assessed at $16.045 per MMBtu, down 55.4 cents day over day and about 62% above pre-conflict prices.
Henry Hub is $2.87.
That is a $15.00 spread to Asia and a $13.18 spread to Europe on the same molecule. In a functioning market, that arbitrage closes. It cannot close, because the capacity to liquefy and ship is the constraint rather than the price.
Freeport's outage is the proof. The terminal can produce 16.5 million metric tons per year and ship 20 cargoes a month, and two of its three trains are down until late August. That outage during peak summer demand months stands to reduce Atlantic Basin supplies available for Asia-Pacific seasonal cooling demand and for refilling European storage inventories.
The global backdrop makes the spread structural rather than transient. Global LNG spot prices remain volatile as the conflict in the Middle East continues to constrain about 20% of global supply that normally passes through the Strait of Hormuz. Washington reinstated its naval blockade of Iranian ports this week and U.S. forces struck dozens of Iranian military assets near the strait in a seven-hour operation late Tuesday.
The world is short LNG at $17.867. America is long gas at $2.87. The bottleneck is a maintenance turnaround in Quintana, Texas.
That is the most profitable spread in energy and nobody can capture it for six weeks.
Hormuz Insulates America and That Is Exactly the Bear Case
U.S. natural gas prices fell to a two-month low on Wednesday, contrasting with higher prices in other benchmarks, as ample domestic supply shielded the U.S. from the export pressures coming out of the Middle East.
That insulation is the single most important structural fact in this market and it cuts against the price.
Run the counterfactual. If the U.S. were import-dependent on LNG the way Europe and Japan are, Henry Hub would be trading at a premium to $16.045 right now. Instead, 110.2 Bcf/d of domestic production plus a 6.6% storage surplus plus 1.4 Bcf/d of stranded Freeport feedgas means the Gulf conflict has zero transmission into the domestic balance.
The connection between American gas and global gas is a physical pipe into a liquefaction train. When the train is down, the pipe is a wall.
That is why crude and gas have decoupled completely. Brent at $85.92 and WTI at $79.06 respond to Gulf tankers because oil is fungible and waterborne. Henry Hub at $2.87 does not, because North American gas is a closed system with a valve on it.
The read-across for the inflation data matters. June CPI fell 0.4% and PPI fell 0.3%, both led by energy, and both prints collapsed July hike odds from 42% to 17%. The crude move back above $85 threatens to reverse that in the July data. Gas at $2.87 does not, and gas is the input into the $45 per megawatt-hour wholesale power forecast that flows into electricity prices for every household in the country.
Gasoline is going up. Electricity is going down. That divergence is why the July inflation print is genuinely uncertain rather than obviously hot.
The domestic buyer is being protected. The domestic producer is paying for it.
Read More
-
Yen Stalls at 160 Despite a 3% JGB and Tokyo Core CPI at 2.0% — Intervention Sits at 164, Friday's Payrolls Decide
02.09.2026 · TradingNEWS ArchiveEnergy
-
QQQ ETF ($706.22) Slides 7.4% Below Its High as the Market Reprices the AI Capex Bill — $686.57 Target if $700 Breaks
22.10.2026 · TradingNEWS ArchiveStocks
-
XRPI ($7.00) and XRPR ($10.74) Slide Toward 52-Week Lows as Spot XRP ETF Flows Stall at $708,510
22.10.2026 · TradingNEWS ArchiveCrypto
-
NG ($2.775) Decoupled From Europe’s €88 Gas Crisis as LNG Feedgas Hits 18.9 Bcf/d — $3.30 Upside on Cold Weather
22.10.2026 · TradingNEWS ArchiveCommodities
-
Dollar-Yen (157.35) Loses 157.65 as the Yen Rallies on Haven Demand — 155 Target if 156 Breaks
22.10.2026 · TradingNEWS ArchiveForex
The Forecast Says $3.57 in Q4 and $3.78 in Q1
Henry Hub spot prices are projected to average $3.57 per MMBtu in the fourth quarter of 2026, 5% below the same period in 2025, and $3.78 in the first quarter of 2027, up 6% from the fourth quarter. The full-year 2026 average is close to $3.70 before declining below $3.50 next year, with 2027 landing just under $3.50 against an average close to $3.60 in 2025.
Spot is $2.87. The fourth-quarter forecast is 24.4% above it. The first-quarter 2027 forecast is 31.7% above it.
That gap is the trade and it is not a directional call. It is a calendar call.
The forward curve is already carrying it, which is why the front month collapsed while the strip held. The 12-month futures strip has softened in recent weeks but nothing like the 40-cent move in the August contract. Freeport returns in late August. Injection season ends in October. Winter demand arrives. Every one of the bearish inputs holding the prompt at $2.87 has an expiration date.
The forecast's own reasoning is the caveat. Henry Hub spot prices are expected to remain relatively stable, supported by record natural gas production and above-average underground storage inventories. Stable is not the same as $3.70. A market that averages $3.21 in July and $2.87 in mid-July has to print well above $3.70 in the back half to hit the annual number.
The market's response to the outlook has been telling. A muted reaction in forward prices to the latest official outlook suggests the curve had already priced it.
$2.87 to $3.57 is 70 cents of contango over five months. That is what the balance sheet says the wait is worth.
2027 Is Where the Tightness Actually Lives
Every genuinely bullish number in this market is a 2027 number.
Consumption in the electric power sector rises 2% in 2026 and another 4% in 2027 to a record 38.1 Bcf/d. Monthly consumption reaches 50.6 Bcf/d in July 2027, the most in any month on record. Demand across the economy rises slightly this year before increasing 3% next year. Supply growth outpaces demand by 0.5 Bcf/d in 2026 and then falls behind by 1.6 Bcf/d in 2027, putting upward pressure on prices. Storage inventories gradually move below the rolling five-year average as demand outpaces supply.
The January outlook was more aggressive still, projecting spot rising 33% in 2027 to just under $4.60 per MMBtu, driven mainly by more feed gas demand from LNG export facilities reducing gas in storage.
The July outlook revised that to just under $3.50 for 2027.
That revision is the most underappreciated data point in this file. The 2027 forecast came down more than a dollar between January and July, from $4.60 to $3.50, a 24% cut. The tightness thesis is intact and the magnitude has been marked down by a quarter.
The reason is production. Record U.S. output keeps meeting rising demand, which is the same force capping 2026 at $2.87 and capping 2027 at $3.50. The gas is there. The Appalachian and Permian associated volumes do not respond to price the way the 2008 or 2014 cycles did.
The demand growth is genuine and it is large. It is also being met.
The cost of new gas-fired power generation at the highest level in nearly two decades is the swing factor. If the fleet additions the 38.1 Bcf/d forecast depends on get delayed by capital costs, the demand does not arrive on schedule and 2027 looks like 2026.
$2.87 today, $3.50 next year. That is the whole curve.
The Buildout Is Adding Demand and Not Fast Enough
The first 0.4-bcfd phase of the Energia Costa Azul plant in Mexico shipped its first cargo, destined for Asia. Gas consumers in California will compete with Costa Azul for supplies from the Permian shale in Texas and New Mexico.
That is real incremental demand pulling on the same molecules, and it is 0.4 Bcf/d against 110.2 Bcf/d of production. It is not the marginal input.
Golden Pass LNG has steadied deliveries after a late-June swoon, offering a bright spot for feedgas demand as the Freeport turnaround pulls export volumes lower. That is the pattern across the entire export complex: individual facilities ramping, one large facility down, and net feedgas at 17.8 bcfd in July against an April record of 18.8 bcfd.
The complex is 1.0 Bcf/d below its own peak in the middle of the highest-priced global LNG environment since the invasion of Ukraine, with JKM at $17.867 and Northwest Europe at $16.045.
That is the constraint stated plainly. U.S. LNG exports are capacity-limited, not demand-limited, and the capacity is offline for maintenance during the window when the global spread is widest.
The infrastructure pipeline is moving. Federal regulators have begun the environmental review for a proposed 520-mile, 48-inch diameter Desert Southwest Expansion project. Those timelines run years.
Between now and late August, the domestic market absorbs 2.4 Bcf/d of Freeport's nameplate demand that has nowhere to go. Between late August and October, it returns and injection season ends. Between October and March, winter demand meets a storage base that is 6.6% above normal.
The bullish catalysts are all real and they are all queued behind six weeks of surplus.
Downside: $2.75, Then $2.50
The path lower is mechanical rather than technical. Inventories remain around 6% above the five-year average and are still receiving fresh injections. Each time a new injection is reported, it tends to push the price lower unless the build comes in below expectations. The last print missed by 12 Bcf on a 49 Bcf estimate.
That is a market with a weekly bearish catalyst scheduled every Thursday until October.
The immediate levels are the recent structure. $2.87 is the two-month low. Below it, the market has no reference between here and the low $2.70s, and $2.50 is the level where the associated-gas producers that added the 0.2 Bcf/d increment between June and July would start to notice. They would not stop. Associated gas from oil-directed drilling responds to WTI at $79.06, not to Henry Hub at $2.87.
The upside triggers are three and they are dated. First, the Thursday storage report coming in below the estimated 6.6% surplus, which would be the first bullish print of the summer. Second, the cooler Southwest forecast through July 23 flipping back to the warmer-than-normal read that had been projected through July 28. Third, Freeport returning in late August, which restores 1.4 Bcf/d of feedgas demand in a single week.
The first two are noise. The third is a step function and it is six weeks away.
The gap to the forecast is what caps the downside. $3.57 for the fourth quarter and $3.78 for the first quarter of 2027 sit 24.4% and 31.7% above spot, and those are official numbers built on a balance sheet that has demand growing 3% next year against supply falling 1.6 Bcf/d behind it.
$2.87 is not a price. It is a maintenance schedule.
The Forecast: $2.75 Before Freeport Returns, $3.40 by November
The base case is a $2.75 to $3.05 range through late August. Every input holding this market down has a date on it and none of them expire before then. Freeport's two-train turnaround runs to late August, stranding roughly 1.4 Bcf/d of feedgas demand. Production sits at 110.2 Bcf/d and is climbing. Storage holds 6.6% above the five-year average and is expected to stay there. Solar and wind are near record output and taking share from the gas fleet. The weather forecast turned cooler on Tuesday.
That is five bearish inputs and one bullish variable, and the bullish variable is a calendar.
The path lower needs only continuation. Weekly injections above consensus push the contract toward $2.75 and then into the low $2.70s. A 61 Bcf print against a 49 Bcf estimate during the first heatwave of the summer is the template, and the next report lands Thursday covering the week ended July 10, which contains a full week of Freeport's outage.
The path higher is dated rather than conditional. Freeport returns in late August and 1.4 Bcf/d of demand comes back in a single week at the moment injection season is winding toward its October end. The fourth-quarter forecast sits at $3.57, 24.4% above spot, with the first quarter of 2027 at $3.78 and full-year 2027 just under $3.50 as supply growth falls 1.6 Bcf/d behind demand and storage moves below the five-year average.
The structural bid is 2027 and it is credible: electric power consumption at a record 38.1 Bcf/d, a 50.6 Bcf/d monthly record in July 2027, and LNG feedgas drawing down the balance. The structural cap is the same record production that has already forced a $4.60 forecast down to $3.50.
The spread nobody can capture is the tell. JKM at $17.867 and Northwest Europe at $16.045 against Henry Hub at $2.87 is a $15.00 arbitrage sitting idle because two liquefaction trains are in maintenance.
Forecast: $2.75 before Freeport returns, $3.40 by November, with $3.05 the level that invalidates the near-term bear case.





