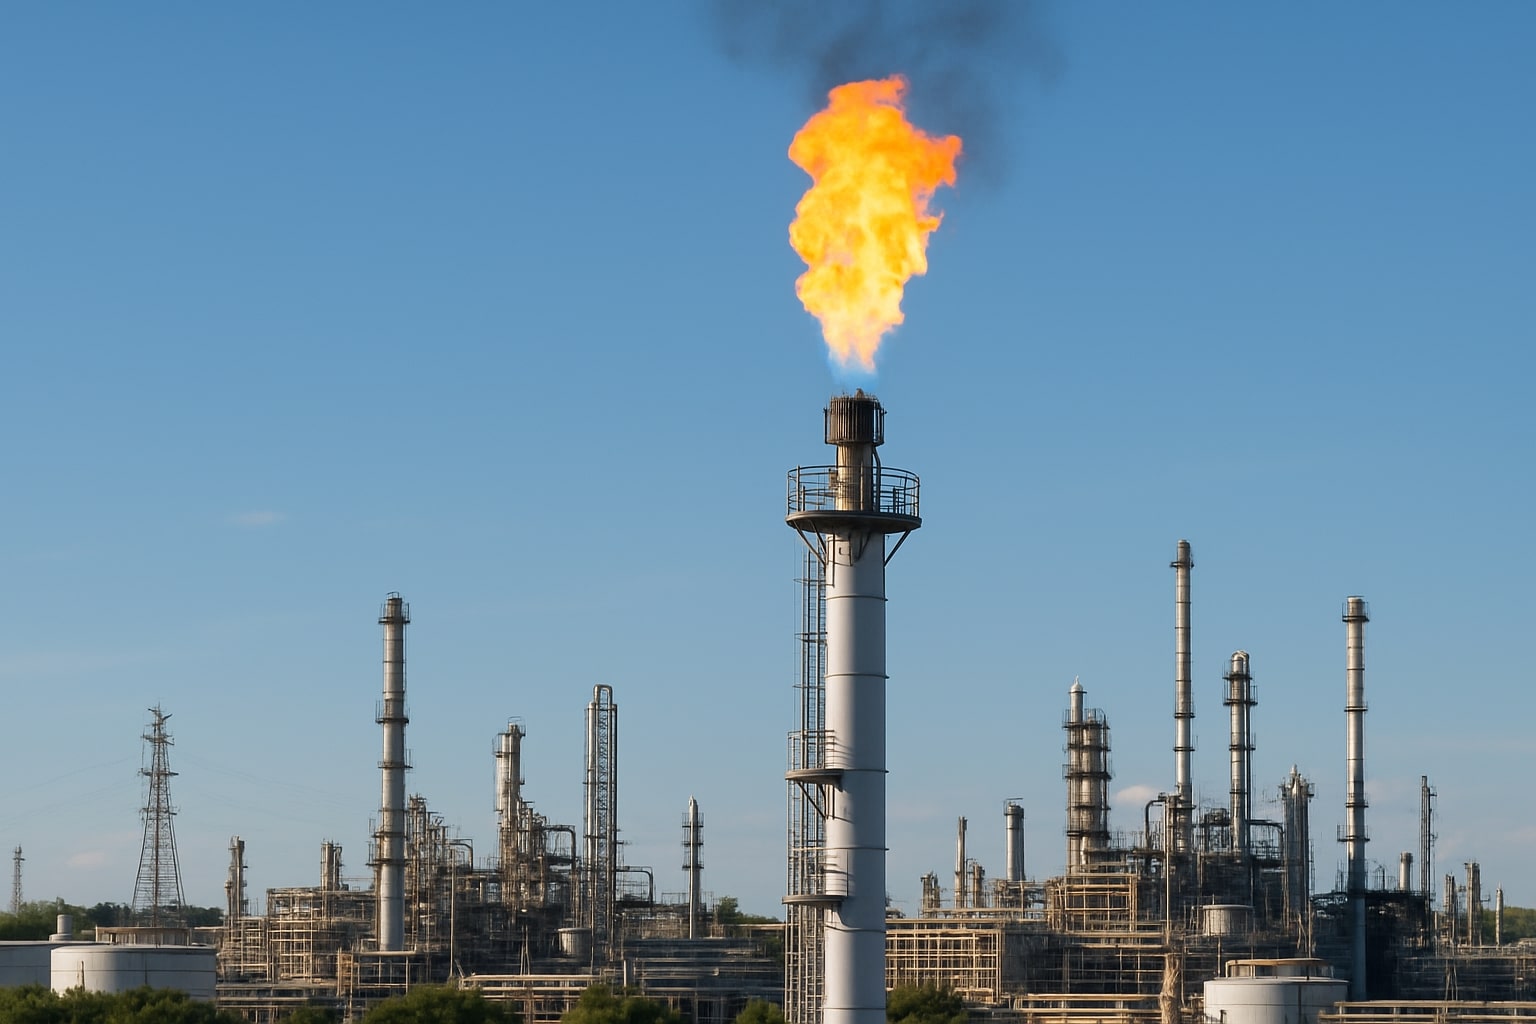
Natural Gas (NG=F) Price Surges Toward $3.66 Breakout as Heat and LNG Disruptions Fuel Rally
With demand topping 109.8 bcfd, LNG exports climbing, and technical resistance under pressure, NG=F eyes $4.76 upside if breakout holds | That's TradingNEWS
Natural Gas (NG=F) Climbs Toward Breakout as Record Heat and LNG Supply Disruptions Roil Market
Natural gas futures (NG=F) are pushing higher, testing the $3.60–$3.66 resistance zone, as extreme weather and tight liquefied natural gas (LNG) balances create a bullish storm for price action. Front-month contracts are now trading at $3.56–$3.59, reaching a two-week high and inching toward a confirmed breakout above a symmetrical triangle pattern formed since March. Traders are increasingly pricing in risk premiums driven by multi-regional heatwaves and growing LNG demand, as pipeline and liquefaction capacity strain under record consumption.
Heatwave Lifts Demand as Spot Prices Explode Across Northeast and Midwest
Demand across the Lower 48 has surged to 109.8 billion cubic feet per day (bcfd), though forecasts for next week expect a slight pullback to 107.5 bcfd. The impact is immediate in regional markets: spot gas in New England surged 61% to $12.50/mmBtu, reflecting both demand spikes and logistical congestion. Meanwhile, Midwest injections led the weekly EIA build, adding 20 Bcf, while East and South Central regions added 12 Bcf and 6 Bcf respectively, though South Central’s salt cavern storage saw a 4 Bcf draw, underscoring the stress on flexible reserves.
Triangle Breakout Nears as NG=F Holds $3.50 Support and Reclaims Fibonacci Levels
Price action on the daily chart shows natural gas recently reclaiming the 0.382 Fibonacci retracement at $3.53, and now testing the 0.5 level at $3.66, which also aligns with the triangle's upper trendline. A close above $3.66 would expose targets at $3.93 and $4.76, derived from the measured move off the triangle’s base. Support rests near $3.40 and $3.38, underpinned by clustered moving averages including the 200-day EMA. Should the breakout fail, $3.15 becomes the likely bearish target.
Supply Remains Near Record, But LNG Flows Face Setbacks From Elba and Freeport
Despite heat-driven demand, supply remains tight but stable, with Lower 48 production averaging 107 bcfd in July, up from June’s 106.4 bcfd record. LNG exports also rose to 15.8 bcfd, rebounding from maintenance dips, yet still under April’s 16.0 bcfd peak. However, outages at Elba Island in Georgia (0.4 bcfd) and the Freeport LNG Train 2 shutdown (Texas) temporarily cut into flows, briefly pulling total feedgas down to 105.2 bcfd. Those disruptions have since eased, though market participants are now watching maintenance schedules more closely as any new disruption could tilt balances further.
Storage Build Meets Forecast, but Underlying Trends Point to Tightening Ahead
The U.S. EIA reported a 46 Bcf build in gas storage for the week ending July 11, matching analyst expectations and lifting total stocks to 3,052 Bcf—a healthy 178 Bcf above the five-year average, but still 156 Bcf below last year’s levels. This suggests storage is in a comfortable position for now, but it masks a deteriorating trend beneath the surface. Power burn rates are up, LNG exports remain high, and injections are increasingly dependent on regional weather and pipeline flexibility. A failure to sustain current build rates into August could flip sentiment fast.
Technical Setup Shows Short-Term Risk, Long-Term Bullish Continuation
While Thursday’s session revealed some resistance near $3.63–$3.65, generating a potential bearish shooting star, the broader weekly chart maintains a bullish tone. Last week’s low bounced near the 50-week MA at $3.27, while the current week has already breached the prior high at $3.47, confirming a weekly reversal setup. The 200-day MA at $3.45 now serves as a key inflection level if short-term weakness continues. A retest of the 20/50-day MAs around $3.54 could act as a springboard, provided macro conditions remain supportive.
Long-Term Contracts Reflect Asymmetry in Forward Curve and Winter Risk Premiums
Futures data reveals a skewed forward curve, with 2026–27 winter contracts trading above the upper quartile, reflecting concern about structural undercapacity in colder months. In contrast, summer 2025 contracts remain near median values but show elevated volatility due to regional weather risk. Recent modeling by LSEG suggests cumulative supply/demand balances are tightening week-over-week, especially in East Central and South Atlantic regions, where HDD+CDD indices are spiking above the top quartile.
Buy, Sell, or Hold NG=F? Bullish Bias Holds With $4.00 in Sight
With NG=F trading at $3.56–$3.59, macro conditions and technical structure support a bullish stance. A decisive break above $3.66 would clear the way for $3.93 and $4.76 in the coming weeks. Storage remains above average, but the demand/supply balance is tightening beneath the surface due to heat-driven power burns, LNG capacity issues, and regional injection strain. Near-term weakness should be viewed as a pullback, not a reversal. Based on current momentum, Natural Gas is a Buy, with technical and seasonal alignment favoring further upside.
That's TradingNEWS
Read More
-
Broadcom Stock Price Forecast: AVGO at $325 Ahead of AI-Driven Earnings
14.02.2026 · TradingNEWS ArchiveStocks
-
XRP Price Forecast: Ripple XRP-USD Climbs Back to $1.47 but $1.80 Wall and Sub-$1 Risk Still Dominate
14.02.2026 · TradingNEWS ArchiveCrypto
-
Oil Prices Forecast - Oil Hold WTI at $63 and Brent at $68 While New Supply and IEA Surplus Weigh on the Market
14.02.2026 · TradingNEWS ArchiveCommodities
-
Stock Market Weekly Recap: S&P 500 Stalls, Nasdaq Leads the Decline, Dow Eases as AMZN, NVDA, AAPL Sell Off
14.02.2026 · TradingNEWS ArchiveMarkets
-
GBP/USD Price Forecast - Pound Stuck at 1.36 as Fed Cut Hopes Clash With UK Weakness
14.02.2026 · TradingNEWS ArchiveForex


