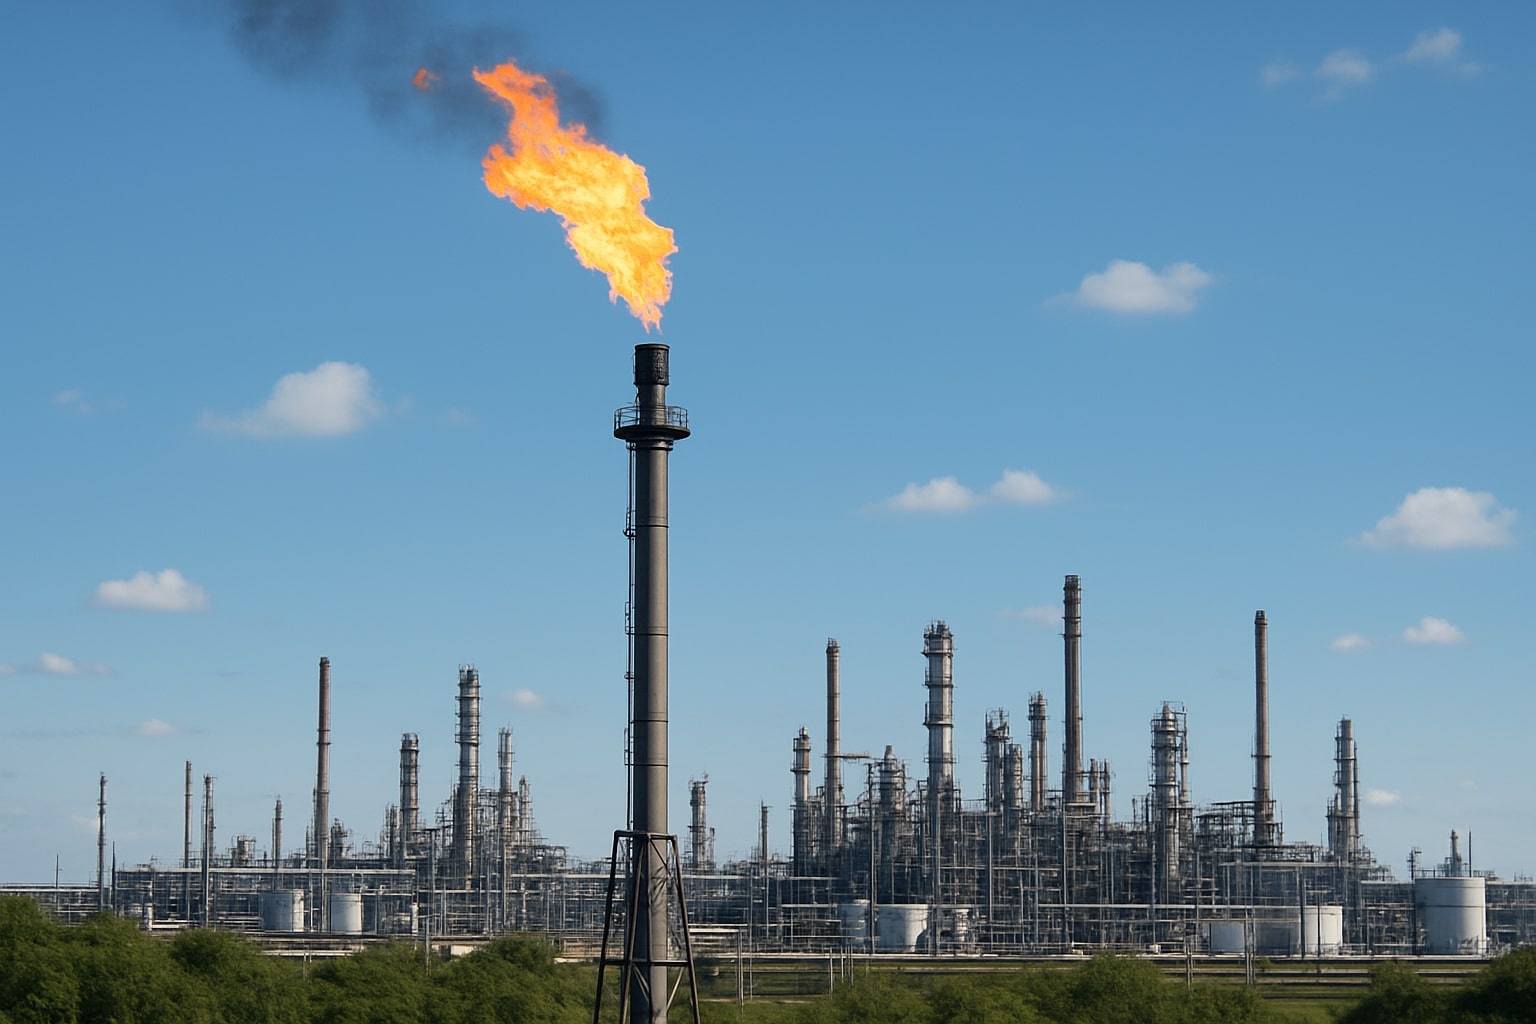
Natural Gas Price Forecast: NG=F Eyes $3.20 as Storage Tightens and LNG Demand Rises
Record U.S. Output, Weather Shifts, and Global LNG Flows Drive Natural Gas Outlook | That's TradingNEWS
Natural Gas Price Forecast: NG=F Rebounds Toward $3.20 as Storage Tightens and Production Surges
Natural Gas Futures Rally After August Selloff
Front-month NG=F futures closed August with a sharp rebound, settling at $2.997 per MMBtu after climbing 1.80% on Friday. Despite the late-month rally, the commodity still logged a 5.73% monthly decline, weighed by cooler weather projections and record output levels. Prices had slumped to a 9.5-month low earlier in the week before short covering and bullish storage data ignited a turnaround. With momentum shifting, traders are closely monitoring whether the rebound has legs to clear the next major resistance zone between $3.238 and $3.300.
EIA Storage Data and Inventory Trends
The latest EIA report provided a critical spark for bulls. U.S. inventories rose only +18 bcf for the week ending August 22, well below expectations for a +27 bcf build and far under the five-year average of +38 bcf. Current storage sits 3.5% below last year’s levels, though still 5% above the five-year seasonal norm. This tighter-than-expected build signaled stronger demand absorption and underpinned the futures rally. In Europe, gas storage levels are 77% full, below the seasonal average of 84%, tightening global balances further ahead of peak heating demand.
Production Strength Remains a Headwind
While storage draws support prices, U.S. output continues to flood the market. Dry gas production hit 107.4 bcf/day, a 3.8% year-over-year increase, keeping supply near record highs. LNG feedgas flows softened slightly to 15.6 bcf/day, down 1.9% week-over-week, while lower-48 demand slid 11.9% year-over-year to 71.7 bcf/day. Baker Hughes data shows 122 active gas rigs, just below a two-year high, highlighting the persistent oversupply pressure despite recent declines. The EIA lifted its production outlook for 2025 to 106.44 bcf/day, with a further rise projected in 2026 to 106.09 bcf/day.
Technical Outlook: $3.15–$3.19 Zone in Focus
The market’s technical structure has improved. Natural gas futures reclaimed the 20-Day Moving Average at $2.89 and the AVWAP level near $2.96, turning prior resistance into support. A breakout from a falling wedge pattern added bullish momentum, and the weekly chart is on track to confirm a bullish engulfing candle. The channel midpoint at $2.92 held on recent pullbacks, reinforcing trend strength. Near term, the $3.15–$3.19 range is the immediate target, aligning with both wedge breakout projections and the 50-Day Moving Average at $3.18. A decisive close above $3.238 would mark a structural breakout, opening upside toward $3.40 and beyond.
Seasonal Weather Risks and Demand Dynamics
Weather remains the key swing factor. Forecasts project early-autumn coolness across the eastern U.S., reducing late-summer air-conditioning demand, while the West braces for hotter-than-normal conditions. The NOAA continues to flag 80% probability of above-average heatwaves in the Carolinas and Virginia, implying stronger regional power burn. In July, U.S. power sector demand surged to 49.1 bcfd, setting records in Texas and Louisiana. Meanwhile, Edison Electric Institute data shows U.S. electricity output rose 7.7% y/y in the week ending August 23 and 3.1% y/y over the trailing 52 weeks, underscoring the growing linkage between power demand and gas consumption.
Global LNG Expansion Tightens Balances
Beyond near-term volatility, the long-term structure remains bullish. IEA forecasts project global gas demand rising 2% annually through 2050, with LNG as the primary growth driver. U.S. exports are expected to expand to 16 bcf/day by 2026, led by major projects like Plaquemines LNG and Corpus Christi Stage 3, which will pull more gas from domestic balances. European LNG imports are forecast to climb 25% in 2025, offsetting Russian pipeline cuts. This structural demand expansion positions NG=F for a sustained upward repricing, especially if U.S. production growth slows from geological or regulatory constraints.
Volatility Compression and Market Tone
Price volatility has eased, with Henry Hub historical volatility falling from 81% in Q4 2024 to 69% by mid-2025, reflecting normalized seasonal patterns and balanced inventories. Yet the decline in volatility masks the risk of sharp weather-driven spikes. The market remains in a fragile balance, where minor shifts in LNG flows, storage builds, or weather-driven demand could quickly trigger double-digit price swings. Investors are navigating a dual narrative: near-term caution tied to high production and cooler forecasts, versus long-term optimism built on LNG, industrial adoption, and power sector demand.
Final Outlook on NG=F
With NG=F at $2.997, the immediate technical battle is clear. Support holds at $2.92, while resistance tightens near $3.19–$3.238. A breakout opens upside toward $3.40 and $3.65, while a failure exposes downside risk back to $2.74. Fundamentally, tightening storage builds and LNG expansion argue for sustained bullishness into 2026, but record U.S. output remains the dominant headwind. Based on current conditions, natural gas leans cautiously bullish with a Buy bias, contingent on holding above $2.92 and breaking through the $3.238 ceiling.
That's TradingNEWS
Read More
-
IVV ETF Price Forecast: Is $684 Still Worth Paying For S&P 500 Exposure?
14.02.2026 · TradingNEWS ArchiveStocks
-
XRP ETF Rally: XRPI at $8.09 and XRPR at $11.60 as XRP-USD Rebounds Toward $1.47
14.02.2026 · TradingNEWS ArchiveCrypto
-
Natural Gas Futures Price Holds Around $3.20 as Storage Tightens and Winter Premium Fades
14.02.2026 · TradingNEWS ArchiveCommodities
-
USD/JPY Price Forecast: Yen Strength Turns 152 into a Make-or-Break Level
14.02.2026 · TradingNEWS ArchiveForex


