NYSEARCA:VO ETF – Can Mid-Caps Outperform Large Caps in 2025?
VO’s 14% rally beats the S&P 500, but will rate cuts and GDP growth push it to new highs? Is $260 support strong enough to hold, or should investors expect a deeper pullback? | That's TradingNEWS
NYSEARCA:VO – Can Mid-Caps Outperform Large Caps in 2025?
VO's Strength in a Shifting Market
Vanguard Mid-Cap Index Fund ETF (NYSEARCA:VO) has surged nearly 14% over the last year, comfortably outpacing the S&P 500’s 10.1% return. With a low expense ratio of just 0.04% and a diversified portfolio of mid-cap stocks, VO remains one of the strongest plays in the mid-cap space. Investors are now questioning whether its momentum can continue as mid-cap stocks historically thrive in periods of economic expansion.
With the U.S. GDP forecasted to grow by 2.7% in 2025 and nearly 3% in subsequent years, mid-cap stocks like those held in VO are positioned to benefit from stronger corporate earnings. However, interest rate uncertainty remains a key risk, with the Federal Reserve holding off on rate cuts that were previously expected to begin in early 2025. The question remains: will VO push beyond its key resistance near $275, or is a correction looming?
How NYSEARCA:VO Compares to Other Mid-Cap ETFs
VO tracks the CRSP US Mid Cap Index, providing exposure to approximately 320 stocks across various sectors. Unlike the S&P MidCap 400, which focuses solely on companies outside the S&P 500, VO includes mid-caps from both the S&P 500 and S&P MidCap 400. This gives it a unique balance of established and emerging mid-sized companies.
Compared to its peers, VO has outperformed in both total return and expense efficiency. While SPDR S&P MidCap 400 ETF (MDY) posted a 12.2% return over the past year, VO has delivered nearly 17% in total returns. Other mid-cap ETFs like Schwab U.S. Mid-Cap ETF (SCHM) and Invesco S&P MidCap Quality ETF (XMHQ) have struggled to keep up with VO’s momentum. Additionally, VO’s expense ratio of 0.04% is significantly lower than MDY’s 0.24% and XMHQ’s 0.25%, making it one of the most cost-effective ways to invest in mid-caps.
Sector and Stock Exposure – A Diverse Mid-Cap Powerhouse
VO's portfolio is well-diversified across 11 sectors, with technology, industrials, and financials accounting for roughly 50% of its holdings. These three sectors are particularly important because they tend to drive earnings growth during economic expansion.
VO’s top holdings include high-performing stocks such as Constellation Energy Corp (CEG), Amphenol Corp (APH), Welltower (WELL), Palantir Technologies (PLTR), and Motorola Solutions (MSI). Notably, Constellation Energy surged 112% over the last 12 months due to rising demand for AI-driven data centers, while Palantir exploded 345% as its AI-based security solutions gained widespread adoption.
The ETF’s ability to rebalance its portfolio quarterly ensures it can continue to capitalize on emerging mid-cap winners while trimming underperforming positions. This active rebalancing provides an edge over static mid-cap ETFs, as it allows VO to consistently hold a high concentration of top-performing companies.
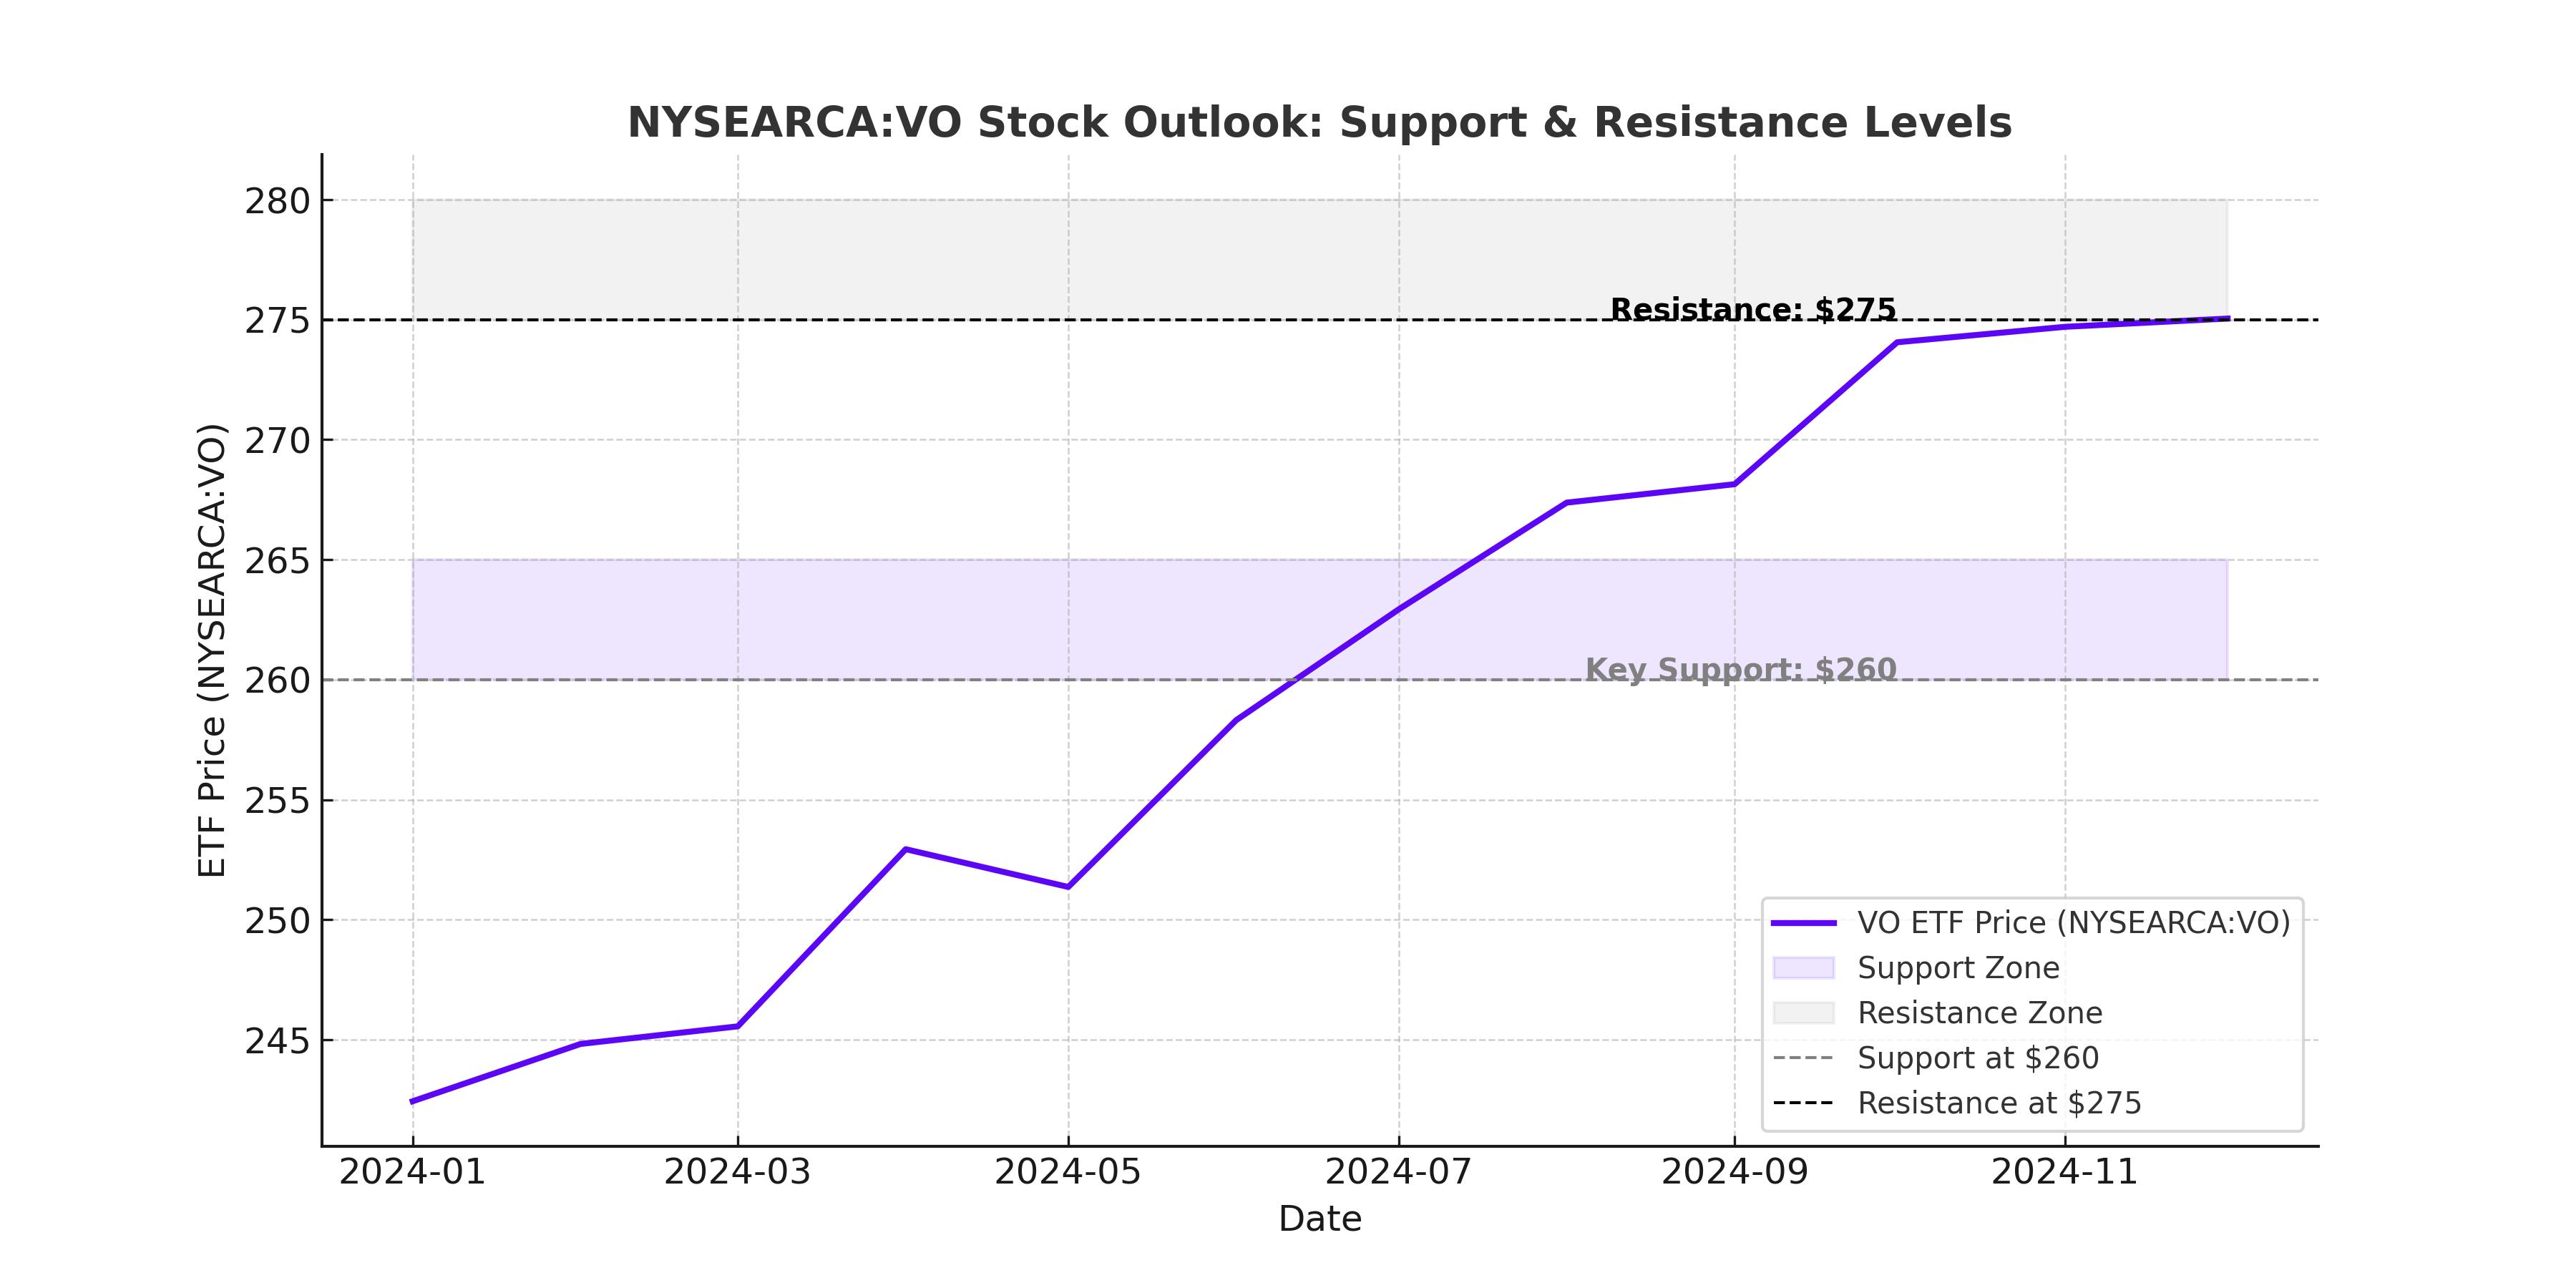
Can NYSEARCA:VO Hold Key Support at $260?
VO has been in a strong uptrend since late 2023, gaining over 40% in the past 16 months. However, technical signals suggest potential volatility ahead. The ETF is currently trading near a critical support level of $260, which aligns with both its 200-day moving average and previous resistance from 2021.
Momentum indicators, such as the Relative Strength Index (RSI), have cooled off from their late-2024 highs, signaling that VO may need to consolidate before its next move higher. If the ETF fails to hold $260, a deeper correction could follow, potentially bringing it down to the $250 range. On the flip side, if economic data remains strong and interest rate cuts materialize later in the year, VO could quickly rebound toward its recent highs above $275.
Valuation – Is VO Still a Good Buy?
Despite its recent rally, VO remains attractively valued compared to large-cap stocks. The ETF currently trades at a price-to-earnings (P/E) ratio of 19.3x, which is lower than the S&P 500’s 22x multiple. Additionally, VO’s holdings boast an average earnings growth rate of 13%, outpacing the broader mid-cap market’s 11% growth.
From a dividend perspective, VO’s trailing 12-month yield of 1.46% is slightly higher than the S&P 500, making it an appealing choice for investors looking for both capital appreciation and steady income.
Risks – What Could Go Wrong for VO?
While VO has shown strong performance, there are key risks investors should consider. Mid-caps tend to be more volatile than large caps, meaning any market downturn could result in sharper declines for VO. Additionally, Federal Reserve policy remains a wildcard—if inflation remains sticky and rate cuts are delayed, mid-caps could struggle as borrowing costs remain high.
Another risk is increased competition from large-cap stocks. While mid-caps historically outperform during periods of strong economic growth, investors may be drawn back to mega-cap stocks if volatility rises or if earnings disappoint.
Final Take – Is NYSEARCA:VO a Buy, Hold, or Sell?
With its strong momentum, diversified portfolio, and low expense ratio, NYSEARCA:VO remains one of the best mid-cap ETFs available. While short-term volatility is possible, long-term investors should view any pullbacks as buying opportunities.
If VO holds above $260 and economic data continues to improve, the ETF could break past $275 and test new highs. However, if mid-caps face renewed selling pressure, a retest of the $250 level could be in play.
Given its combination of earnings growth, valuation, and sector exposure, VO remains a buy for investors looking to capitalize on the mid-cap rally heading into 2025.
That's TradingNEWS
Read More
-
The Dividend ETF That Doesn't Act Like One — FDVV Rides Nvidia and Apple to a 20.5% Year and Nears Record Highs
06.07.2026 · TradingNEWS ArchiveStocks
-
XRP's ETFs Are Locking Away Supply Relentlessly — XRPI and XRPR Hold Their Floors as $1.44B in Inflows Await the Catalyst the Price Needs
06.07.2026 · TradingNEWS ArchiveCrypto
-
Heat vs. Supply Keeps Gas Pinned at $3.21 — A 100-Degree Heat Wave and Record LNG Flows Battle a 110 Bcf/d Production Flood
06.07.2026 · TradingNEWS ArchiveCommodities
-
The Yen Grinds to 40-Year Lows as the Carry Trade Overpowers Japan's Warnings — USD/JPY at ¥162 With Goldman Betting on More Upside
06.07.2026 · TradingNEWS ArchiveForex