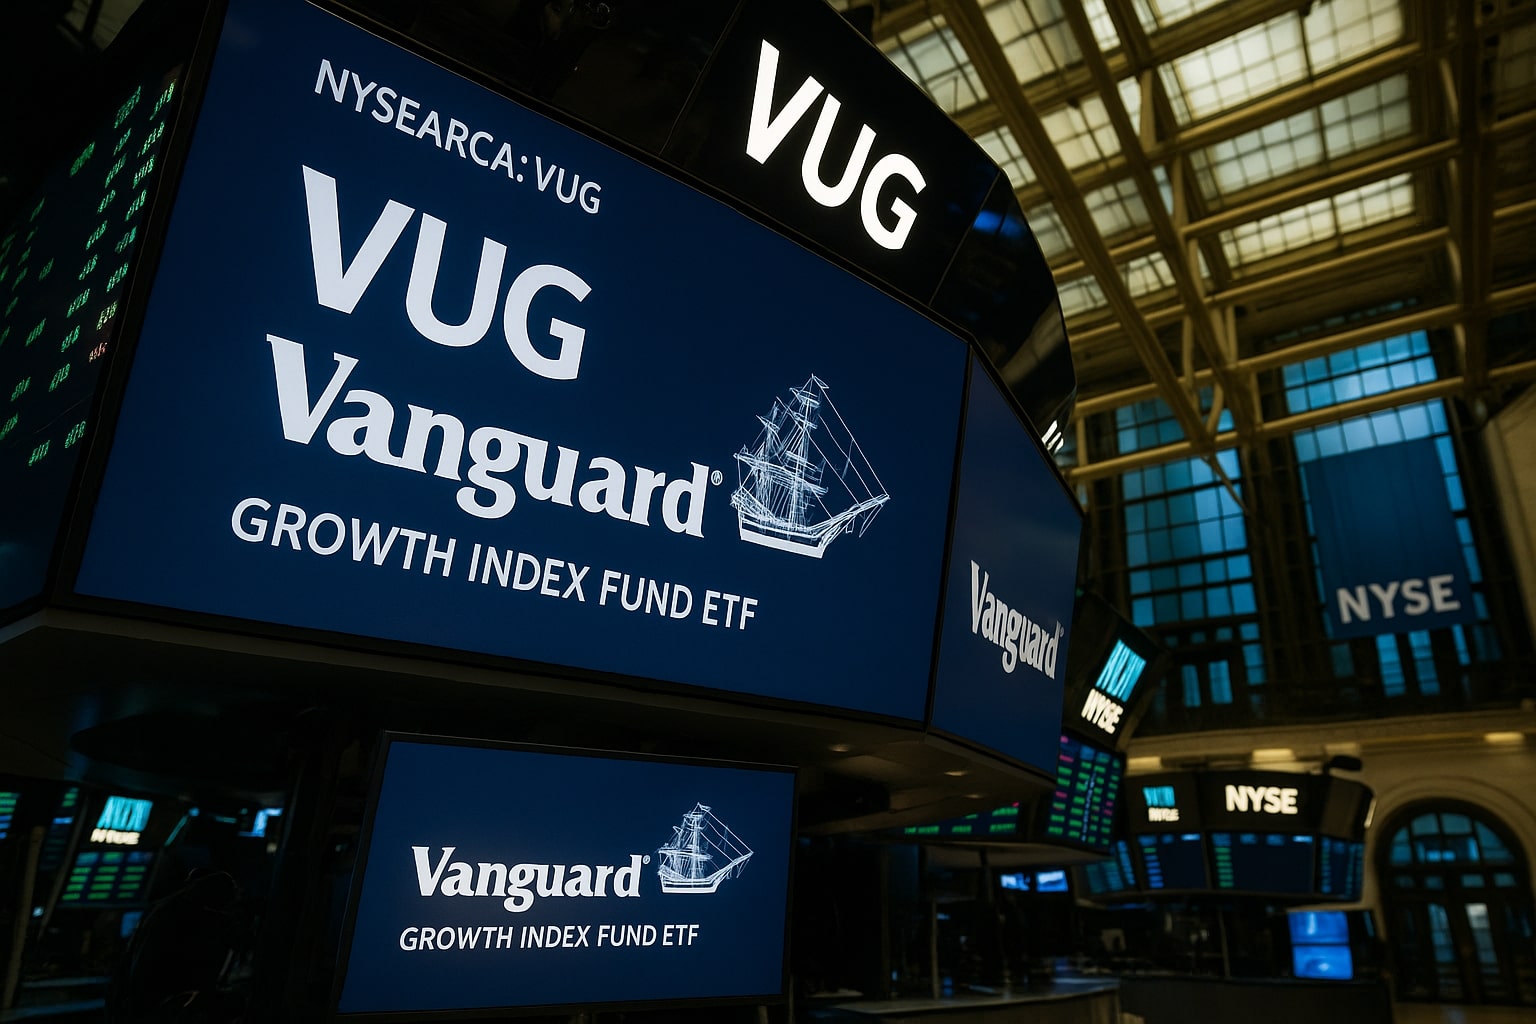
NYSEARCA:VUG ETF Near Record Highs at $460 as Mega Cap Growth Leads
AI earnings, cloud expansion, and Fed policy tailwinds keep VUG outperforming with 21.7% annual gains | That's TradingNEWS
NYSEARCA:VUG ETF Near Highs as Mega Cap Growth Drives Market Leadership
The Vanguard Growth Index Fund ETF Shares (NYSEARCA:VUG) has established itself as one of the strongest expressions of U.S. large-cap growth momentum, with shares closing at $460.15 and extending slightly higher to $460.56 in after-hours trading. The ETF is trading just below its 52-week peak of $465.63, far removed from its yearly low of $316.14, underscoring how aggressively growth stocks have recovered since the correction earlier this year. With net assets of $324.3 billion, a 0.04% expense ratio, and daily volumes averaging nearly one million shares, VUG is not just liquid—it is the anchor product for institutions seeking broad yet concentrated exposure to growth equities. Its YTD return of 11.77% continues to outpace the large growth category at 9.81%, while its one-year total return of 21.73% adds to a decade-long streak of dominance.
Mega Cap Technology and AI Spending Are the Core of NYSEARCA:VUG
VUG’s structure magnifies the influence of mega cap technology, communications, and consumer cyclical names. Collectively, these sectors make up 78% of portfolio allocation, while the top 10 holdings represent 61% of assets. These names—Apple (AAPL), Microsoft (MSFT), Alphabet (GOOGL), Amazon (AMZN), Meta Platforms (META), Nvidia (NVDA), Tesla (TSLA), Broadcom (AVGO), and Netflix (NFLX)—are the same companies generating historic revenue and earnings beats this cycle.
Nvidia’s (NVDA) AI chip revenue has grown by 46% year-on-year, with earnings per share projected to surge nearly 50% in 2025 as hyperscaler demand intensifies. Microsoft’s cloud business grew 23% to $168 billion annually, driven by 34% Azure growth to $75 billion, directly fueling its dominance within VUG’s portfolio. Alphabet lifted its CapEx to $85 billion as it scales AI infrastructure, a move echoed by Meta, which continues to invest aggressively in AI-driven advertising models and new platforms. Broadcom (AVGO) saw AI chip revenue explode, and Amazon’s AWS remains a critical driver of corporate IT spending. Each of these results feeds directly into VUG’s NAV, explaining why the ETF trades near all-time highs even as broader markets oscillate on macro headlines.
Earnings Power Is the Backbone of VUG’s Performance
VUG’s consistent outperformance is underpinned by earnings, not speculation. In Q1 2025, S&P 500 earnings rose 13% versus expectations of 9%, and in Q2, they jumped 11.8% compared to forecasts of 4.9%. Those beats came primarily from technology and communications—the exact sectors where VUG is most overweight. The ETF’s history reinforces this. After a brutal -33.15% collapse in 2022, VUG rebounded with +46.83% in 2023 and +32.69% in 2024. Over five years, the fund has compounded at 16.6% annually, while over ten years it delivered 16.25% CAGR, handily ahead of the large growth peer average of 14.23%. The pattern is clear: when growth companies deliver profits above consensus, VUG outpaces every other major growth ETF.
Valuations Elevated but Supported by Fundamentals
At a P/E of 38.25, VUG trades at a premium, but that multiple is sustained by 30%+ aggregate earnings growth across its heaviest allocations. By comparison, the S&P 500’s forward P/E sits at 22x, down from 22.7x, while VUG’s concentration in higher-growth names means it maintains valuation headroom so long as quarterly results keep exceeding expectations. Information technology—the largest sector in VUG—has forecast earnings growth near 20% in 2026, ensuring that elevated multiples are not detached from reality. The ETF’s beta of 1.14 highlights its higher sensitivity to market swings, but that volatility has consistently translated into superior long-term compounding.
Monetary Policy as a Tailwind for Growth Allocation
Growth ETFs like VUG thrive when liquidity conditions ease, and current monetary policy positioning heavily favors growth allocations. Futures markets signal an 85% probability of a September Fed rate cut, with additional cuts expected through 2026. A dovish Fed compresses discount rates, directly supporting the forward valuations of growth-heavy companies that dominate VUG. On the macro side, U.S. GDP grew nearly 3% in Q2 2025, with forecasts of 2.3% in Q3, keeping recession risks muted. This backdrop supports continued strength in AI and cloud spending, meaning earnings upgrades could persist, giving VUG further upside even at its elevated price levels.
Comparisons with Peer Growth ETFs
When stacked against peers, VUG’s edge is clear. iShares Russell 1000 Growth ETF (IWF) and SPDR S&P 500 Growth ETF (SPYG) share similar mandates but lack the sheer scale and liquidity of VUG. With net assets over $324 billion, VUG is larger than most rivals combined. Its three-year return of 22.03% annually outpaces IWF’s 21.2% and SPYG’s 20.7%, showing its concentration in mega cap technology has delivered measurable alpha. Combined with its industry-low 0.04% expense ratio, investors are effectively accessing elite growth names at virtually no cost.
Risks Facing NYSEARCA:VUG
The ETF’s greatest strength—its concentration—is also its vulnerability. With over 60% of assets in just 10 names, any setback in mega cap tech would hit VUG disproportionately. A regulatory crackdown on Alphabet or Meta, delays in AI monetization, or global supply chain shocks could create drawdowns similar to the 26% correction in April 2025, when tariff fears sent growth stocks tumbling. Valuations near 38x earnings also leave limited room for disappointment. A single earnings miss from Nvidia or Microsoft could shave billions off VUG’s NAV. Still, history shows that corrections in growth-heavy ETFs like VUG have been followed by outsized rebounds when fundamentals reassert themselves.
NYSEARCA:VUG ETF Outlook
With shares at $460.15 and flirting with their all-time highs, VUG reflects both the confidence and concentration of modern equity markets. Its 21.7% one-year return, 22.03% three-year CAGR, and 16.6% five-year CAGR illustrate a pattern of sustained outperformance. AI adoption is still in its early innings, cloud revenue growth remains double-digit, and corporate CapEx is accelerating, all of which flow directly through to VUG’s top holdings. Fed policy is now aligning with growth, and economic resilience adds further stability to earnings.
The ETF’s low cost, immense liquidity, and concentration in the world’s most powerful technology companies make it the defining growth allocation for long-term investors. Trading just below its record, VUG has realistic upside to the $500–$506 range within twelve months if current earnings momentum holds. The ETF is not without risk, but its structural advantage means that for investors seeking exposure to the core of U.S. growth leadership, VUG remains a Buy at current levels.
That's TradingNEWS
Read More
-
GPIQ ETF Price Forecast: Can a 10% Yield at $52 Survive the Next Nasdaq Selloff?
09.02.2026 · TradingNEWS ArchiveStocks
-
XRP ETF Price Forecast: XRPI at $8.32, XRPR at $11.86 as $44.95M Inflows Defy BTC and ETH Outflows
09.02.2026 · TradingNEWS ArchiveCrypto
-
Natural Gas Futures Price Forecast: Will The $3.00 Floor Hold After The $7 Winter Spike?
09.02.2026 · TradingNEWS ArchiveCommodities
-
Stock Market Today: Dow Back Under 50K While S&P 500 and Nasdaq Push Higher as Gold Reclaims $5,000
09.02.2026 · TradingNEWS ArchiveMarkets
-
USD/JPY Price Forecast: Can Bulls Clear 157.5 Without Triggering a 160 Intervention Line?
09.02.2026 · TradingNEWS ArchiveForex


