Oil Price Forecast: WTI Crashes Below $91 and Brent Breaks $100 as Iran Peace Framework Triggers Largest Crude Unwind in Months
CL=F drops 6.55% to $90.25 and BZ=F slides 6.69% as Strait of Hormuz reopening hopes meet a market still at tank bottoms | That's TradingNEWS
Key Points
- WTI fell 6.55% to $90.25 and Brent dropped 6.69% to $95.35 after Trump confirmed Iran deal framework with Hormuz reopen.
- Brent still sits $25 above the $70 pre-war level with 14M barrels per day blocked at the May peak per IEA data.
- Physical normalization will take quarters to years, with tank bottoms in Asia and Europe limiting downside even on a deal.
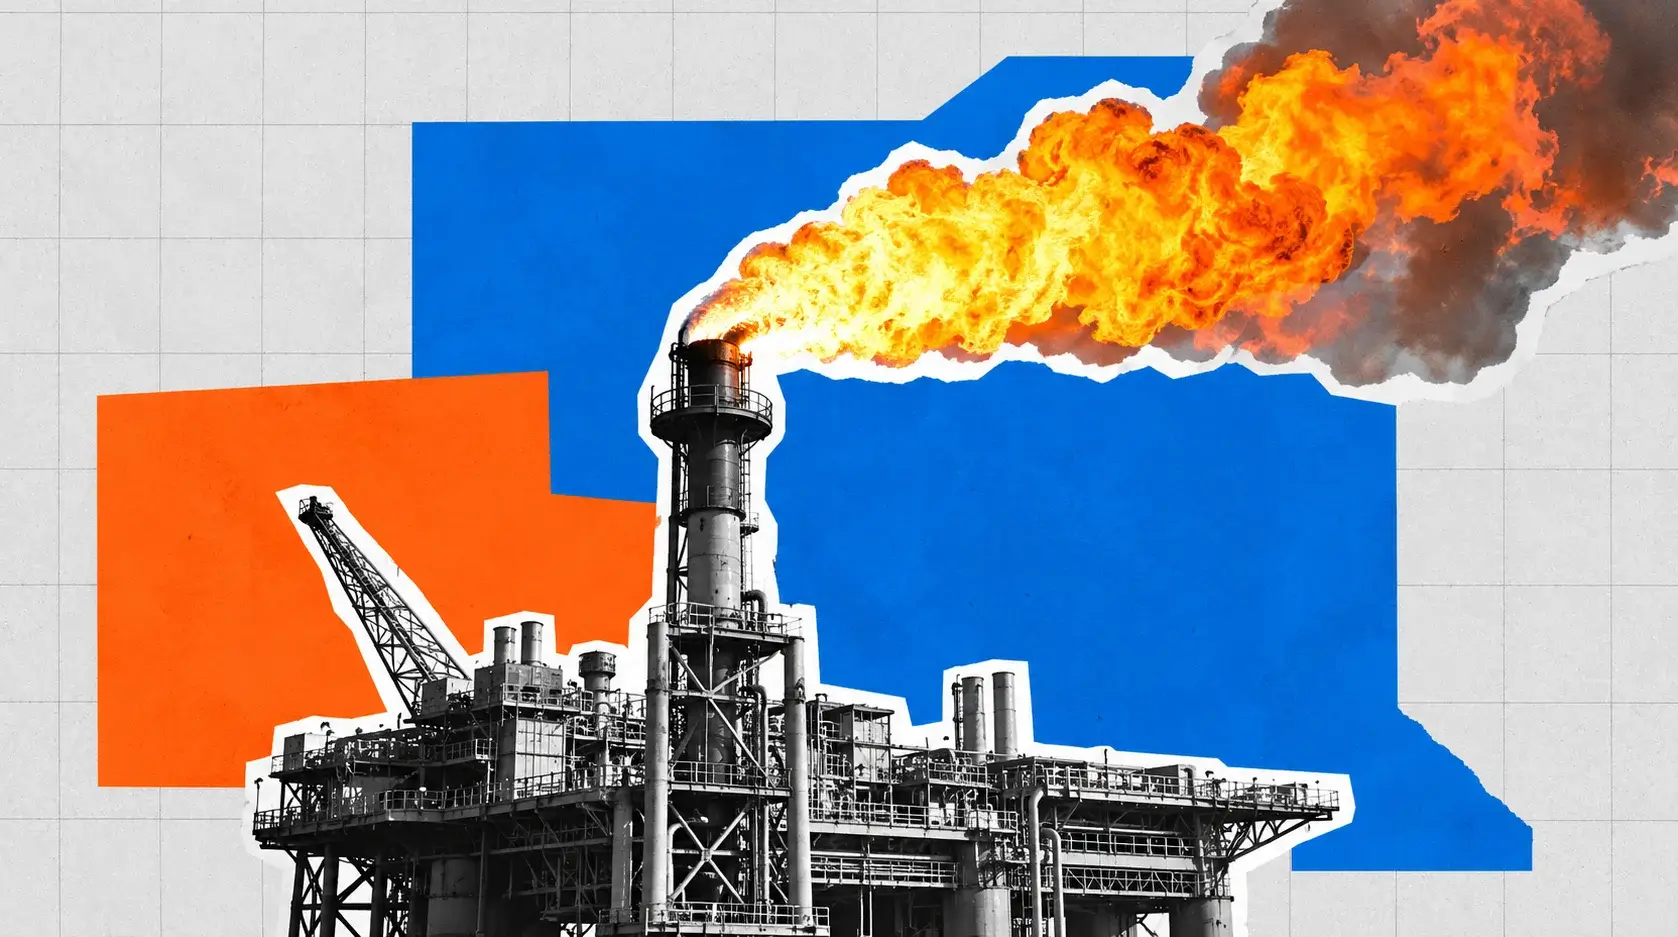
The energy complex just delivered one of the most aggressive single-session repricings of 2026, with West Texas Intermediate (CL=F) collapsing 6.55% to $90.25 per barrel and Brent crude (BZ=F) sliding 6.69% to roughly $95-$97 per barrel as markets aggressively unwound the geopolitical risk premium that had been baked into the strip since the U.S.-Israel-Iran conflict erupted on February 28. The intraday low on WTI futures touched $90.95 around 7:35 a.m. ET, with Brent printing $97.43 in European hours and trading near $97.70 in the afternoon before settling slightly higher into the U.S. holiday close. The catalyst is unambiguous. Donald Trump's weekend confirmation that a peace agreement with Iran has been "largely negotiated" combined with Marco Rubio's "pretty solid thing on the table" language and the prospect of a 60-day ceasefire extension that would include the reopening of the Strait of Hormuz has triggered the most aggressive unwind of crude length in months. The honest read on the move is that this is the textbook configuration of paper-market positioning unwinding faster than the physical market can confirm — the same setup that has produced two prior false breakdowns since March, each of which ended in violent retracements higher when the negotiation stalled. Whether this iteration of the peace trade marks the genuine inflection or another Charlie Brown and the football moment is the question that defines every level on the chart from $90 down to $80 and from $95 back up to $126.
The Magnitude of the Move Captures How Much Premium Was Sitting in the Curve
The decisive way to frame the size of the WTI and Brent repricing is against where prices were before the conflict began. Brent traded at roughly $70 per barrel in late February ahead of the U.S. and Israeli strikes that opened the war. At Monday's print near $95-$97, the global benchmark still carries a structural premium of approximately $25-$27 per barrel versus pre-war levels, which means that even after a 6%-plus single-session drop, the market is still pricing meaningful unresolved supply risk. Prices spiked more than 30% from the conflict's onset, with Brent topping $126 per barrel on April 30 at the peak of the disruption when Iran's effective blockade of the Strait of Hormuz combined with the U.S. counter-blockade of Iranian ports to produce the largest supply disruption in history. The cumulative damage to U.S. crude inventories has been historic. The International Energy Agency's May 2026 oil market report quantified the conflict as blocking roughly 14 million barrels per day of oil flow at its mid-May peak, which is approximately 14% of global daily oil consumption. Saudi Arabia and the United Arab Emirates have aggressively ramped use of their pipeline networks that bypass the strait, but the incremental volumes those pipelines can carry are nowhere near sufficient to offset what normally transits the narrow waterway, which handles approximately a fourth of global maritime oil trade and a fifth of liquefied natural gas trade.
WTI Versus Brent and the Spread That Tells the Real Story
The spread between West Texas Intermediate (CL=F) and Brent crude (BZ=F) has compressed in a way that reflects the asymmetric supply impact of the conflict. WTI at $90.25 versus Brent at roughly $95.35-$97.60 puts the spread at approximately $5-$7 per barrel, which is wider than the historical norm but tighter than where it traded at the conflict's peak when physical supply tightness in the Atlantic basin pushed Brent's premium above $9 on multiple sessions. The reason the spread matters is that WTI prices the marginal North American barrel that does not transit Hormuz, while Brent prices the international barrel that absolutely does. A confirmed reopening of the strait would compress Brent's premium more aggressively than it weighs on WTI, because the marginal supply shock has been disproportionately international rather than North American. The current spread compression is consistent with the market beginning to price exactly that outcome, although the residual premium tells you the physical reality has not yet caught up with the diplomatic optimism. U.S. crude lost more than 8% last week and Brent dropped more than 5%, capturing the cumulative magnitude of the unwind across the two assets and confirming that the speculative repositioning is happening across the entire complex rather than in a single benchmark.
The Physical Reality Is Lagging the Headline Tape and That Matters
The structural problem with the current rally in equities and the current selloff in WTI and Brent is that the headline negotiation pace is running ahead of the physical normalization timeline by an enormous margin. Lars Jensen of Vespucci Maritime flagged that even with a deal announcement on Monday, the shipping industry would remain "very cautious and hesitant" and that vessels currently stuck in the Persian Gulf would prioritize getting out rather than committing fresh transits back in. ClearView Energy Partners quantified the timeline more precisely, noting that de-mining the Strait, evacuating trapped tankers, and restarting production could take weeks to months, while repairing damaged facilities, restoring pre-war output levels, and restocking depleted inventories could take multiple calendar quarters to years. Saul Kavonic of MST Financial said that "even in the most optimistic scenario, oil markets will remain tight through 2027" given the time required to normalize oil flows through the strait, repair damaged facilities, and rebuild global oil stocks that have seen record depletion since the war began. That math is critical for handicapping where Brent and WTI can realistically trade over the next three to six months. The headline scenario that delivers an immediate full normalization of flows is not on the table even if the diplomatic deal lands tomorrow.
Physical Tankers Are Now Moving and That Is the Tell Worth Watching
The single most actionable data point on the supply side is the actual movement of vessels. Two tankers carrying liquefied natural gas were exiting the strait on Monday, heading to Pakistan and China. A supertanker carrying Iraqi crude left the Gulf bound for China on Saturday after being stranded for almost three months. That is the first signal that physical tanker traffic is beginning to resume in a more substantive way than the trickle that had been moving through the strait under Iranian permission since March. UBS analyst Giovanni Staunovo captured the framing exactly when he said "the key factors for the oil market to watch should be the physical oil flows, and so far flows through the strait remain restricted." That is the standard against which every subsequent headline needs to be measured. If physical flows accelerate meaningfully through the week and tanker counts entering the strait climb back toward pre-war levels, the WTI and Brent repricing lower has legs that extend well below the current Monday print. If flows remain restricted despite the diplomatic noise, the move lower is almost certainly going to retrace.
The Curve Structure and What Backwardation or Contango Are Signaling
The futures curve on WTI and Brent has been in deep backwardation since the conflict began, reflecting both the physical tightness and the speculative front-end bid that accompanied the disruption. Backwardation is the configuration where front-month contracts trade at a premium to deferred contracts, which is the textbook signal of physical scarcity rather than financial speculation. The current selloff in front-month Brent is starting to flatten the curve in the front end, which is consistent with traders beginning to price a return to more normal supply conditions rather than the acute scarcity that has defined the past three months. If the curve flattens further toward contango, that will be the cleanest signal that the market is committing to the bearish path. A persistent backwardation in the front three months despite the headline-driven selloff would signal that the physical market is not buying the diplomatic narrative, and that the rally lower in WTI and Brent is being driven more by paper unwind than by fundamental supply normalization. The Dollar Index at 95.64, down 0.29% combined with the cross-asset move into gold up 1.46% to $4,574 confirms that the broader complex is reading the Iran headlines as a risk-on signal that compresses the dollar's haven bid, which should support oil prices marginally on a cross-asset basis but is being overwhelmed by the supply-side optimism.
Inventory Data and the Record Depletion That Cannot Be Ignored
The structural problem with calling an outright bearish path on WTI and Brent comes back to inventories. Global crude oil inventories have been depleting at a record pace since the conflict began. Jeff Currie has flagged that the oil market is at "tank bottoms" in Asia, and Europe isn't far behind. That language captures something specific. When inventory levels approach the operational minimum needed to keep refineries running and pipelines flowing, the price elasticity of supply collapses. Even small additional supply disruptions or demand surprises produce outsized price moves because there is no buffer left to absorb them. The current depletion has occurred across OECD commercial stocks, Asian strategic petroleum reserves, and European refined product inventories simultaneously, which means the system as a whole has no slack. A reopening of the strait does not immediately solve that problem. Inventories have to physically rebuild, refiners have to ramp throughput, and shipping networks have to restore route capacity. None of those happens in a week. None of them happens in a month. Multiple calendar quarters to years, in ClearView's language. The bearish case on WTI and Brent therefore has to clear an enormously high physical hurdle before the move below $90 becomes structural rather than tactical.
Demand Side and the Refinery Cracks That Are Doing Real Work
The demand side of the WTI and Brent equation has been one of the under-discussed reasons that prices held above $100 Brent through most of the conflict. Refinery runs in Asia continued at near-record utilization through April and May despite the supply tightness, with Indian refiners in particular aggressively building product inventories ahead of the summer driving season. Chinese demand recovery through Q1 and Q2 of 2026 has been a structural tailwind for global crude even as the Iran conflict provided the headline driver. Crack spreads — the margins between crude prices and refined product prices — have stayed elevated through the conflict because diesel and gasoline supply chains have been disproportionately affected by the strait closure. U.S. gasoline pump prices remain approximately $1.50 per gallon above pre-war levels, with GasBuddy's Patrick De Haan noting that "the national average price of gasoline will likely remain well above $4/gal" even as oil prices begin to fall, until a signed agreement combined with significant ship transits through the strait actually materializes. That delayed pass-through from crude prices to pump prices is one of the reasons the political pressure for a deal has built so aggressively in recent weeks, and it is also one of the reasons that any actual de-escalation could produce a more sustained selloff in front-month crude futures than the headline moves alone would suggest.
The OPEC+ Discipline Question and What Compliance Actually Looks Like
The OPEC+ production picture behind the headline noise has been quietly reshaping itself. Saudi Arabia and the UAE have been operating at maximum sustainable capacity since the conflict began, with both producers leveraging their bypass pipelines to push incremental volumes outside the strait. Russian crude exports have remained relatively stable despite the broader sanctions environment, with most volumes flowing to India and China at discounted prices. The compliance picture inside OPEC+ has been complicated by the supply emergency. Quotas that were designed to support prices have become irrelevant when the bigger problem is getting physical barrels to market. Iranian production has collapsed under the U.S. blockade, which has cost the cartel roughly 1.5 to 2 million barrels per day of effective output. Iraq, Kuwait, and the smaller Gulf producers have all dialed back production as storage filled up. The post-conflict normalization will require OPEC+ to navigate a delicate path between bringing back disrupted supply and managing the price floor — too much supply returning too quickly will crash the curve, while too little will leave the inventory rebuild stalled. The cartel's history through past disruptions suggests they will lean toward managed normalization rather than aggressive volume returns.
Read More
-
Yen Stalls at 160 Despite a 3% JGB and Tokyo Core CPI at 2.0% — Intervention Sits at 164, Friday's Payrolls Decide
02.09.2026 · TradingNEWS ArchiveEnergy
-
FDVV ETF ($61.42) Balances Nvidia, Apple and Microsoft Against Rate-Sensitive Income Holdings — $64.54 High in Reach if Yields Ease
19.10.2026 · TradingNEWS ArchiveStocks
-
XRPI ($6.98) and XRPR ($10.61) Trade 56% and 52% Below Their Highs as First-Mover Funds Lose the Fee Battle to 0.19% Spot Products
19.10.2026 · TradingNEWS ArchiveCrypto
-
NG Holds Its $3.00–$3.30 Range as Light Storage Builds Meet Record 112.2 Bcf/d Output — $3.50 Above $3.26
19.10.2026 · TradingNEWS ArchiveCommodities
-
Dollar-Yen (158.43) Stuck in a 1.39-Yen Box as Carry Meets the Intervention Line — 156.65 Below 157.55, Tokyo Waits at 160
19.10.2026 · TradingNEWS ArchiveForex
The Key Technical Levels on WTI Crude (CL=F) After the Selloff
The technical structure on WTI (CL=F) at the current $90.25 print sits in a precarious configuration. The $90 round-number support is the immediate floor and is being tested directly. The $87 zone is the next meaningful demand level, reinforced by the 38.2% Fibonacci retracement of the conflict-era rally and the 100-day moving average. The Stochastic indicator is in deeply oversold territory following the multi-session decline, which historically increases the probability of a near-term bounce even within a broader downtrend. Widening Bollinger Bands confirm that volatility has expanded materially, which raises the risk of sharp moves in either direction over the next several sessions. The bearish wedge breakdown structure has fully activated, and the path of least resistance points lower as long as $95 acts as resistance. Above $95 the next checkpoint is $100, which would represent a clean rejection of the peace narrative. Below $87 the chart opens up toward $82-$85 as the next demand zone, with the structural floor sitting at $78-$80 which lines up with the pre-conflict trading range when adjusted for the broader macro backdrop.
Brent Crude (BZ=F) Technical Map and What the $95 Break Means
Brent (BZ=F) is sitting at roughly $95.35-$97.60 depending on the venue, with the asset having cracked through the $100 psychological handle for the first time since late April. The $95 level is the immediate support and is being tested in real time. Below that, the $90 round number is the next meaningful checkpoint, which would represent a roughly 29% drawdown from the April 30 peak of $126. The pre-war trading range of $70 to $80 is the structural floor that defines the bottom of any deep normalization scenario, but that level requires both confirmed reopening of the strait and meaningful inventory rebuilds before it becomes a realistic target. On the upside, the $100 round-number resistance is now acting as the level the bulls would need to reclaim to invalidate the bearish breakdown, with $105-$108 representing the next supply zone if a negotiation breakdown reignites the risk premium. Barclays maintains its average Brent forecast of $100 for 2026, but flags that risks are skewed to the upside if the deal does not materialize cleanly. That framing captures the asymmetric setup. The downside from current levels is bounded by the slow pace of physical normalization. The upside is bounded by the speed at which negotiations could break down.
Equity and Cross-Asset Reaction Confirms the Risk-On Posture
The broader market response to the WTI and Brent selloff has been textbook risk-on. The Nikkei 225 surged 3% to clear 65,000 for the first time as Japan, heavily dependent on Gulf energy imports, prices in the prospect of an immediate relief from the supply shock. The pan-European Stoxx 600 added 1%. Dow Jones Industrial Average futures rallied around 1%, S&P 500 futures gained roughly 1%, and Nasdaq-100 futures climbed 1.2% with U.S. cash markets closed for Memorial Day. German 10-year bund yields sank below 3% to their lowest in more than six weeks, reflecting the rapid unwind of rate-hike pricing that had built up since the conflict began. The Bank of England has been pricing two hikes for 2026 under the assumption that energy-driven inflation would force the policy hand, but that expectation is now being aggressively unwound as Brent breaks below $100. The British pound rallied 0.6% to $1.3506 on the combination of dollar weakness and the easing macro backdrop. Gold added 1.46% to $4,574 on a counterintuitive bid that reflects both the haven unwind from the dollar and the persistent central bank accumulation thesis. Energy stocks including Diamondback Energy (FANG) continue to benefit from the elevated post-war price environment even as the immediate spot moves lower, with FANG closing at $200.71 on May 22 and posting a 52-week gain of 47.73% that captures how aggressively the entire energy equity complex has been remarked under the wartime conditions.
The Diplomatic Reality Check and Why Skepticism Is Warranted
The honest counterweight to the immediate bearish move on WTI and Brent is that this is the third or fourth iteration of an imminent deal narrative since negotiations began. Trump has repeatedly suggested the conflict was on the verge of resolution, only for tensions to escalate and prices to spike back higher. The current iteration has more substance behind it than the prior cycles. Trump's weekend communications confirmed a Memorandum of Understanding has been "largely negotiated" with Saudi Arabia, the UAE, Qatar, and other regional powers. Marco Rubio described talks as having a "pretty solid thing on the table". Iranian Foreign Ministry spokesman Esmail Baqai confirmed that agreement has been reached on a "large portion of the issues under discussion", while also explicitly stating that "no one can claim the signing of an agreement is imminent". The U.S. has maintained its blockade of Iranian ports, with Trump confirming Sunday that the blockade would remain in "full force and effect until an agreement is reached, certified, and signed". That combination of substantive progress with explicit warnings against premature finalization is unusual and suggests both sides are closer to a deal than they have been at any prior point, but the residual risk of breakdown remains material. Michael Every of Rabobank captured the trader sentiment when he described the negotiation pattern as "this endless loop of Charlie Brown and Lucy with the football" — every time markets price the breakthrough, the football gets pulled away at the last moment.
The Specific Outstanding Issues That Could Still Break the Deal
The substantive issues that remain unresolved in the negotiation framework are concentrated around the Strait of Hormuz management mechanism. Iran has signaled it will not impose tolls on transiting vessels, but has flagged that "services" provided during transit "should not be presented as tolls" but will still carry a price. That linguistic gymnastics suggests Tehran is trying to preserve some form of fee structure on transits without naming it as such, which is the kind of detail that could produce a last-minute breakdown if the U.S. side rejects the framing. Iran's nuclear program remains a separate but related issue, with Tehran emphasizing that negotiations are focused on ending the war, not nuclear matters. The 60-day ceasefire extension being discussed is itself a temporary measure rather than a permanent peace settlement, which means even successful execution of the current framework leaves a structural risk overhang into the third quarter. The Abraham Accords expansion that Trump pushed in his weekend calls with Gulf leaders, Turkey, and Egypt represents an attempt to broaden the diplomatic framework, but that broader scope also introduces additional points of potential disagreement.
What Invalidates the Bearish Case on WTI and Brent
The bearish setup on WTI (CL=F) and Brent (BZ=F) loses its integrity on any of the following developments. A confirmed breakdown in the U.S.-Iran negotiation framework that returns the Strait of Hormuz to fully closed status, which would mechanically push Brent back toward the $110-$126 range within days. A direct military escalation between the U.S. and Iran involving additional strikes or naval engagement that disrupts production capacity in Saudi Arabia, the UAE, or Iraq, which would push prices toward the $130-$150 zone that the most pessimistic forecasts have flagged. OPEC+ supply discipline that fails to deliver promised volume increases despite improved diplomatic conditions, which would keep the inventory rebuild stalled and support prices. A meaningful pickup in Chinese demand recovery that absorbs additional incremental supply faster than the rebuild can deliver it. A surprise winter demand spike in Northern Hemisphere economies that draws inventories down further before the rebuild can complete. Any of those developments would invalidate the bearish breakdown on Brent and WTI and trigger the kind of violent retracement higher that has defined every prior failed peace narrative through this conflict.
What Invalidates the Bullish Case on WTI and Brent
The bullish case on crude becomes invalidated on a confirmed signed agreement between the U.S. and Iran that includes verified reopening of the Strait of Hormuz with operational tanker transits restored to pre-conflict levels. The trigger that would matter most would be visible confirmation through tanker tracking data of 15+ million barrels per day of oil flow through the strait, which would represent a return to pre-conflict throughput and would mechanically pull the geopolitical premium out of front-month Brent. An accelerated OPEC+ production normalization plan that brings disrupted Saudi, UAE, Iraqi, and Kuwaiti volumes back to market faster than current expectations would compress the curve aggressively. A confirmed extension of the 60-day ceasefire into a permanent settlement with Iran's nuclear program included in the framework would remove the structural risk overhang that has supported prices through 2026. A surprise demand contraction in China or India tied to broader macro weakness would compound the supply normalization and push Brent back toward the pre-war $70-$80 range. A meaningful pickup in U.S. shale production response to elevated prices, which has been notably absent through most of 2026 due to operator capital discipline, would add structural supply that would weigh on the curve.
My Read on WTI and Brent: Bearish Bias With a Hold Posture Until Physical Flows Confirm
The structural read on WTI (CL=F) at $90.25 and Brent (BZ=F) at $95-$97 is that the technical setup has confirmed the bearish breakdown, the diplomatic momentum is the most substantive it has been since the conflict began, and the curve structure is starting to flatten in a way consistent with the unwinding of the wartime premium. The honest counterweight is enormous and cannot be dismissed. The physical normalization timeline runs in multiple calendar quarters to years rather than weeks. OECD inventories are at tank bottoms. Saul Kavonic's read that markets will remain tight through 2027 captures the structural reality even in the most optimistic deal scenario. Trump's repeated history of signaling imminent breakthroughs followed by escalation has trained the tape to treat every dovish headline with skepticism. The current move has more substance behind it than the prior false starts, but the residual risk of a last-minute breakdown is non-trivial, and the asymmetric payoff still favors a measured exposure rather than aggressive directional positioning. The tactical call on the energy complex right now is a bearish bias with a hold posture, waiting for either confirmed physical flow data through the Strait of Hormuz that validates the deal narrative or a breakdown in negotiations that reignites the risk premium. Pressing aggressively short at $90 WTI or $95 Brent ahead of confirmed tanker transits is a low-quality entry given the inventory tightness and the demonstrated pattern of failed peace narratives. Pressing aggressively long at the same levels into a substantive diplomatic framework with active vessel movement is equally low-quality. The decisive trigger is physical confirmation of strait throughput rebuilding toward pre-conflict levels, which would validate WTI moving toward $80-$85 and Brent toward $85-$90. A breakdown in talks would push WTI back toward $105-$110 and Brent toward $115-$126 within days. Between those outcomes, the $87-$95 range on WTI and the $92-$105 range on Brent is the realistic trading band for the next two weeks while the diplomatic and physical pictures resolve. The medium-term direction of travel favors lower oil prices if the deal holds, but the path will not be linear, the inventory rebuild will take quarters rather than weeks, and the residual war premium of roughly $20-$25 per barrel above pre-war levels is going to persist well into 2027 even in the most optimistic scenario.