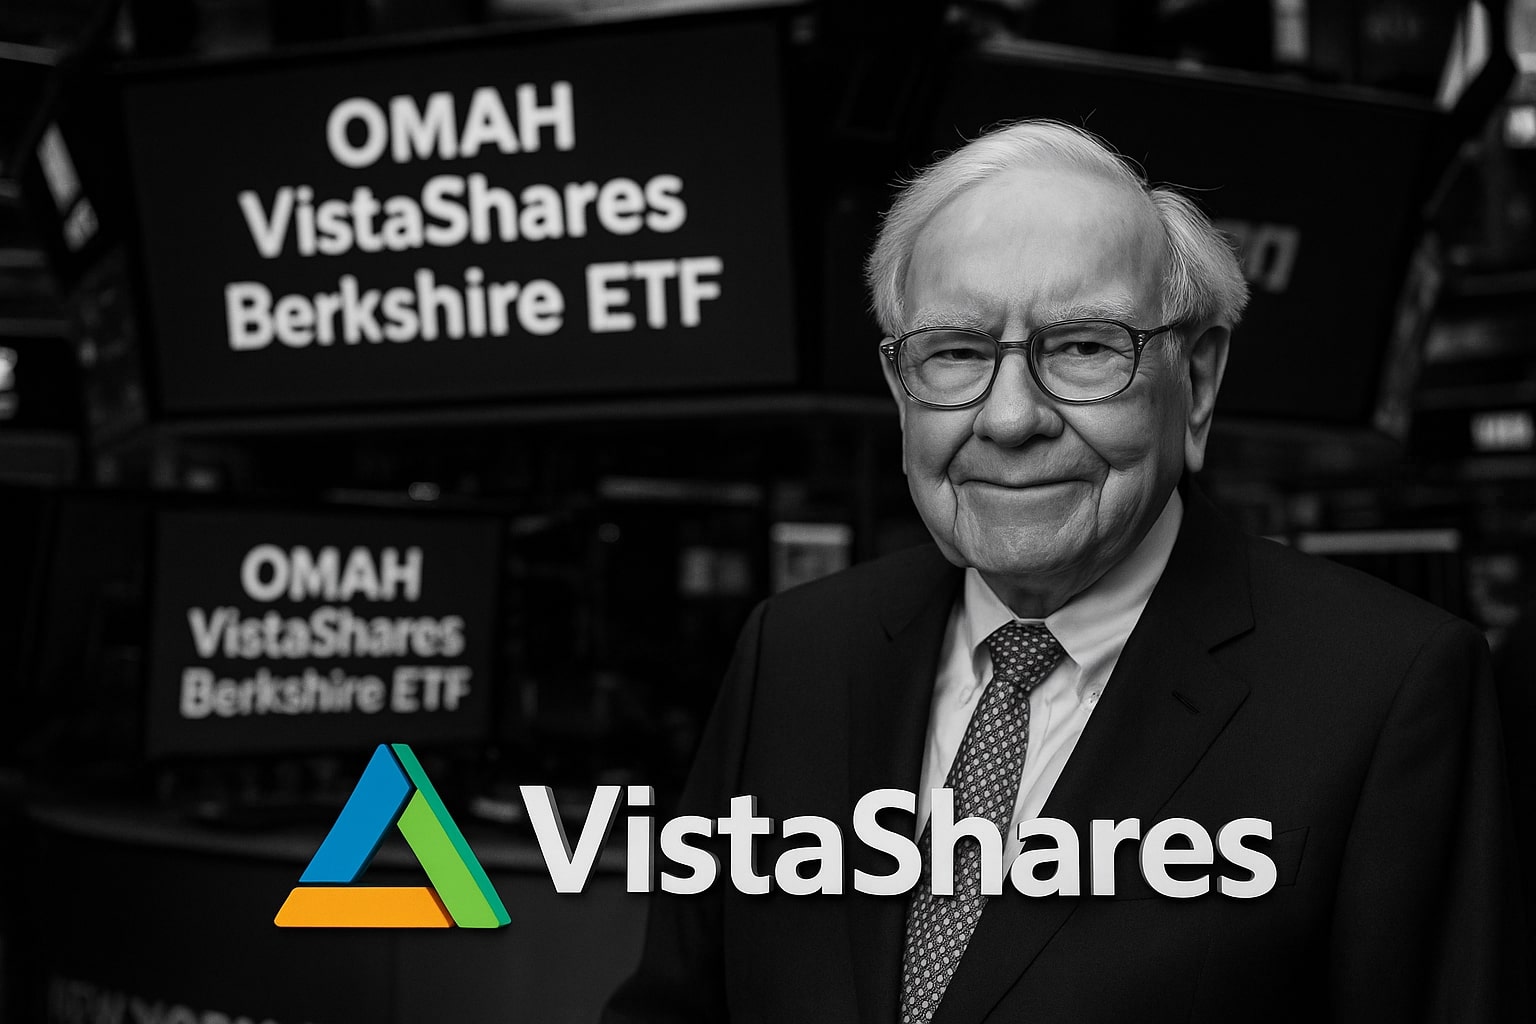
OMAH ETF Trades at $19.19 With 15% Distribution Target and $580M AUM
VistaShares’ Berkshire-linked fund mirrors BRK-B and top holdings like AAPL and OXY, using buy-write options to deliver 15% income as investors weigh NAV erosion risks | That's TradingNEWS
NYSEARCA:OMAH ETF Holds $19.19 as Investors Weigh 15% Distribution Target
The VistaShares Target 15 Berkshire Select Income ETF (NYSEARCA:OMAH) closed at $19.19 on October 2, 2025, slipping by -0.10% on volume of 707,869 shares, just under its 90-day average of 790,860. Since its launch in March 2025, the fund has quickly grown to $580.91 million in assets, with a net asset value (NAV) of $19.22. The ETF operates with an expense ratio of 0.95%, higher than plain vanilla equity ETFs but in line with actively managed derivative-income funds. OMAH has been built to deliver a bold 15% annual distribution, creating a “synthetic dividend” from Berkshire Hathaway’s portfolio through an aggressive covered call strategy.
Performance Metrics Highlight Gap With Category Benchmarks
So far in 2025, OMAH’s total return is flat year-to-date (0.00%), starkly underperforming the Derivative Income ETF category return of +6.58%. On a one-year horizon, OMAH is also showing 0.00% compared to 12.12% for peers, and the same gap exists over three years (0.00% vs. 10.56%). These figures are skewed by its recent inception in March 2025, meaning the reported trailing numbers reflect its short operating history. But the contrast highlights the challenge: while OMAH targets income first, it risks NAV erosion if the underlying Berkshire portfolio does not consistently outperform 15% annually. Its one-month gain of 4.15% compares well with the category average of 0.66%, showing that when market conditions align, the strategy can generate tactical outperformance.
Core Strategy: Berkshire Hathaway Exposure Plus Buy-Write Overlay
The ETF mirrors the top 20 holdings of Berkshire Hathaway (BRK-B $495.92) and holds a direct 10.29% weight in Berkshire itself. From there, it layers an active options strategy, selling near-term covered calls on key positions like Apple (AAPL $258, 9.11% of assets), American Express (AXP $192, 7.91%), Bank of America (BAC $32.21, 4.88%), and Chevron (CVX $162.40, 4.54%). Other holdings include Occidental Petroleum (OXY $44.23, 4.59%), Visa (V $345.95, 4.49%), Coca-Cola (KO $58.90, 4.51%), Verisign (VRSN $212, 4.57%), and Kraft Heinz (KHC $34.50, 4.48%). Together, these positions account for nearly 60% of fund assets, with sector weights heavily tilted toward financials (45.3%), followed by consumer defensive (17%), technology (13.6%), and energy (9.08%). Unlike Berkshire, which retains its massive $344 billion cash pile, OMAH is fully invested and depends on derivatives to extract cash flow.
Distribution Mechanics: The Pursuit of 15% Yield
OMAH pays monthly, with a distribution rate of $1.70 per share, equating to an 8.83% yield so far in 2025. The fund explicitly targets 15% annualized, though September’s Section 19a filing showed 93% of payouts as return of capital (ROC), a reminder that high-yield strategies often blend option premium income with ROC to maintain distributions. The key issue is sustainability: Berkshire’s long-term compounded return of 19.8% since 1965, versus the S&P 500’s 10.2%, suggests that layering a call-writing overlay can generate stable cash flow. But in years when markets return less than 15%, OMAH’s NAV will erode, effectively returning capital instead of true income.
Relative Performance Against Berkshire Hathaway (BRK-B)
Comparing OMAH directly to Berkshire Hathaway (BRK-B) shows how the derivative overlay changes outcomes. BRK-B closed at $495.92 on October 2, with a market cap of $1.07 trillion and a P/E ratio of 17.0x, trading within a 52-week range of $437.90–$542.07. Berkshire has delivered +9.41% YTD versus the S&P 500’s +14.17%, and +134.8% over five years, slightly ahead of the index. OMAH has so far outperformed BRK-B on a short-term basis in 2025 thanks to its option income cushioning drawdowns, but the April 2025 selloff showed its limits: OMAH fell more than Berkshire, revealing higher downside sensitivity when equities trend lower. Investors need to recognize that OMAH is not a pure Berkshire tracker but a leveraged income proxy.
Read More
-
GPIQ ETF Price Forecast: Can a 10% Yield at $52 Survive the Next Nasdaq Selloff?
09.02.2026 · TradingNEWS ArchiveStocks
-
XRP ETF Price Forecast: XRPI at $8.32, XRPR at $11.86 as $44.95M Inflows Defy BTC and ETH Outflows
09.02.2026 · TradingNEWS ArchiveCrypto
-
Natural Gas Futures Price Forecast: Will The $3.00 Floor Hold After The $7 Winter Spike?
09.02.2026 · TradingNEWS ArchiveCommodities
-
Stock Market Today: Dow Back Under 50K While S&P 500 and Nasdaq Push Higher as Gold Reclaims $5,000
09.02.2026 · TradingNEWS ArchiveMarkets
-
USD/JPY Price Forecast: Can Bulls Clear 157.5 Without Triggering a 160 Intervention Line?
09.02.2026 · TradingNEWS ArchiveForex
Buffett’s OxyChem Deal: Indirect Impact on OMAH’s Portfolio
The ETF’s exposure to Occidental Petroleum (OXY), a 4.59% holding, ties it to Warren Buffett’s headline $9.7 billion purchase of OxyChem from Occidental in October 2025. OXY stock fell -7.3% to $44.23 after the deal announcement, as analysts argued Berkshire paid below fair value. For OMAH, this highlights both the opportunity and risk of its heavy Berkshire-linked strategy: the ETF will ride the coattails of Buffett’s large capital allocations, whether markets agree with them or not. Occidental intends to use $6.5 billion from the deal to cut debt, improving balance sheet flexibility, but for OMAH, the immediate mark-to-market hit on OXY is felt directly in NAV performance.
Risk Factors: High Expenses, NAV Decay, and Oil Market Sensitivity
At 0.95%, OMAH’s expense ratio is steep compared to low-cost equity ETFs like SPY (0.09%), and this drag becomes more visible in sideways markets. NAV erosion is a real concern: if Berkshire’s portfolio grows less than 15% annually, OMAH’s distributions will partially cannibalize its capital. The energy exposure through OXY and CVX introduces commodity-linked volatility, and the heavy financial weighting makes the ETF vulnerable to U.S. rate cycle fluctuations. Unlike BRK-B, which benefits from holding $344 billion in cash to weather downturns, OMAH lacks that buffer.
Investment View on NYSEARCA:OMAH ETF
At $19.19, OMAH trades just above its launch NAV, supported by monthly income but under pressure from relative underperformance versus peers. Its bold 15% distribution target is attractive on paper, but the reliance on options and ROC raises sustainability questions. The fund is essentially a high-yield derivative play on Berkshire Hathaway’s portfolio, with added volatility from option overlay mechanics. Given its sector concentration, high fees, and NAV erosion risks, the ETF requires caution.
Based on all available data, OMAH is a HOLD — suitable for income-focused investors seeking monthly cash flow tied to Buffett’s strategy, but less compelling for total-return investors who may prefer direct exposure to BRK-B or lower-cost derivative income ETFs.


