SCHB vs SCHD: Growth at $62.15 Against Dividend Power at $77.45
Broad Market Innovation Versus Dividend Stability – Which ETF Wins in 2025? | That's TradingNEWS
SCHB vs SCHD: Broad Market Growth Versus Dividend Discipline
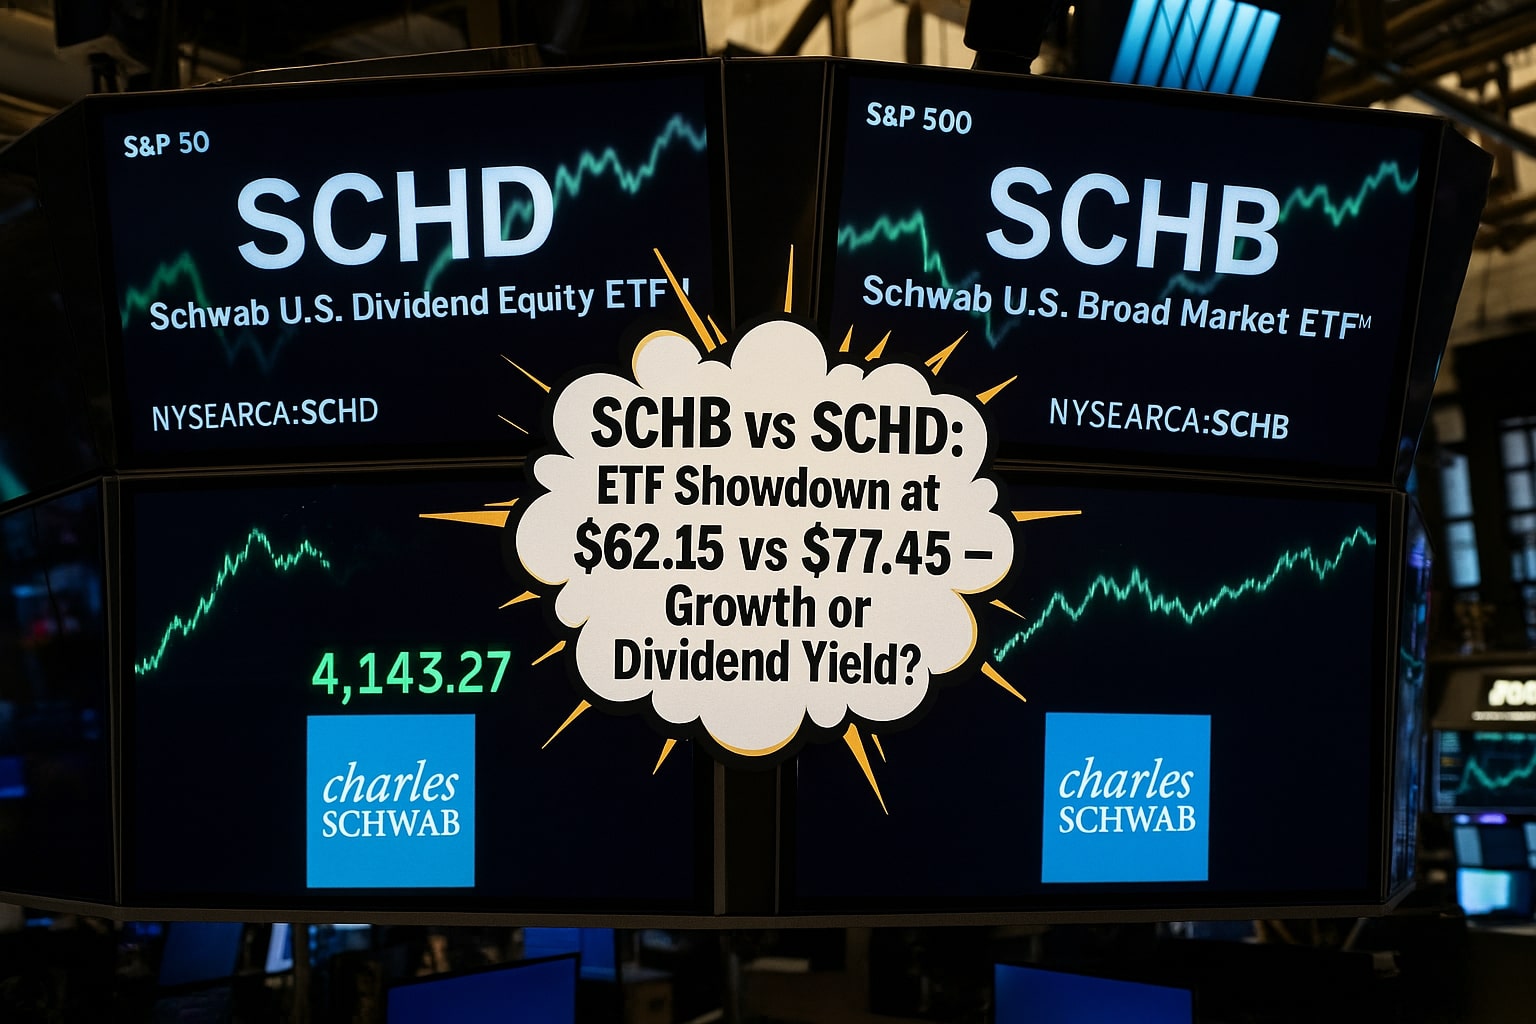
The battle between Schwab U.S. Broad Market ETF (NYSEARCA:SCHB) and Schwab U.S. Dividend Equity ETF (NYSEARCA:SCHD) defines one of 2025’s most important portfolio allocation debates. SCHB trades at $62.15, up 7% year-to-date, driven by U.S. equity resilience and the AI boom powering technology megacaps. SCHD trades higher at $77.45, gaining 5.5% YTD, but its real attraction lies in its 3.75% dividend yield and a dividend growth record that has compounded distributions by more than 70% in the last five years. Both ETFs have compounded at double-digit annualized rates over the past decade — SCHB at 11.3% CAGR and SCHD at 11.5% CAGR — yet they arrive at these results through sharply different paths. SCHB thrives on innovation-driven capital appreciation, while SCHD relies on consistent income streams and dividend reliability.
NYSEARCA:SCHB — Broad Market ETF with Tech Leadership
SCHB has more than $36 billion in assets under management (AUM) and holds over 2,500 U.S. companies across large, mid, and small caps. However, its portfolio is heavily weighted toward large-cap technology, making its exposure less diversified than its headline count suggests. The top ten holdings — Apple, Microsoft, Nvidia, Amazon, Alphabet, Berkshire Hathaway, Meta Platforms, Broadcom, Tesla, and UnitedHealth — represent more than 34% of total assets. With 28% of the fund’s weighting in technology, SCHB moves in lockstep with Nasdaq trends and AI adoption cycles. Its dividend yield sits at a modest 1.5%, confirming its role as a growth vehicle rather than an income fund. Investors choosing SCHB align themselves with the U.S. economy’s innovation frontier, but also accept valuation risk from elevated multiples in megacap tech.
NYSEARCA:SCHD — Dividend Discipline with Sector Concentration
SCHD manages a larger $56 billion in AUM with a methodology centered on dividend-paying U.S. companies with at least 10 years of sustained payments. The ETF’s 3.75% dividend yield is more than double that of SCHB, making it particularly attractive to retirement portfolios and dividend growth investors. Sector allocation highlights SCHD’s focus on stability: 19% energy, 18.8% consumer staples, 15.5% healthcare, 14% industrials, and only 9% in technology. Its top holdings — Chevron, PepsiCo, Cisco Systems, Altria, Verizon, and Pfizer — represent industries with stable cash flow and high payout ratios. SCHD’s dividend distribution growth over five years has outpaced inflation, rising nearly 70% since 2020, though future growth is expected to moderate toward 4–5% annually as its concentration in mature industries limits expansion.
10-Year Return, Volatility, and Drawdowns
Both SCHB and SCHD have produced similar long-term returns, but their volatility profiles differ. SCHB compounded at 11.3% CAGR with a beta of 1.02, slightly more volatile than the market. Its maximum drawdown was –34% during March 2020, underscoring its exposure to cyclical downturns. SCHD compounded at 11.5% CAGR with a beta of 0.91, making it less volatile than SCHB and more defensive in risk-off environments. SCHD’s worst drawdown in 2020 was –33%, marginally better, but consistent with its lower beta profile. Over 15 years, SCHD has returned a total of 356% compared to SCHB’s 348%, showing that income and compounding can rival capital appreciation strategies.
Sector Allocation Divide: Innovation Concentration Versus Dividend Stability
The largest structural difference lies in sector weightings. SCHB allocates nearly 28% to technology, 13% to healthcare, and 12% to financials, giving it growth leverage when innovation outperforms. SCHD places 19% in energy, 18.8% in consumer staples, and 15.5% in healthcare, positioning it in mature industries with predictable dividends but limited growth. This divergence defines performance in different market regimes. In a high-growth AI-driven cycle, SCHB outpaces SCHD. In a stagflationary or rate-sensitive cycle, SCHD’s stability and dividends outperform. Investors must decide whether they prefer the explosive but volatile returns of megacap growth or the steady, inflation-beating cash flows of dividend leaders.
Dividend Income Versus Total Return Trade-Off
SCHB yields only 1.5%, offering little in the way of immediate income. Its appeal lies in reinvested capital gains and the compounding effect of growth-heavy holdings. SCHD’s 3.75% yield provides meaningful quarterly income, which has grown consistently. In retirement accounts, SCHD provides stability and predictable cash flow, especially if interest rates decline, making bonds less attractive. SCHB, by contrast, remains the better choice for accumulation phases, where investors reinvest gains for long-term compounding. Forward estimates suggest SCHD’s dividend growth will slow but remain positive, while SCHB’s income contribution will remain negligible, keeping it firmly in the growth camp.
Technical Analysis and Momentum Signals
SCHB trades comfortably above its 200-day moving average at $60.40, with resistance near $64.00 and support around $60.00. Its RSI at 58 reflects moderate bullish momentum without overheating, leaving room for further upside. SCHD trades above its 200-day moving average at $75.90, with resistance at $78.50 and support at $74.20. Its RSI at 52 reflects consolidation, consistent with investor appetite for stability and income. The technical profile supports the broader fundamental narrative: SCHB carries more short-term upside potential tied to AI momentum, while SCHD remains range-bound, reflecting its income-driven investor base.
Institutional Flows and Options Activity
Institutional demand reveals investor positioning in 2025. SCHB has attracted $2.4 billion in net inflows YTD, reflecting strong demand for broad-market growth capture, particularly from hedge funds and allocators chasing AI exposure. SCHD has seen $1.1 billion in inflows, largely from pensions, retirement funds, and dividend-seeking institutions. Options market activity underscores the divergence: SCHB shows heavy call option accumulation tied to Nvidia and Microsoft exposure, while SCHD has far lower derivative activity, reflecting its buy-and-hold income investor profile.
Valuation Spread Between Growth and Dividends
SCHB’s weighted average P/E ratio of 24.2x reflects its growth tilt, heavily influenced by Nvidia’s triple-digit multiple and Microsoft’s premium valuation. SCHD’s weighted average P/E ratio of 16.4x reflects its mature sector focus, led by energy, staples, and financials. This spread highlights the core decision: investors choosing SCHB pay a premium for exposure to innovation, while SCHD investors buy income stability at a discount. Valuation risk is highest for SCHB, where multiple compression in tech could drive underperformance. SCHD faces sector drag if oil, tobacco, or healthcare underperform, though its lower valuation provides downside protection.
Tax Efficiency and Foreign Investor Considerations
Both SCHB and SCHD are structured as U.S. ETFs, distributing qualified dividends subject to a 15–30% withholding tax for foreign investors depending on treaties. SCHD’s higher yield makes tax drag more material for non-U.S. holders, reducing net income after withholding. SCHB, with its lower yield and greater reliance on capital gains, is more tax-efficient for international investors. U.S. investors benefit from qualified dividend tax rates in both funds, but SCHD’s dividend-heavy structure concentrates distributions, while SCHB’s gains compound more efficiently in tax-deferred accounts.
Expense Ratio and Cost Impact on Long-Term Returns
SCHB carries an expense ratio of just 0.03%, one of the lowest in the ETF universe, while SCHD charges 0.06%. Though the difference appears negligible, over long holding periods, SCHB’s lower fee marginally improves compounding. On a $1 million portfolio held for 20 years, SCHB’s costs total roughly $6,000, compared to $12,000 for SCHD. For dividend-focused investors prioritizing cash yield, SCHD’s higher fee is offset by its consistent payouts, but SCHB’s cost efficiency adds to its appeal for long-term accumulators.
Federal Reserve Policy and Macro Backdrop
The Federal Reserve’s 2025 policy stance has asymmetric impacts on SCHB and SCHD. If rates remain higher for longer, SCHD’s 3.75% yield competes poorly with Treasuries, limiting inflows. If the Fed begins rate cuts, SCHD’s yield advantage strengthens, drawing more institutional income flows. SCHB is more sensitive to broad equity sentiment, benefiting from rate cuts through multiple expansion in tech but at risk if inflation persists and rate hikes return. Global trade tensions, semiconductor restrictions, and regulatory scrutiny in healthcare and energy will further divide performance between SCHB and SCHD.
Forward Outlook and Buy/Sell Calls
At current levels, SCHB at $62.15 represents a Buy. Its growth bias, AI-driven catalysts, and 7% YTD momentum position it well for further appreciation, despite its premium valuation. SCHD at $77.45 remains a Hold. Its dividend reliability and lower beta make it suitable for income portfolios, but its sector concentration limits upside. In 2025, investors seeking long-term growth should overweight SCHB, while those needing dependable yield maintain allocations to SCHD.
That's TradingNEWS
Read More
-
GPIQ ETF Price Forecast: Can a 10% Yield at $52 Survive the Next Nasdaq Selloff?
09.02.2026 · TradingNEWS ArchiveStocks
-
XRP ETF Price Forecast: XRPI at $8.32, XRPR at $11.86 as $44.95M Inflows Defy BTC and ETH Outflows
09.02.2026 · TradingNEWS ArchiveCrypto
-
Natural Gas Futures Price Forecast: Will The $3.00 Floor Hold After The $7 Winter Spike?
09.02.2026 · TradingNEWS ArchiveCommodities
-
Stock Market Today: Dow Back Under 50K While S&P 500 and Nasdaq Push Higher as Gold Reclaims $5,000
09.02.2026 · TradingNEWS ArchiveMarkets
-
USD/JPY Price Forecast: Can Bulls Clear 157.5 Without Triggering a 160 Intervention Line?
09.02.2026 · TradingNEWS ArchiveForex


