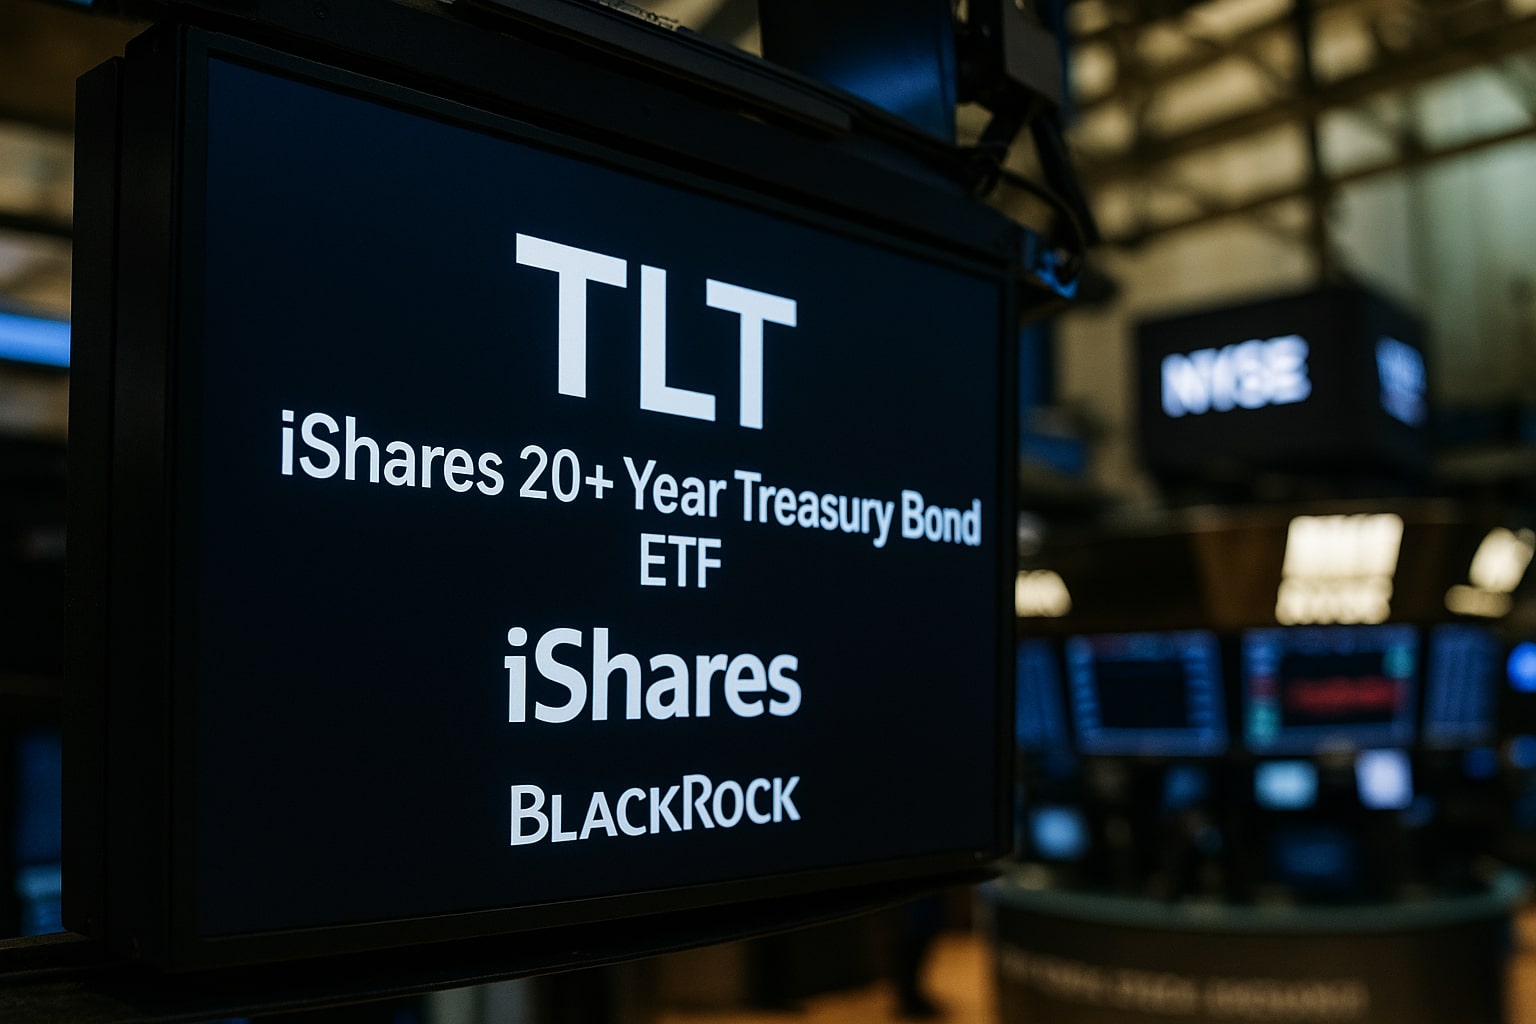
TLT ETF Price Analysis: NYSEARCA:TLT Struggles at $88.90 as Yields Stay Elevated
Fed’s 25 bps cut, $47.46B in assets, 4.82% yield, and $3.86 payouts shape TLT’s bond market recovery outlook | That's TradingNEWS
NYSEARCA:TLT Struggles at $88.90 as Long-Duration Treasuries Face Policy Crosswinds
The iShares 20+ Year Treasury Bond ETF (NYSEARCA:TLT) ended the week at $88.90, slipping 0.09% on Friday before a modest after-hours uptick to $88.95. With a 52-week range of $83.30 to $99.33, the fund is trading closer to its floor than its ceiling, highlighting investor skepticism around duration risk despite the Federal Reserve’s recent 25 basis point rate cut in September 2025. Current assets under management stand at $47.46 billion, giving TLT unmatched scale in the long-bond ETF space. Its 4.45% dividend yield and low 0.15% expense ratio remain compelling for institutions and income-focused investors, but price action shows how elevated yields have capped recovery momentum.
Liquidity Depth and Options Activity Reinforce NYSEARCA:TLT’s Market Role
Average daily volume of 36.56 million shares cements TLT as the most liquid instrument for accessing 20+ year Treasuries. Options positioning is equally significant: on September 24th, contracts traded reached 369,000, with total open interest at 5.65 million contracts. Such flows dwarf competing bond ETFs, underscoring TLT’s central role in hedging and speculative positioning around interest rate cycles. Institutional demand is clear—when U.S. Treasury yields move, TLT’s options chain is often the first place traders hedge duration exposure. Importantly, the ETF tracks the ICE U.S. Treasury 20+ Year Bond Index, which has an effective duration of 15.7 years. This means a single 100-basis-point move in yields translates into a potential 15% swing in TLT’s price, amplifying both risk and opportunity.
Federal Reserve Cuts Offer Limited Relief as Long-Term Yields Stay Elevated
Despite the September policy rate reduction, Treasury yields at the long end remain sticky. The 10-year yield trades above 4.20%, while the 30-year sits near 4.85%, leaving mortgage rates stubbornly high and housing affordability constrained. The Fed’s dual challenge is visible in the macro data: inflation, at 2.7% year-over-year, remains above target, while forward-looking growth metrics point to softening labor markets. This divergence has stunted TLT’s rebound—despite a Fed pivot, investors doubt how quickly inflation can normalize without reigniting recession risk. As a result, the ETF has struggled to reclaim the psychological $90 handle, let alone retest the $170 peak from 2020.
Performance Metrics Reveal the Brutal Impact of Higher Yields
On a year-to-date basis, TLT is up 4.79%, outperforming the 2.27% return for its peer group. The 1-year gain of 5.36% also tops the 4.50% category average, suggesting tactical buyers have benefited from volatility. Yet the longer horizon reflects the damage inflicted by the post-pandemic tightening cycle. Over three years, returns show a 4.72% annualized decline, and the five-year compounded loss of 9.33% illustrates the lasting repricing of long-duration bonds. The nadir came in 2022, when TLT collapsed 31.24%, marking one of the worst years for bonds in modern history. Income support is improving, however: the 30-day SEC yield stands at 4.82%, and annual distributions total $3.86 per share, paid monthly. That steady cash flow has turned TLT into a yield instrument in addition to a macro hedge.
Read More
-
AMLP ETF Price Forecast: 8% Yield As Alerian Midstream Giant Trades Just Below Record Highs
18.02.2026 · TradingNEWS ArchiveStocks
-
XRP ETFs Reset: XRPI, XRPR and XRPZ Track a Tense $1.50 Resistance Test
18.02.2026 · TradingNEWS ArchiveCrypto
-
Natural Gas Price Holds $3 – But Winter Spike Unwinds and LNG Politics Bite
18.02.2026 · TradingNEWS ArchiveCommodities
-
USD/JPY Price Forecast: 153–155 Range Tested as Policy Risks Build
18.02.2026 · TradingNEWS ArchiveForex
Options Market Sentiment Highlights Tactical Plays on NYSEARCA:TLT
The most actively traded option on September 24th was the December 2025 $93 call, with 31,765 contracts exchanged, representing turnover of $2.83 million. At the same time, short put strategies around the $88 strike were popular, yielding $2.07 per contract—a payout that annualizes above 9%. These flows indicate investors are using derivatives both for upside speculation and yield-enhancement strategies. The technical support band at $83–$85, which has held firm for nearly two decades, makes such put-selling attractive, while upside bets target a break above the $93 ceiling. Options data thus paints a picture of guarded optimism: traders are willing to collect yield at the floor while keeping upside exposure intact.
Technical Landscape: Resistance at $90 and $93 Caps Near-Term Upside
TLT’s price structure remains defined by heavy resistance zones. The 200-day moving average sits at $90, acting as immediate overhead pressure. A clean break above this level would set up a retest of the $93 resistance, and only then could the ETF target the broader $99–$100 zone that capped rallies earlier in the year. Momentum signals are neutral: the RSI is balanced, while the MACD has turned slightly positive but lacks conviction. On the downside, failure to hold the $88–$89 range would likely see a retest of the $85 line, a level closely aligned with historical buying interest during previous bond routs.
Outlook: Positioning NYSEARCA:TLT for Income and Recovery
At $88.90, TLT trades at a 45% discount from its 2020 peak, reflecting the deepest repricing of bonds since the early 1980s. For investors, this creates a complex setup: elevated yields and attractive monthly income argue for tactical accumulation, but inflation uncertainty and fiscal stress keep the ceiling in place. Short-term catalysts will come from the October and December FOMC meetings, labor market data, and CPI prints. For now, the risk-reward favors accumulation with overlays—covered calls or cash-secured puts—to capture 8–10% annualized yields while waiting for a structural rally. From an allocation standpoint, TLT looks like a Buy for income-enhanced strategies, but investors should brace for volatility if yields spike again.


