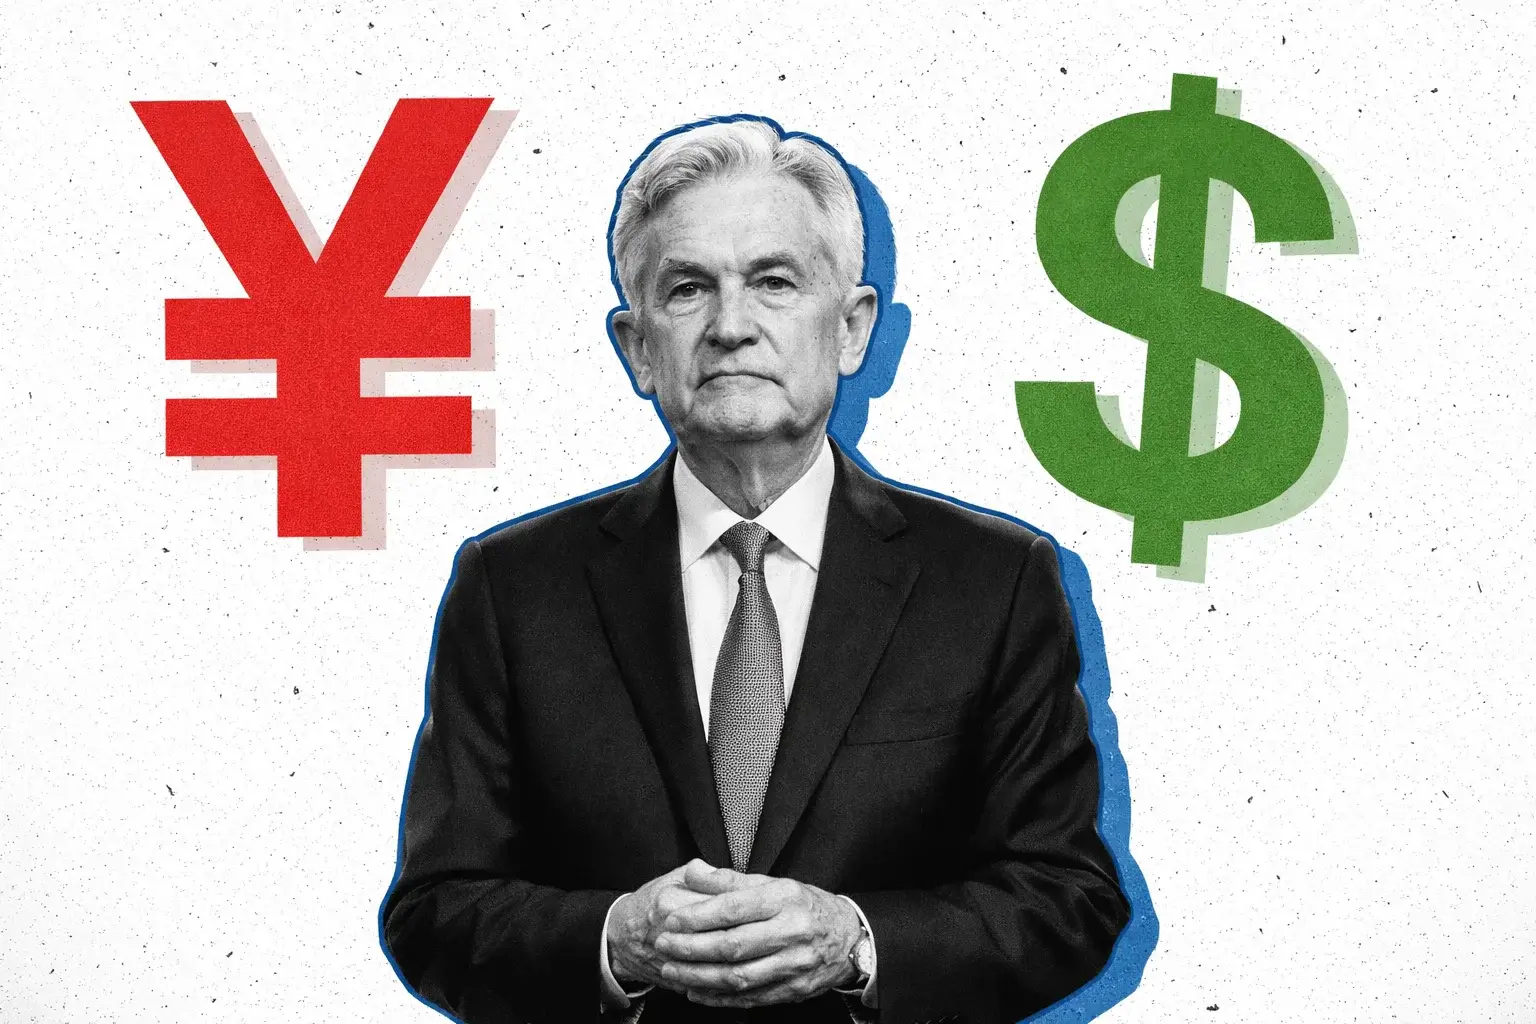
USD/JPY Price Forecast: Pair Slides to 158.18 as Hormuz Reopens, WTI Crashes 12%, DXY Sinks to 97.77
Yen leads all majors as 20-day SMA at 159.20 caps rebound; Fed rate-cut odds hit 50%, next targets 157.40 and 156.40 | That's TradingNEWS
Key Points
- USD/JPY slides 0.61% to 158.18 as Iran reopens Hormuz; WTI crashes 12%, easing yen-negative energy pressure.
- Dollar Index (DXY) sinks to 97.77; yen leads all major currencies, 10-year Treasury yield drops to 4.232%.
- 20-day SMA at 159.20 caps rebound; key support at 158.15 Bollinger band, break targets 157.40 and 156.40.
USD/JPY slipped to 158.18 in Friday afternoon trading, down 0.61% on the session and extending what is now a third consecutive week of decline for the pair. The Japanese Yen finally caught a meaningful bid against a softening US Dollar, with the pair moving within its well-established one-month consolidation band between 157.50 and 160.50 but clearly drifting toward the lower end of that range. The action unfolded against a broader risk-on backdrop where equity indices ripped to record highs — the Dow Jones added 1,013 points to 49,591.85, the S&P 500 climbed 1.31% to 7,133.46, and the Nasdaq advanced 1.51% to 24,466.81 — while energy collapsed, the Dollar Index (DXY) weakened to 97.77 (down 0.26% on the session), and the 10-year Treasury yield dropped 8.8 basis points to 4.232%. That cross-asset configuration is the definition of a dovish risk-on environment, and USD/JPY has been the pair most sensitive to exactly this macro blend. The currency heat map confirmed the yen was the strongest major on the board, gaining 0.62% against the dollar, 0.52% against the euro, 0.45% against sterling, 0.44% against the Canadian dollar, 0.35% against the Aussie, 0.46% against the kiwi, and 0.12% against the Swiss franc. When the yen leads every major cross simultaneously, something structural is happening — and what's happening is the geopolitical risk premium that has been supporting dollar strength is finally unwinding.
The Hormuz Reopening and Why Japan Was the Biggest Cross-Asset Beneficiary
Iranian Foreign Minister Seyed Abbas Araghchi's X announcement Thursday that the Strait of Hormuz is "completely open" to commercial vessels for the duration of the Israel-Lebanon ceasefire triggered the cascading moves across energy and currency markets. Transit is proceeding along coordinated routes set by Iran's Ports and Maritime Organisation for the remainder of the 10-day truce window that kicked off at 5 p.m. ET Thursday. WTI crude crashed more than 12% on the announcement, dropping from the $92 zone toward $81 per barrel. For a currency pair like USD/JPY, that kind of oil price collapse matters disproportionately because of Japan's structural dependency on imported energy. Japan imports virtually all of its crude oil and natural gas, meaning every dollar of sustained oil weakness flows directly into Japan's trade balance, reduces the pressure on the yen from energy-related dollar demand, and eases the inflationary pressure that had been forcing the Bank of Japan into a cautious posture. The 12% oil collapse on a single session is precisely the kind of magnitude move that shifts the fundamental setup for USD/JPY in a way that chart-based traders often underappreciate.
Technical Architecture: 20-Day SMA at 159.20 Caps the Rebound, Bollinger Lower Band at 158.15 Is the Line
The daily chart structure on USD/JPY is showing a near-term bearish bias despite the pair sitting inside a broader ascending structure. Spot trades below the 20-day Simple Moving Average at 159.20 — the midline of the Bollinger Band envelope — while sitting only marginally above the lower band support at 158.15. That configuration is textbook mid-correction behavior: the pair is trading in the lower half of its volatility envelope, momentum metrics are bleeding bearish, and neither the bulls nor the bears have yet claimed a decisive directional win. The Relative Strength Index at 46 sits below the 50 neutral threshold, indicating downside momentum is outweighing buying interest. The MACD reading near -0.20 confirms the negative momentum picture with a bearish histogram footprint. On the topside, initial resistance is now locked in at the 20-day SMA at 159.20, followed by the stronger barrier at the upper Bollinger Band near 160.25 where renewed selling pressure would likely emerge on any rebound attempt. On the downside, immediate support sits at 158.15 on the lower Bollinger Band — a daily close below that level would expose deeper losses toward prior price floors in the 157.00 to 156.07 zone. Holding above 158.15 keeps the pair confined to a corrective consolidation within the broader uptrend structure that has been in place since the April 2025 lows.
The 158.20 Pivot: The Line That Separates Bull and Bear Scenarios
The most important single level for USD/JPY positioning right now is 158.20. On the Elliott Wave framework that has been tracking this pair, an ascending fifth wave of larger degree is developing on the weekly chart, with the subordinate wave structure playing out on the daily and 4-hour timeframes. The main bullish scenario calls for long positions above 158.20 targeting 161.00 to 163.00, with a stop below 157.50. The alternative bearish scenario activates on a breakout and consolidation below 158.20, opening the path toward 157.00 to 156.07. A break below 158.20 with momentum confirmation would trigger systematic stop-loss selling from dip buyers who have been accumulating above that zone for the past several weeks. That's why 158.20 matters — it's not just a technical level, it's the line where positioning converts from constructive accumulation to forced liquidation.
The Weekly Channel Structure and What a Break of 157.40 Would Trigger
The broader weekly picture shows USD/JPY consolidating near the 160 zone, holding above the 158 support band, within an ascending channel extending from the April 2025 lows. That channel has been the defining structural reference for the past 12 months of trading. The bullish scenario requires a close above 160, which would open extensions toward 160.80, 162, and 164 — with a sustained move above 164 confirming a breakout from the channel and consolidation range and projecting a measured move toward 170. The bearish scenario triggers on a break below 158 to 157.40, exposing downside toward 156.40 and 154.80 near the lower channel bound. A deeper move could extend toward 150 to 147, aligning with the previous consolidation floor that contained the pair during the H2 2025 correction phase. The weekly structure is critical because it determines which directional scenario institutional allocators are positioning for — and right now, the closer the pair gets to 158, the more pressure builds on that channel support.
The RSI Divergence Warning and Why the 159.00 Rebound Attempts Keep Failing
A deeper technical observation that deserves direct attention is the bearish RSI divergence that has been building on the daily timeframe. While price action has been making higher highs on intraday rebounds into the 159.40 to 159.50 zone, the 14-day RSI has been printing lower highs — the classic non-confirmation signal that suggests underlying buying momentum is fading even as price temporarily pushes higher. Historically, this kind of divergence precedes consolidation or outright corrective phases rather than sustained breakouts. The RSI at 62 on earlier rebound attempts and now compressed back to 46 on the current pullback confirms exactly that fade pattern. Bulls need to see the RSI recapture the 55 to 60 zone on sustained volume to invalidate the divergence — without that momentum recapture, every push toward 160 is likely to meet the same overhead supply that has repelled every prior attempt through this range.
Bank of Japan Posture: Rate Hike Bets Fade, Normalization Stays Gradual
The Bank of Japan's policy posture has been a persistent tailwind for USD/JPY bulls throughout most of this cycle — but that tailwind is genuinely fading. Market expectations for a BoJ rate hike in April have been steadily pared back as the energy price shock from the Iran conflict created inflationary pressure that the central bank couldn't ignore but also couldn't aggressively counter with tightening without risking a recession. The BoJ has been emphasizing a data-dependent approach in recent commentary, signaling that the pace of policy normalization will remain gradual rather than accelerated. That gradualism has been supporting USD/JPY because it maintains the interest rate differential favoring the dollar. However, with WTI now down 12% and the inflationary impulse from the oil shock fading fast, the BoJ regains optionality to proceed with measured rate normalization without facing a runaway inflation problem. That dynamic argues for yen support over the coming months even if the near-term policy path remains cautious.
The Intervention Zone: Why 160 Remains the Ministry of Finance's Line in the Sand
Japanese monetary authorities have a multi-decade track record of intervening in FX markets when yen weakness becomes excessive or one-sided. The 160 level is widely viewed by market participants as the psychological trigger zone where verbal intervention escalates to actual market intervention by Japan's Ministry of Finance. That's why every time USD/JPY has approached 160 this year, the advance has stalled and reversed before actually breaching the level decisively. Japanese officials have already delivered verbal intervention multiple times over recent months, warning speculators against pushing the yen into disorderly weakness. The Japanese government's willingness to step in creates an asymmetric risk profile for dollar longs — the upside above 160 is capped by intervention risk, while the downside below 158 is amplified by positioning unwind as leveraged long positions exit. That's exactly why the one-month range between 157.50 and 160.50 has persisted so cleanly.
CNN Fear & Greed Index Shifts From Extreme Fear to Greed — Sentiment Backdrop Matters
The broader risk sentiment backdrop has shifted dramatically in just weeks. The CNN Fear & Greed Index has rebounded from the extreme fear levels that marked the equity market bottom in early April into the greed zone — confirming broader trend direction rather than precise positioning. That sentiment shift matters for USD/JPY because the yen's traditional role as a safe-haven funding currency means extreme risk-on environments tend to encourage carry trade buildup (supporting USD/JPY), while risk-off rotations tend to trigger carry unwind (pressuring USD/JPY lower). With sentiment now in the greed zone but with crude oil holding firm near $90 before today's collapse, the setup was vulnerable to exactly the kind of sharp repricing that Friday delivered. The combination of overextended bullish sentiment, stretched technical positioning, and a fresh catalyst (Hormuz reopening) produced the 0.61% single-session decline that has now positioned the pair right on the edge of the 158.15 Bollinger support.
The Fed Path: CPI at 3.3%, Rate Cut Odds Repriced, and FOMC as the Next Catalyst
The U.S. policy side of the USD/JPY equation has become equally fluid. The latest U.S. CPI print at 3.3% has kept inflation pressure in the conversation, but the collapse in oil prices materially changes the forward inflation trajectory. Fed Funds futures have repriced to price in roughly 50% odds of a December rate cut — a meaningful dovish shift from where the curve was sitting just 48 hours earlier. That dovish repricing is directly pressuring the dollar across the board, and USD/JPY is one of the pairs most sensitive to shifts in Fed expectations because of the rate differential dynamic. The next major catalyst is the FOMC meeting. Markets currently price in little to no expectation of a rate hike at the upcoming meeting, but forward guidance will carry enormous weight. A dovish tone that acknowledges the disinflationary impulse from lower oil prices would likely accelerate the USD/JPY pullback toward the 157.40 lower channel bound. A hawkish surprise that emphasizes persistent underlying inflation pressures could trigger a sharp rebound back toward 160 — the classic asymmetric FOMC setup.
Crowded Positioning: Leveraged Longs Vulnerable to Fast Unwind
Commitment of Traders data from CME has shown leveraged funds maintaining a substantial net long position in USD/JPY futures for months. That crowded positioning is itself a risk factor — when speculative positioning gets extreme on one side, any shift in fundamentals or risk sentiment can trigger rapid stop-driven unwinding. Risk reversals, which measure the premium for options protecting against yen strength versus yen weakness, have narrowed slightly, indicating marginally reduced demand for yen downside protection. That narrowing suggests the options market is beginning to price in the possibility that the yen's recent weakness may be topping out. Combined with the crowded futures positioning, the setup is asymmetric — a significant yen-positive catalyst like an FOMC dovish surprise or a further leg down in oil prices could trigger a disproportionate USD/JPY decline as longs rush to exit simultaneously.
The Nasdaq Context: 24,467 New Highs and the Risk-On Trade That Could Flip
The broader Nasdaq move to 24,467 — a 1.51% gain on Friday and a new all-time high — provides important context for the USD/JPY setup. The Nasdaq has surged 16% off the April lows, completing the previous double-top scenario on fundamentals without being deterred by the historical shadow-based pattern analysis. The current Fibonacci extension framework projects next resistance at 26,480 to 26,580 (the 38.2% extension of the April 2025 to January 2026 to April 2026 move), with further upside to 27,740 (50% extension) and 28,900 (61.8% extension) on a sustained breakout. The risk for USD/JPY is that extreme equity positioning creates the conditions for a rotation back toward safety if any of the upcoming catalysts disappoint. A Nasdaq pullback below 26,100 followed by 25,800 would likely coincide with yen strength as risk-off flows rebuild. That cross-asset correlation is exactly what bulls on USD/JPY need to watch — because an equity rollover would almost certainly drag the pair toward the lower end of its one-month range.
Read More
-
FDMO's 39% Year Rides the AI Momentum Trade — and the June Volatility Tested It
12.06.2026 · TradingNEWS ArchiveStocks
-
XRP ETFs Post Record Inflows and 840 Million Locked Tokens — But the Price Still Fell to $1.15
12.06.2026 · TradingNEWS ArchiveCrypto
-
Natural Gas Holds $3.15 as a 108 Bcf Storage Build Battles Late-June Heat
12.06.2026 · TradingNEWS ArchiveCommodities
-
Dollar-Yen Presses 160 as a Record Rate Gap Battles Japan's Intervention Line
12.06.2026 · TradingNEWS ArchiveForex
The Key Support Cluster: 158.30 to 158.20 to 158.15 — The Zone That Matters Most
The concentration of support in the 158.15 to 158.30 zone is the most critical single area for USD/JPY positioning right now. That cluster includes the Bollinger lower band at 158.15, the 158.20 Elliott Wave pivot, the 158.25 recent low, and the 200-period EMA on the 4-hour chart at 158.46 that has been acting as dynamic support. A daily close below 158.15 would trigger systematic selling from multiple algorithmic strategies simultaneously — trend-following systems would flip bearish, mean-reversion strategies would abandon the support, and option dealer hedging flows would accelerate the decline. That's why the 158 zone is defended so aggressively on every test. Above 158.20, dips are treated as corrective within the prevailing bullish structure. Below 158.20, the pair transitions from consolidation to outright correction mode. The next 5 to 10 trading sessions will determine which side wins that battle.
The Weekend Risk: U.S.-Iran Talks and the Binary Outcome
Traders need to focus on developments around the U.S.-Iran negotiating round expected this weekend. Potential talks could take place Sunday in Islamabad, and the outcome will likely provide the decisive catalyst for the next directional leg in USD/JPY. A breakthrough that includes the widely reported three-page framework — involving a $20 billion U.S. release of frozen Iranian funds in exchange for Iran giving up enriched uranium — would likely extend the dollar weakness and push USD/JPY toward 157.40 and potentially 156. A breakdown in negotiations that suggests the war could reignite would trigger a sharp reversal toward 160 as safe-haven dollar demand returns and oil prices rebuild risk premium. The binary nature of this weekend's catalyst means holding directional exposure through Sunday carries asymmetric event risk — tight stops or reduced position sizing are the appropriate risk management responses.
USD/JPY Forecast: Bearish Bias With Disciplined Risk Management
USD/JPY is a Sell on any rebound toward the 159.20 to 159.50 zone with stops above 160.25 and targets at 157.40 and 156.40. The technical structure has shifted to a near-term bearish bias with spot sitting below the 20-day SMA, momentum oscillators flashing bearish, and the RSI divergence warning that the ceiling at 160 is structurally capped by intervention risk. The 12% oil collapse has removed the primary inflationary pressure that was forcing the BoJ into a cautious posture and removed the dollar-supportive flow that energy imports generate. The Fed dovish repricing, with December rate cut odds now at 50%, compresses the interest rate differential that has been the fundamental anchor for USD/JPY bulls. The intervention risk at 160 combined with the leveraged long positioning overhang creates an asymmetric risk profile that favors downside over upside.
Tactical positioning framework: Short USD/JPY above 159.20 with stops above 160.25, targeting 157.40 initially and 156.40 on follow-through. Aggressive bears can add exposure on a confirmed daily close below 158.15 targeting 157.00 and 156.07. Conservative positioning waits for a retest of 159.00 to 159.50 before fading the rebound. Long exposure is not recommended at current levels given the overhead resistance structure, dovish Fed repricing, and oil price collapse — the only scenarios that justify long USD/JPY positioning involve a breakdown in U.S.-Iran talks, a hawkish Fed surprise, or a fresh escalation that re-triggers the safe-haven dollar demand.
The base case targets 157.40 over the next two-to-three weeks, with 156.40 as the medium-term objective if the weekly ascending channel support fails. The bull case — USD/JPY pushing through 160.25 and targeting 161, 162, 164, and ultimately 170 — requires a genuine policy divergence acceleration that is not consistent with the current macro backdrop. The bear case — deeper pullback toward 150 to 147 — would require a sustained Fed dovish cycle, BoJ policy tightening, and sustained oil price weakness below $80. The most probable outcome is continued consolidation between 157.40 and 160.50 over the next two weeks, resolving lower as the FOMC meeting approaches and weekend U.S.-Iran developments provide directional catalyst. Stay tactical, respect the 158.15 support, fade rallies into 159.20 to 159.50, and monitor the BoJ commentary for any shift toward a more accelerated normalization posture. Sell. Near-term target 157.40. Medium-term target 156.40. The yen finally has a bid that matters