UTF vs XLU: Yield, Diversification, and Structural Tailwinds Define the Utility ETF Split
Diversified Infrastructure vs Electric Utility Concentration: UTF’s Broader Reach Offers Strategic Advantage
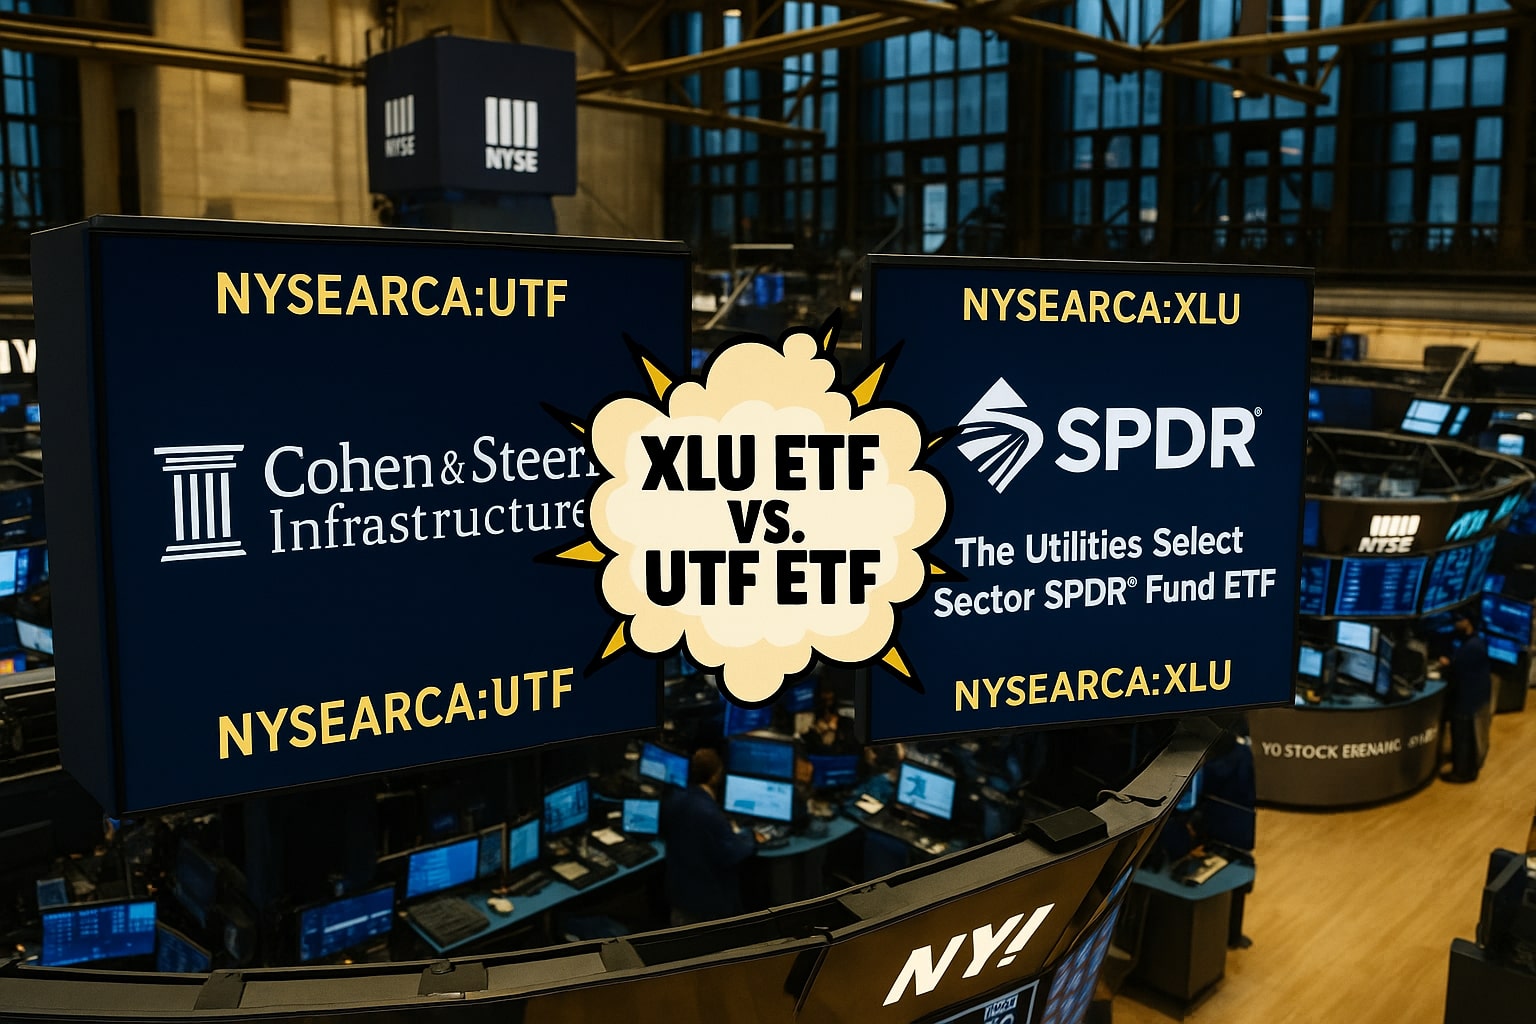
NASDAQ:UTF is not a utility ETF in the traditional mold—it’s a multi-asset, globally diversified infrastructure fund that absorbs utility upside while expanding exposure to midstream pipelines, toll roads, ports, airports, and communications towers. Its utility allocation sits at 53%, far below the electricity-weighted NYSEARCA:XLU, which allocates more than 64% to electric utilities and 26% to multi-utilities. XLU is tightly concentrated: 59% of its assets are locked in its top 10 holdings, with only 34 stocks total, whereas UTF holds a broad 288-position portfolio with just 33% in its top ten.
UTF’s diversified positioning has real implications. It includes infrastructure names like Enbridge (ENB), which offers reliable yield and plays into energy security, and also targets airports, ports, and telecom towers—sectors that stand to gain from a "Build, Baby, Build" infrastructure-led expansion under a Trump White House. UTF aligns itself with global physical assets, not just domestic electricity production.
Rate Cuts Shift the Leverage Equation: UTF Stands to Gain More Than XLU
UTF employs 27.6% effective leverage, a fact that magnifies both risk and return. This leverage strategy hurt during the Fed’s aggressive rate cycle in 2022–2023, but that cycle has now turned. Market pricing from CME FedWatch implies a strong likelihood of four 25-basis-point cuts in the next 12 months, lowering UTF’s 2.47% interest expense substantially. That 2.47% comprises the majority of UTF’s 3.86% total expense ratio, but it is about to shrink.
XLU, in contrast, is unlevered. Its 0.08% expense ratio reflects that simplicity. Yet, that simplicity also means less amplification of capital upside in a falling-rate environment. When the Fed cut rates to zero in 2020, XLU rallied from $55 to $76, driven by yield-seeking inflows. That could repeat—but UTF’s embedded leverage makes it more reactive to rate policy, and its infrastructure mix may draw more demand from allocators looking for real-asset exposure amid currency debasement fears.
Yield & Income Stability: UTF Offers 7.4%, While XLU Trails at 2.78%
UTF distributes $0.155 per share monthly, yielding 7.4% annually at current prices. That payout has remained stable since 2019, even through rate spikes and pandemic dislocations. XLU’s dividend yield, while rising modestly, sits at just 2.78%. UTF’s yield, although higher, comes with duration and leverage risk—but in a falling rate environment, the tailwinds are strong.
XLU benefits from 14 consecutive years of dividend growth and more defensive consistency, but the current dividend yield premium for UTF stands at 4.62%, a gap that’s difficult to overlook for income-focused portfolios. UTF’s monthly structure also appeals to retirees and cash flow-oriented investors, especially when combined with the upside participation in infrastructure themes.
Performance Differential: UTF Leads with 27% Return, XLU Trails at 21.5%
Over the past year, UTF delivered a 27% total return, trouncing XLU’s 21.5%, and even outperforming the S&P 500. The difference isn't just performance—it's what powered that performance. UTF’s exposure to reshoring, AI-driven data center demand, energy pipelines, and transportation networks placed it at the intersection of every secular macro trend in 2024–2025. XLU, although benefitting from electricity demand, particularly in data center and AI expansion, remains largely tethered to four major names: NEE, SO, CEG, and DUK, which together make up over 35% of the fund.
NextEra Energy (NEE), a clean energy giant, saw declining net income and dragged the fund’s performance, while Southern Company (SO) and Constellation Energy (CEG) led earnings growth. Duke Energy (DUK), meanwhile, gained off its nuclear contracts and expansion in grid capacity, but overall, XLU remained reactive rather than proactive. UTF investors, on the other hand, rode the rate cycle reversal and secular infrastructure narrative to stronger upside.
Valuation Dislocation: XLU Trades at a Premium, UTF Still Undervalued
XLU is currently priced with a P/E ratio of 18.11, trading near the bottom of its 10-year historical range but still reflecting a 10% valuation premium compared to its four-year average yield. UTF, with a P/E of 17.4x, sits modestly below the broader market’s 22x forward P/E, reflecting relative undervaluation. Given its multi-sector exposure and total return orientation, UTF arguably offers more upside from multiple expansion if infrastructure allocations rise further amid global fiscal stimulus.
In yield-adjusted terms, XLU’s current dividend yield is nearly 11% below its historical norm, while UTF’s 7.00% TTM yield is just 9% below its own average. Despite similar valuation premiums, UTF’s current trajectory suggests a stronger margin of safety—especially given the ongoing drop in real yields and long-term interest rate expectations.
Thematic Tailwinds: AI, Reshoring, Grid Modernization All Point to UTF
UTF sits at the center of every major macro theme currently driving infrastructure investing. From AI data centers requiring megawatt-scale power redundancy, to nuclear expansion, pipeline modernization, and reindustrialization, UTF’s portfolio is built for secular tailwinds. CEG has already signed a 20-year nuclear power agreement with Meta for data centers. DUK is doubling its capex to meet exploding grid demand from hyperscalers.
UTF’s 53% utility weighting supports yield stability, while its 21% industrials and 19% energy allocations deliver growth exposure. Compare that to XLU’s utility-heavy exposure—with limited industrial or midstream upside—and the thematic upside skews toward UTF. Add in UTF’s 288-stock breadth, versus XLU’s 34-stock narrow funnel, and the comparative flexibility is clear.
Liquidity and Asset Size: XLU Dominates Trading, UTF Wins on Niche Fit
XLU remains the most liquid utility ETF, with $20.49B AUM, daily trading volume advantage, and broad institutional ownership. It’s the preferred vehicle for large allocators seeking sector exposure. UTF, with $2.48B AUM, is smaller and closed-ended—but its liquidity suffices for most retail and RIA use cases. Where UTF wins is in fit: leveraged income, infrastructure breadth, and monthly distributions make it ideal for yield-seeking and macro-infrastructure allocations.
UTF’s 32% turnover signals active management and tactical positioning, compared to XLU’s 5% turnover—which reflects its passive S&P 500 utility indexing. The higher turnover brings tax and transaction costs, but it also allows UTF to rotate into alpha-generating opportunities as macro conditions evolve.
Fundamental Risk Profiles: UTF Bears Leverage Risk, XLU Faces Sector Concentration
Leverage cuts both ways, and UTF’s 27.6% leverage adds downside risk during drawdowns. UTF’s NAV took a severe hit during the 2022 rate spike—but recovered swiftly, delivering outperformance in 2024–2025. XLU’s key risk lies in concentration: its top 10 holdings are nearly 60% of AUM, and any underperformance from names like NEE or SO can heavily impact returns. UTF’s top 10 account for just 33% of the fund.
Where UTF risks downside amplification, XLU risks passive underperformance through structural concentration and limited upside from grid-modernization themes.
Final Positioning: Strategic Tilt Favors UTF for Total Return, While XLU Holds Ground for Pure Yield Stability
With rate cuts imminent, power demand soaring, and real-asset inflation hedges in demand, the relative positioning of UTF vs XLU is clear. UTF’s 7.4% yield, macro-aligned infrastructure spread, and leverage make it a Buy for investors seeking total return and long-term secular upside. XLU’s 2.78% yield, defensive posture, and passive utility concentration suggest a Hold, suitable for conservative portfolios seeking yield ballast rather than expansion.
UTF: Buy
XLU: Hold


