XME ETF at $91.50 With +59.7% YTD Rally, Uranium and Gold Drive Gains
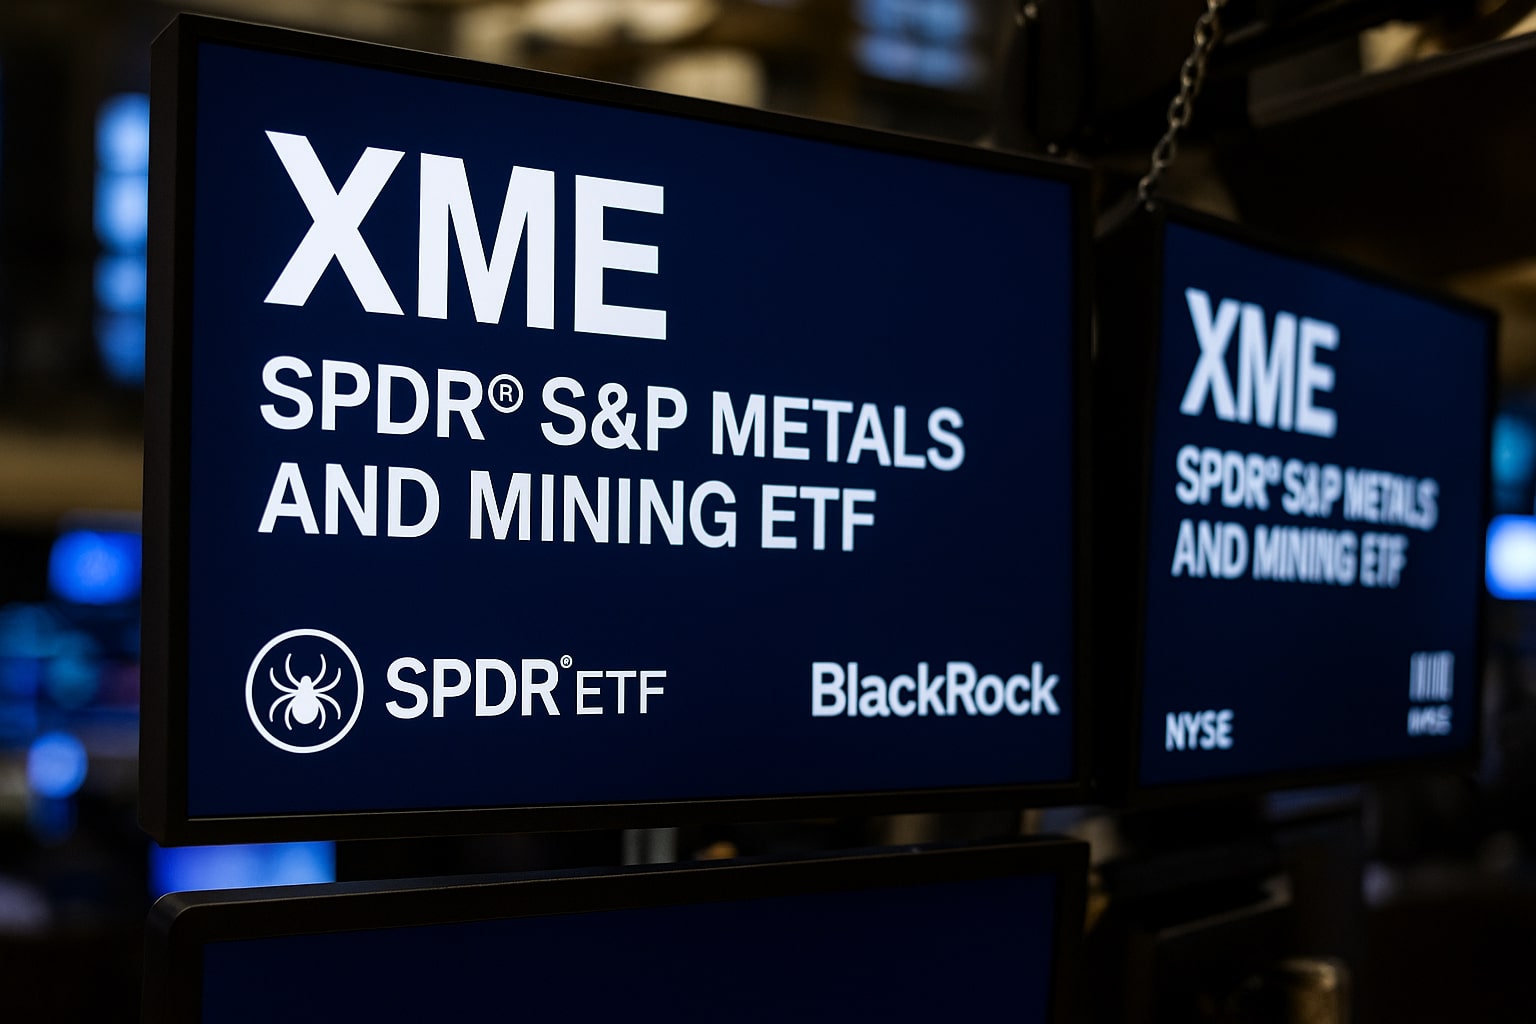
The SPDR S&P Metals & Mining ETF (XME) doubled from April’s $45.89 tariff low to $91.50, fueled by uranium’s 175% surge, gold at $3,800/oz, and copper at $4.63/lb. With 57.8% in metals and 17.4% in energy, XME eyes $96–100 breakout | That's TradingNEWS
SPDR S&P Metals & Mining ETF (NYSEARCA:XME) – Price Performance, Holdings, and Outlook
XME Price Surges Toward Record Highs
The SPDR S&P Metals & Mining ETF (NYSEARCA:XME) closed at $91.50, climbing 0.62% on the day, just below its 52-week high of $92.65. The ETF has been one of the strongest performers in the materials sector, advancing 59.68% year-to-date compared to a 19.38% category average. Over the past year, XME has returned 50.44%, more than quadrupling the 12.20% industry benchmark. Longer-term, the fund delivered a 25.60% three-year return and a 16.55% ten-year annualized gain, proving it has not only short-term momentum but also long-run strength. The rally follows broad-based strength in metals—copper, aluminum, silver, and uranium—all benefiting from tariffs, supply bottlenecks, and rising demand for green energy infrastructure.
ETF Composition and Sector Allocation
XME manages $2.60 billion in net assets, charges an expense ratio of 0.35%, and distributes a modest 0.36% yield, with the most recent quarterly dividend of $0.10075 per share paid in September. The fund is non-diversified, with 29–30 holdings rebalanced quarterly on an equal-weight basis. Basic materials dominate with 78.38% exposure, followed by 17.44% in energy and 4.18% in industrials. Unlike broader materials ETFs such as XLB, which carries more chemical and packaging stocks, XME tilts heavily toward metals and mining, creating sharper upside during commodity booms but higher volatility during downturns.
Top Holdings Driving Performance
The top ten positions account for nearly 55% of total assets, highlighting XME’s concentrated exposure. MP Materials (7.84%), Uranium Energy (6.01%), and Coeur Mining (5.76%) lead the list, alongside steel and coal producers like Cleveland-Cliffs (5.72%) and Warrior Met Coal (5.61%). Precious metals exposure is represented by Hecla Mining (5.63%) and Newmont Corporation (4.99%), while industrial metals leaders like Nucor (4.52%), Commercial Metals (4.57%), and Core Natural Resources (4.32%) round out the allocation. The balanced mix of uranium, steel, and gold equities has amplified returns as uranium prices surged 175% since 2020, gold broke past $3,800/oz, and copper trades at $4.63/lb, 135% higher since its pandemic low.
Macroeconomic Catalysts and Tariff Impact
The fund’s 2025 rally accelerated after Trump administration tariffs were announced on April 7, 2025, targeting BRICS-aligned nations with a 10% levy. XME bottomed at $45.89 that day, before doubling to above $91 per share in less than six months. The tariff shock sparked capital flows into domestic metals and mining firms, especially uranium and steel producers, as investors positioned for higher U.S. production and reduced reliance on imports. At the same time, a weaker U.S. dollar and persistent inflation supported commodity-linked equities, strengthening XME’s correlation with broader commodity indices.
Read More
-
JPIE ETF Price Forecast: Short-Duration Income ETF Near 52-Week High
30.01.2026 · TradingNEWS ArchiveStocks
-
Ripple XRP ETFs Hit Record Outflows As XRPI, XRPR Crash Toward Cycle Lows
30.01.2026 · TradingNEWS ArchiveCrypto
-
Natural Gas Price Forecast: Is NG=F Setting Up One Last Winter Spike?
30.01.2026 · TradingNEWS ArchiveCommodities
-
USD/JPY Price Forecast - USDJPY=X Jumps Back Above 154 as Warsh Nomination Recharges Dollar Bulls
30.01.2026 · TradingNEWS ArchiveForex
Performance Compared to Benchmarks
Since inception in 2006, XME has lagged the Materials Select Sector SPDR Fund (XLB) with a total return of 145.96% vs. 344.44%, but over the last five years it has outperformed decisively, returning 272.99% compared to 51.29% for XLB. Volatility is higher—32.99% standard deviation vs. XLB’s 20.01%—and XME’s drawdowns have been deeper, with an 85.95% maximum drop since inception. Despite that risk, the ETF has become a tactical play for investors betting on commodity super-cycles, outperforming during inflationary and tariff-driven phases when metals prices rise.
Valuation and Fundamental Positioning
XME trades at a P/E of 25.98, below the 27–28x levels of broader materials ETFs, and its Price-to-Book ratio at 1.89 suggests value compared to sector peers. However, free cash flow yields remain sensitive to commodity prices, as evidenced in 2022–2023 when volatility cut mining earnings. Currently, uranium, copper, and gold prices are well above historical averages, supporting higher-than-baseline returns for fund constituents. Forward earnings expectations for steelmakers like Nucor and uranium players like UEC imply that XME’s valuation is justified, but investors must accept volatility.
Technical Levels and Market Sentiment
Technically, XME is testing resistance near $92.65, its all-time high set in September 2025. A breakout could open the path to retesting the 2008 record peak of $96.09. Near-term support sits at $76.45 (August low) and $71.07 (early summer low). ETF flows suggest confidence: average daily trading volume sits at 1.8M shares, reinforcing liquidity. Quant models currently grade XME a Buy (4.44 score), while analyst sentiment remains more cautious at Hold (3.0), reflecting skepticism about metals sustainability if tariffs trigger global demand erosion.
Outlook and Investment Decision
The SPDR S&P Metals & Mining ETF (NYSEARCA:XME) has delivered 471% returns since its March 2020 low of $16.13, underscoring its leverage to commodity cycles. With gold up 162%, silver up 283%, and uranium up nearly 175% since the pandemic, the ETF continues to benefit from a metals bull market. Rising geopolitical tensions, trade restrictions, and supply bottlenecks strengthen the bull case. At $91.50, valuation remains fair given the earnings trajectory of its core holdings.
Based on metals price momentum, sector fundamentals, and tariff tailwinds, the ETF remains a Buy at current levels, with upside toward $96–100 if global inflation and trade frictions persist. The risk lies in sharp commodity reversals, which could drive drawdowns toward the $70–75 range, but the reward-to-risk balance currently favors the bullish stance.


