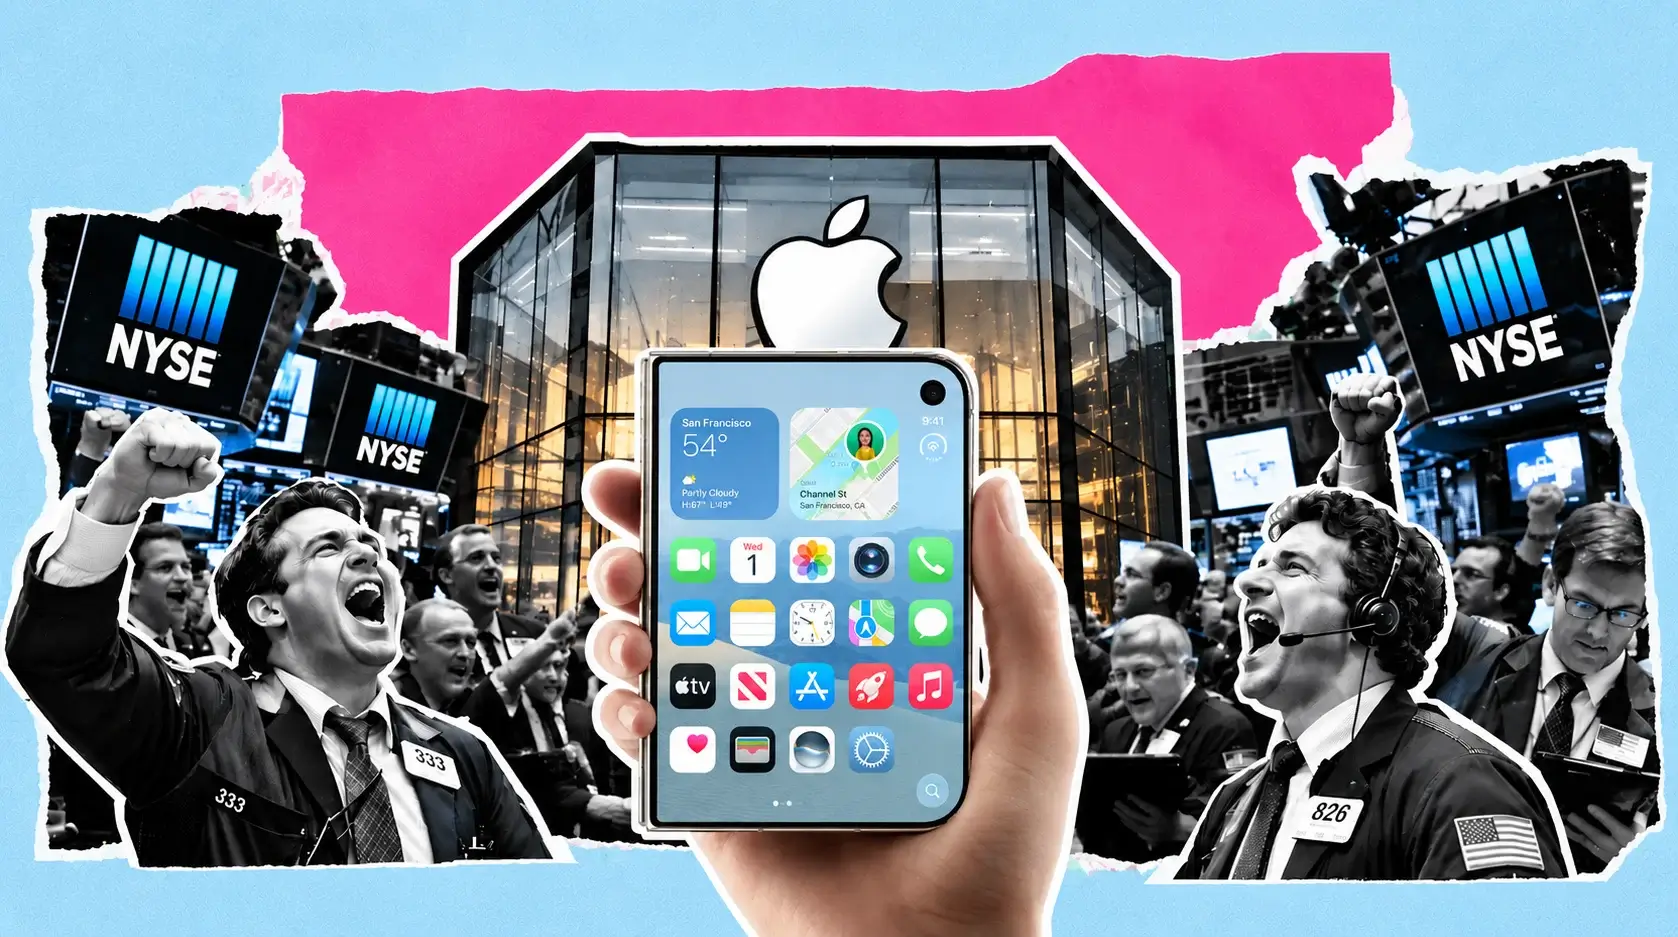
Apple Adds 1.2% to $319.14 as the Duo Opens a $2,000 Tier and Pro Prices Rise $100
June-quarter revenue hit $109.42 billion at a 50.1% gross margin | That's TradingNEWS
Key Points
- AAPL climbed 1.20% to $319.14 on 53M-plus shares against a Nasdaq down 0.71%.
- The foldable iPhone Duo starts at $1,999, with preorders October 16 and availability October 23.
- Q3 revenue reached $109.42 billion, up 16.4%, with Services at $30.74 billion missing estimates.
AAPL traded at $319.14 Thursday, up $3.80 or 1.20% from Wednesday's $315.34 close, having climbed more than 1% in the premarket session and touched almost $318 in early trade before extending higher.
The relative move is what matters. The Nasdaq Composite was down 185.48 points at 26,067.86, a 0.71% decline. The S&P 500 fell 0.61% to 7,590.14. The Russell 2000 gave up 0.85% and the VIX jumped 9.23% to 17.98. Apple outperformed its index by roughly 190 basis points on a day when the 10-year Treasury yield hit 4.90%, its highest since November 2023, and West Texas Intermediate touched $100.10 a barrel.
Wednesday told the opposite story. Apple closed at $315.34, down 0.28%, on 64.7 million shares — nearly 2% above its three-month average of 53.7 million — on the day it unveiled the biggest change to the iPhone in its nearly twenty-year history. The S&P 500 finished at 7,636, down 0.48%, and the Nasdaq at 26,253, down 0.64%. Microsoft closed at $491.65, off 0.47%, and Alphabet at $330.65, down 2.28%.
So the sequence was: launch day flat-to-lower on heavy volume, then a 1.2% advance the following session as the market digested pricing and product detail against a hostile macro tape.
Market capitalization stands at $4.602 trillion. The trailing price-to-earnings ratio is 36.28 against trailing EPS of $8.69 on a diluted basis over twelve months. The 52-week range runs $225.95 to $344.57 — Apple sits 41% above the low and 7.4% below the high.
Performance has been strong and getting stronger. The stock is up 39.43% over twelve months, roughly 35% over the past year on an alternative measure, and close to 21% year to date. Against an S&P 500 up 11.55% year to date, Apple has been a source of index outperformance rather than a drag.
Volume Thursday ran above the 53.2 million three-month average. The stock has now traded above 53 million shares in consecutive sessions, which is turnover consistent with repositioning rather than drift.
The Day-After Trade That Broke a Two-Decade Pattern
Thursday's gain is statistically unusual and the market noticed.
Apple shares have historically fallen or been little changed the day after a major product introduction, according to a study of releases going back to 2007 published this week. The pattern is well documented and it makes intuitive sense: anticipation builds into the event, the product is revealed, and the news is sold.
Thursday broke it. The stock rose more than 1% in premarket trading and held the gain into the session, bucking the multi-year trend.
The reason is pricing, and specifically the fact that the foldable came in cheaper than the market expected. The iPhone Duo starts at $1,999 for 256GB. Investor expectations had clustered in the $2,300 to $2,500 range, with one pre-event projection putting the device between $2,099 and $2,299. Apple undercut the low end of that band by $100 and undercut Samsung's Galaxy Fold7 by exactly one dollar.
That single number resolved the biggest overhang on the launch. A $2,500 foldable is a halo product with a negligible unit contribution. A $1,999 foldable is a new price tier that a meaningful slice of the existing installed base can actually reach, particularly with a leasing option attached.
The revision that followed captures the shift. One prominent estimate for the Duo's share of fiscal 2027 iPhone revenue was doubled from 5% to 10% overnight.
Wednesday's 0.28% decline reflected skepticism about how many consumers would pay up for an expensive new device. Thursday's 1.2% advance reflected the arithmetic once the price sank in.
There is a competing interpretation worth holding. Apple raised iPhone 18 Pro and Pro Max prices by $100 each, and one immediate read on Wednesday was that the stock slid because of the increase rather than the foldable. Higher prices across the premium line also narrow the perceived gap to a completely new form factor, which could push some buyers toward the Duo rather than away from it.
Either way, the day-after reversal is a genuine signal in a stock where the day-after pattern has held for nearly twenty years.
The Duo: $1,999, a 7.6-Inch Display, and a Price Tier That Did Not Exist
The product detail justifies the market's attention. The iPhone Duo is Apple's first foldable and the largest form-factor change since the original iPhone.
The device uses a passport-like design that opens and closes like a book. The outer display measures 5.4 inches. Unfolded, it reveals a 7.6-inch display Apple describes as the largest ever on an iPhone, positioned for video, gaming, work and multitasking. Apple says it is the thinnest iPhone yet when unfolded. The hinge — historically the failure point on every foldable ever shipped — was designed and built with the help of AI and 3D printing.
Pricing starts at $1,999 for 256GB and scales through configurations to 2TB, with the top of the range reaching $3,199. Preorders open October 16 across more than 70 countries and regions, with availability from October 23. Apple Pencil support on either display arrives later this year.
The strategic significance sits in the average selling price line. A $1,999 entry point establishes an entirely new premium tier above the existing Pro range heading into the holiday quarter — the ASP lever bulls have been asking Apple to pull for years. iPhone generated $54.25 billion in the June quarter at 49.6% of total revenue. A device carrying a 67% premium over the $1,199 iPhone 18 Pro, even at modest unit volumes, moves that number.
The AI framing was deliberate. The new chief executive opened his first keynote by describing what an ideal personal intelligence hub would look like — something always with you, deeply personal, able to bring intelligence to the moments that matter — before revealing the iPhone as the answer. It was a structural echo of the original 2007 launch.
The device rollout sits alongside upgraded Siri AI, Apple Intelligence extended across apps, and Apple Reference Images, a feature designed to detect AI-generated photos.
The counter-case is unit math, and it is not trivial. Foldables have been available from competitors for years and still represent a small share of the market. Apple enters the category behind Samsung.
iPhone 18 Pro at $1,199 and the $100 ASP Lever
The volume story is not the foldable. It is the $100 price increase across the Pro line.
The iPhone 18 Pro starts at $1,199 and the Pro Max at $1,299, each a $100 increase over the iPhone 17 equivalents. The devices carry a similar look and feel to last year's models but add A20 Pro processors built on a 2-nanometer process, with improved CPU, GPU and neural engine performance for running games and on-device AI models. Battery life reaches 24 hours. The camera adds a variable mechanical aperture. New colours include glacier and burgundy, following the reception of last year's Cosmic Orange.
Run the revenue arithmetic. iPhone revenue was $54.25 billion in the June quarter alone. A $100 increase applied across the Pro and Pro Max mix — historically the majority of iPhone revenue even when it is not the majority of units — compounds through every quarter of the fiscal 2027 cycle.
The increase was not opportunistic. Component and memory costs have surged roughly 38% year over year, and pre-event analysis flagged the likelihood of 10% to 20% retail price increases across the 2026 lineup. Apple raised prices on Macs and iPads over the summer for the same reason. A $100 hike on a $1,099 base is a 9.1% increase — at the low end of the range the cost structure implied, which supports unit demand while limiting margin damage.
The company has done this before and it worked. Prices on the iPhone 16 and iPhone 17 were each raised by at least $100 to offset higher memory component costs, and neither cycle produced the demand destruction bears predicted.
The rest of the lineup was priced more conservatively. AirPods 5 held at $129, or $149 with a wireless charging case — the same price as the previous generation. Apple Watch Series 12 and Apple Watch Ultra 4 arrived with an all-new health sensing system, the S11 chip and Audio Intelligence, with the Ultra 4 starting at $799. Both watches and the AirPods reach stores Friday, September 18.
Holding accessory pricing flat while raising phone pricing is a deliberate mix decision.
The Leasing Program and the $58-a-Month Math
The least-discussed announcement may matter most to the fiscal 2027 revenue line.
Apple is now offering a way to lease a new phone. The Duo works out to approximately $58 monthly through the programme, against a $1,999 outright price.
That reframes the purchase decision entirely. A $1,999 sticker is a barrier for most of a 2.5 billion-device installed base. Fifty-eight dollars a month sits inside the range consumers already pay carriers for device financing, and it converts a capital decision into a subscription decision.
It also does something structurally important to Apple's revenue profile. Leasing turns hardware into a recurring payment stream, softens the cyclicality of the iPhone upgrade cycle, and keeps devices inside Apple's ecosystem rather than in the second-hand market. It is the hardware analogue of what Services did to the income statement over the past decade.
The margin consequences are less obvious and cut both ways. Leasing revenue recognition differs from outright sales, and financing carries balance-sheet and credit exposure Apple has historically avoided. Against that, a leased device is a device that returns, which supports a certified refurbished channel and a predictable replacement cadence.
The strategic logic connects to the pricing decision. Apple raised prices on the premium lineup by $100 and simultaneously introduced a mechanism that hides price from the monthly decision. Higher ASPs with lower perceived cost is the combination that lets the company push through 38% component inflation without losing units.
Whether it works shows up in the December quarter, and the December quarter is the one that includes the October 23 Duo launch and the full holiday period.
That timing is why guidance for the September quarter — 9% to 11% revenue growth with gross margin at 47% to 48% — is less informative than usual. The product cycle that matters starts after it closes.
Technicals: $344.57 Above, $315.34 Below, and a $305 Floor
The chart is constructive without being extended.
Apple at $319.14 sits 7.4% below its 52-week high of $344.57 and 41.2% above its 52-week low of $225.95. That places it in the upper third of its annual range with room before resistance.
The immediate levels are close. Wednesday's $315.34 close is the first support and it now carries additional weight as the launch-day settlement — the price at which the market marked the entire product cycle. Below it, $310 is the round-number shelf and roughly $305 marks where the stock consolidated through late August.
Above, $320 is the psychological handle Thursday's session is testing. Beyond that, the path toward $344.57 has no meaningful obstruction because the stock moved through that zone quickly on the way down from its highs.
The moving-average picture supports the constructive reading. Apple has gained roughly 21% year to date and 39.43% over twelve months, which means the medium-term trend is intact and the stock is above its longer-term averages by a comfortable margin.
Volume is the confirming variable. Wednesday's 64.7 million shares against a 53.7 million three-month average, followed by continued elevated turnover Thursday, indicates institutional repositioning around the product cycle rather than retail drift. Rising price on rising volume is the healthier combination.
The risk to the technical case is macro rather than company-specific. A 10-year at 4.90%, 62% to 64% odds on a Federal Reserve hike at the September 15–16 meeting, and Friday's consumer price index print all sit outside Apple's control. Consensus calls for 0.4% monthly headline CPI, 3.4% annually, with core at 2.4%. A hot core reading compresses every multiple in the index, and Apple trades at 36.28 times trailing earnings.
The stock's defence is that it generated $34.4 billion of operating cash flow in a single quarter. In a rate shock, near-term cash flow is the scarcest asset — which is precisely why Apple outperformed Thursday while AI infrastructure names like CoreWeave fell 5.49% and Astera Labs 5.60%.
Read More
-
Yen Stalls at 160 Despite a 3% JGB and Tokyo Core CPI at 2.0% — Intervention Sits at 164, Friday's Payrolls Decide
02.09.2026 · TradingNEWS ArchiveEnergy
-
Google Defends $327 as 82% Cloud Growth Collides With a $205B Spending Plan
10.09.2026 · TradingNEWS ArchiveStocks
-
XRP Token Defends $1.31 With Exchange Balances Down From 4B to Under 1.5B
10.09.2026 · TradingNEWS ArchiveCrypto
-
WTI Reclaims $100 With Supply Falling 4.3M Barrels a Day and Demand Down 1.6M
10.09.2026 · TradingNEWS ArchiveCommodities
-
S&P 500, Nasdaq and Dow Break Down a 4th Session as AVAV Rips 11% and Copper Miners Collapse
10.09.2026 · TradingNEWS ArchiveMarkets
-
GBP/USD Defends the 1.3524 Fibonacci Level With 2 Central Banks Meeting Next Week
10.09.2026 · TradingNEWS ArchiveForex
Q3 FY26: $109.42 Billion at a 50.1% Gross Margin
The June quarter, reported July 30 for the period ended June 27, was the strongest June quarter in Apple's history and it sets the fundamental baseline.
Revenue came in at $109.42 billion, up 16.4% from $94 billion a year earlier and above the $108.65 billion consensus. Diluted EPS reached $2.02, up 28.7%, with adjusted EPS of $1.91 against $1.89 expected. Net income climbed to $29.79 billion from $23.43 billion.
Gross margin hit 50.1%, up from 46.5% a year earlier and 80 basis points sequentially from 49.3%. Products margin improved to 40.1% from 38.7%, a 140-basis-point gain. Operating income rose 26.6% to $35.70 billion. Operating cash flow set a June-quarter record at $34.4 billion, up 23.3%.
The number that requires an asterisk: roughly 2 percentage points of that 50.1% gross margin came from tariff refunds, with a $0.11 benefit flowing to EPS. Products margin carried approximately 2.5 percentage points of refund benefit. Excluding the impact, the company would have landed in the middle of its guidance range rather than above it. That is not a trivial adjustment — it is the difference between a blowout and an in-line quarter.
Segment detail was mixed. iPhone delivered $54.25 billion, up 22% and ahead of the $53.86 billion estimate, with a June-quarter record in Greater China, a record number of upgraders, and an installed base at an all-time high. Mac surged nearly 29% to $10.35 billion against an $8.74 billion estimate, driven by the MacBook Neo — a low-cost laptop built around an iPhone chip introduced in March — and strong MacBook Pro sales. Wearables came in at $7.88 billion against $7.82 billion expected.
The misses were iPad at $6.19 billion against $6.92 billion, and Greater China total revenue at $18.8 billion against roughly $19.6 billion projected.
Operating expenses rose 22.9% to $19.08 billion, with R&D up 32.3% to $11.73 billion and SG&A up 10.5% to $7.35 billion. A 32% increase in research spending is what a company preparing a foldable and an AI platform looks like on the income statement.
The full release carries the segment tables.
Services at $30.7 Billion Carries 42.4% of Gross Margin — and It Missed
The most important line in Apple's financials is not iPhone. It is Services, and the June quarter showed the first genuine crack.
Services revenue reached $30.74 billion, up 12.1% year over year and representing 28.1% of total revenue. It missed the $31.22 billion consensus — the only major segment to come in below expectation on the top line while iPhone and Mac beat.
The margin contribution explains why the miss matters disproportionately. Services carried a 75.6% gross margin against Products at 40.1%. That means Services produced 42.4% of Apple's total gross margin on 28.1% of revenue. Every dollar of Services revenue is worth roughly 1.9 dollars of Product revenue in margin terms.
Services margin also declined, falling 110 basis points sequentially from 76.7% to 75.6% on unfavourable mix. Growth decelerated to low double digits, and management guided Services growth for the September quarter to the low teens.
The deceleration has become the key concern for long-term holders, and the reason is structural. Apple's valuation multiple — 36.28 times trailing earnings against a hardware business — has always been underwritten by the assumption that Services keeps compounding faster than the company overall, gradually shifting mix toward the 75% margin bucket. Services growing at 12% while total revenue grows at 16.4% inverts that assumption.
Together, iPhone and Services accounted for 77.7% of net sales. Products carried $78.7 billion of the revenue at 40.1% margin.
Regional performance was the offsetting positive. Every reported region grew, all by double digits, with Europe contributing the most new revenue at $5.4 billion — 35% of Apple's $15.4 billion in total growth. Emerging markets mostly grew double digits.
The installed base surpassed 2.5 billion active devices during the quarter, an all-time high across all major product categories and geographic segments. That number is the Services flywheel's fuel supply, and it is still expanding. The monetisation rate per device is the variable that slowed.
September Guidance: 47% to 48% Margin and a 6% After-Hours Drop
The stock fell more than 6% in extended trading after the June quarter, and the guidance is why.
Apple expects fourth-quarter fiscal 2026 revenue growth of 9% to 11% year over year, decelerating from 16.4%. Gross margin is guided to 47% to 48% — a compression of 210 to 310 basis points from the 50.1% just reported, supported by roughly one percentage point from tariff refunds and favourable product mix. Services growth is expected in the low teens. Foreign exchange is expected to hurt growth by 2.5 percentage points.
Management cited supply constraints explicitly, and the 10-Q language is blunter than the call: industry supply constraints and rising costs for components and AI computing resources are expected to intensify and may materially adversely affect revenue, costs and gross margin.
That is the bear case in the company's own words. Apple is not saying demand is soft. It is saying it cannot source enough components at a price that protects the margin.
The 38% year-over-year surge in memory and component costs is the mechanism. Every AI data centre being built is bidding for the same memory Apple needs for phones, and Apple has been the price-taker in that auction for two consecutive quarters. The Mac and iPad price increases over the summer were the first response. The $100 iPhone Pro increase is the second.
The strategic hedge is vertical integration. Apple has committed $600 billion to invest in the American supply chain, including roughly $30 billion partnering with Broadcom to design and manufacture custom silicon components and wireless connectivity technology. That reduces exposure to third-party pricing over a multi-year horizon and does nothing for the current fiscal year.
For the forecast, the guidance creates a specific setup. The September quarter, which reports in late October, will show margin compression and decelerating growth against a stock at 36 times earnings. The December quarter, which includes the October 23 Duo launch and the full holiday period at higher ASPs, is where the product cycle actually lands.
That timing gap is the risk between now and year-end.
$147 Billion in Cash and $33 Billion Returned in One Quarter
The balance sheet remains the reason Apple can absorb a cost shock that would break most hardware companies.
Apple ended the June quarter with $147 billion in cash and marketable securities against $84 billion of total debt — a net cash position of $63 billion. Cash, cash equivalents and restricted cash on the balance sheet stood at $39.5 billion after nine months of heavy distribution.
The cash generation is extraordinary at any scale. Operating cash flow reached $34.4 billion in the quarter, a June-quarter record even excluding tariff refunds, and roughly $117 billion across the first nine months of fiscal 2026 against $81.8 billion in the same period a year earlier — a 43% increase.
Capital return continued at full pace. Apple returned $33 billion to shareholders in the quarter: $25.8 billion through share repurchases and $4 billion in dividends and equivalents. Across nine months, the company spent $62.1 billion on buybacks and $11.8 billion on dividends. The board declared a quarterly dividend of $0.27 per share, paid August 13 to holders of record August 10.
The dividend yield is negligible at roughly 0.34% on a $319 share price. The buyback is the real return mechanism, and $62.1 billion of repurchases against a $4.602 trillion market capitalization retires roughly 1.35% of the company annually at current prices — a meaningful contributor to EPS growth independent of operating performance.
Nine-month figures put the full-year run rate in view: net sales of $364.36 billion and net income of $101.46 billion. Apple is on track to clear $480 billion of revenue and $135 billion of net income for fiscal 2026.
The contrast with the AI infrastructure cohort is the point. Alphabet is spending $195 billion to $205 billion in capex this year and has seen free cash flow margin fall to 9.2%. Apple converts operating cash flow into buybacks and dividends at a rate that requires no faith in a payback period.
In a session where the 10-year hit 4.90%, that distinction is worth 190 basis points of relative performance.
Valuation: 36.28 Times Earnings on a $4.602 Trillion Company
The valuation is the strongest argument against the stock and it is not close.
Apple trades at a trailing price-to-earnings ratio of 36.28 with a forward multiple close to 36 — well above its three-year average of roughly 30. On a $4.602 trillion market capitalization, that is a 20% premium to the company's own recent history, applied to a business guiding to 9% to 11% revenue growth and 210 to 310 basis points of margin compression next quarter.
The sell-side consensus reflects the tension. Across 44 covering analysts the average rating is Buy, but the twelve-month average price target sits at $324.53 — just 2.89% above the current price at the time it was compiled. An alternative aggregate puts the target at $330.61. The dispersion is wide, running from roughly $290 at the low end to $400 at the high end, with individual targets published this week clustering between $296 and $370.
An average target 3% above spot is not a bullish signal. It is a covering community that has already priced the product cycle.
The bull framing is that Apple has earned the premium through execution: 16.4% revenue growth at a 50.1% gross margin, a 2.5 billion-device installed base at an all-time high, $34.4 billion of quarterly operating cash flow, and a genuinely new product category launching into the holiday quarter. Apple has expanded rather than contracted its addressable market.
The bear framing is arithmetic. At 36 times earnings with Services decelerating to 12%, tariff refunds inflating the reported margin by 2 percentage points, and component costs up 38%, the multiple assumes the Duo works. If foldables stay a niche and Services keeps decelerating, the fair multiple is closer to the 30 three-year average — which implies roughly $265 rather than $319.
Earnings will have to justify the multiple going forward. The next report, covering the September quarter, arrives in late October.
The 2.2% Problem: How Small the Foldable Market Actually Is
The most substantive objection to the entire thesis is category size, and the numbers are sobering.
Foldables are projected to account for 2.2% of global smartphone units in 2026, rising to just 3.1% by 2030. Foldable phones have been available from competitors for many years and still represent a small single-digit share of total handsets — which one reading interprets as evidence of weak consumer demand for the form factor rather than an untapped opportunity.
Apple is entering this category behind Samsung, whose Galaxy Fold line is now in its seventh generation.
The counterargument runs on revenue rather than units. Higher average selling prices mean foldables make up a substantially larger revenue share than unit share: 6.9% of global smartphone revenue in 2026, rising to 10% by 2030. Apple does not need to sell foldables in iPhone-like volumes at a $1,999 entry price for the category to matter to the income statement.
Apply that to Apple's own numbers. iPhone generated $54.25 billion in a single quarter. If the Duo captures 10% of fiscal 2027 iPhone revenue — the revised estimate published after the pricing was revealed, doubled from an initial 5% — that is roughly $22 billion annually at margins above the iPhone average, given the price point.
The characterisation that has gained traction is that the Duo represents Apple's biggest new hardware category since the Watch and AirPods, and the first Apple product in a decade capable of moving the needle. The device also opens a larger addressable market where a foldable screen enables iPad-like productivity in a phone form factor.
The honest assessment sits between the two. A $1,999 device in a category that is 2.2% of units and 6.9% of revenue is not going to re-rate a $4.6 trillion company on its own. What it can do is raise blended iPhone ASPs, extend the premium tier, reduce the cannibalisation risk from iPad, and give the new chief executive a credibility win.
Whether that is worth 36 times earnings is the open question.
Regulation, Costs, and the Risks Apple Itself Flagged
The quarterly filing lists the exposures, and they are not small.
Apple has been fined €500 million under the European Union's Digital Markets Act, with potential additional EU penalties reaching up to 10% of annual worldwide net sales. On a revenue base tracking toward $480 billion, that theoretical ceiling is $48 billion. Ongoing Department of Justice litigation alleging monopolization or attempted monopolization in the market for performance smartphones remains live, alongside Epic-related App Store litigation.
The App Store cases are the ones that touch Services directly. Services generated $30.74 billion at a 75.6% gross margin and produced 42.4% of Apple's total gross margin. Any remedy that compresses App Store take rates hits the single most valuable margin pool the company has, and it does so in the segment already decelerating to 12% growth.
The cost side is the more immediate pressure. Component and memory costs rose roughly 38% year over year, and the company's own filing warns that industry supply constraints and rising costs for components and AI computing resources are expected to intensify. The September-quarter margin guidance of 47% to 48% quantifies the first instalment.
Apple's response has been price increases and vertical integration. The $100 hikes across iPhone 18 Pro and Pro Max, the summer increases on Mac and iPad, and the $600 billion U.S. supply chain commitment including roughly $30 billion with Broadcom for custom silicon are all the same strategy expressed at different time horizons.
The tariff dynamic is the wildcard. Tariff refunds added approximately 2 percentage points to gross margin and $0.11 to EPS in the June quarter, and roughly 1 percentage point is embedded in September-quarter guidance. Those refunds are a policy artefact, not an operating result, and they will eventually stop.
Adjacent to the core business, Apple continues extending the Services surface. Health app users in the United States can now order a tailored laboratory test panel covering more than 50 measures through a diagnostics partner — a small line item that shows where Services growth is meant to come from next.
Verdict and Forecast: A Genuine Product Cycle at a Demanding Multiple
AAPL at $319.14, up 1.20% while the Nasdaq fell 0.71%, is a stock that just got the two things it needed and still trades at a price that assumes both work perfectly.
What it got: a foldable priced $300 to $500 below investor expectations and one dollar under Samsung's competing device, establishing a $1,999 tier that did not previously exist. A $100 increase across the Pro line that pushes through 38% component inflation while sitting at the low end of the 10% to 20% range the cost structure implied. A leasing programme that converts a $1,999 sticker into $58 a month against a 2.5 billion-device installed base. And a day-after gain that broke a pattern holding since 2007.
What it already has: $109.42 billion of quarterly revenue growing 16.4%, a 50.1% gross margin, $34.4 billion of quarterly operating cash flow, $147 billion of cash against $84 billion of debt, and $33 billion returned to shareholders in three months.
What argues against it: a 36.28 trailing multiple against a three-year average near 30. Services decelerating to 12.1% growth and missing consensus while carrying 42.4% of gross margin. Two percentage points of that headline margin coming from tariff refunds rather than operations. September guidance of 9% to 11% growth with margin compressing to 47% to 48% and management naming supply constraints explicitly. A consensus price target of $324.53 sitting 1.7% above spot. And a foldable category that is 2.2% of global units.
The forecast splits by horizon. Into late October, the range is $305 to $344.57, with $315.34 the launch-day floor and the 52-week high the ceiling. The September-quarter print will show decelerating growth and compressing margin against a demanding multiple — that report is a risk event, not a catalyst. Friday's CPI and next week's Fed decision are the near-term macro risks, and at 36 times earnings Apple is not insulated from a discount-rate move.
Beyond that, the December quarter is the one that matters. It captures the October 23 Duo launch, the full holiday period at $100 higher Pro pricing, and the first read on leasing adoption. If Duo tracks toward 10% of fiscal 2027 iPhone revenue and Services stabilises above 12%, $344.57 falls and the $370 to $400 upper targets become reachable. If foldable demand disappoints and Services keeps slowing, the three-year average multiple implies the mid-$260s.
Holding into the Duo launch is the trade. Adding above $325 before the October print is not.