





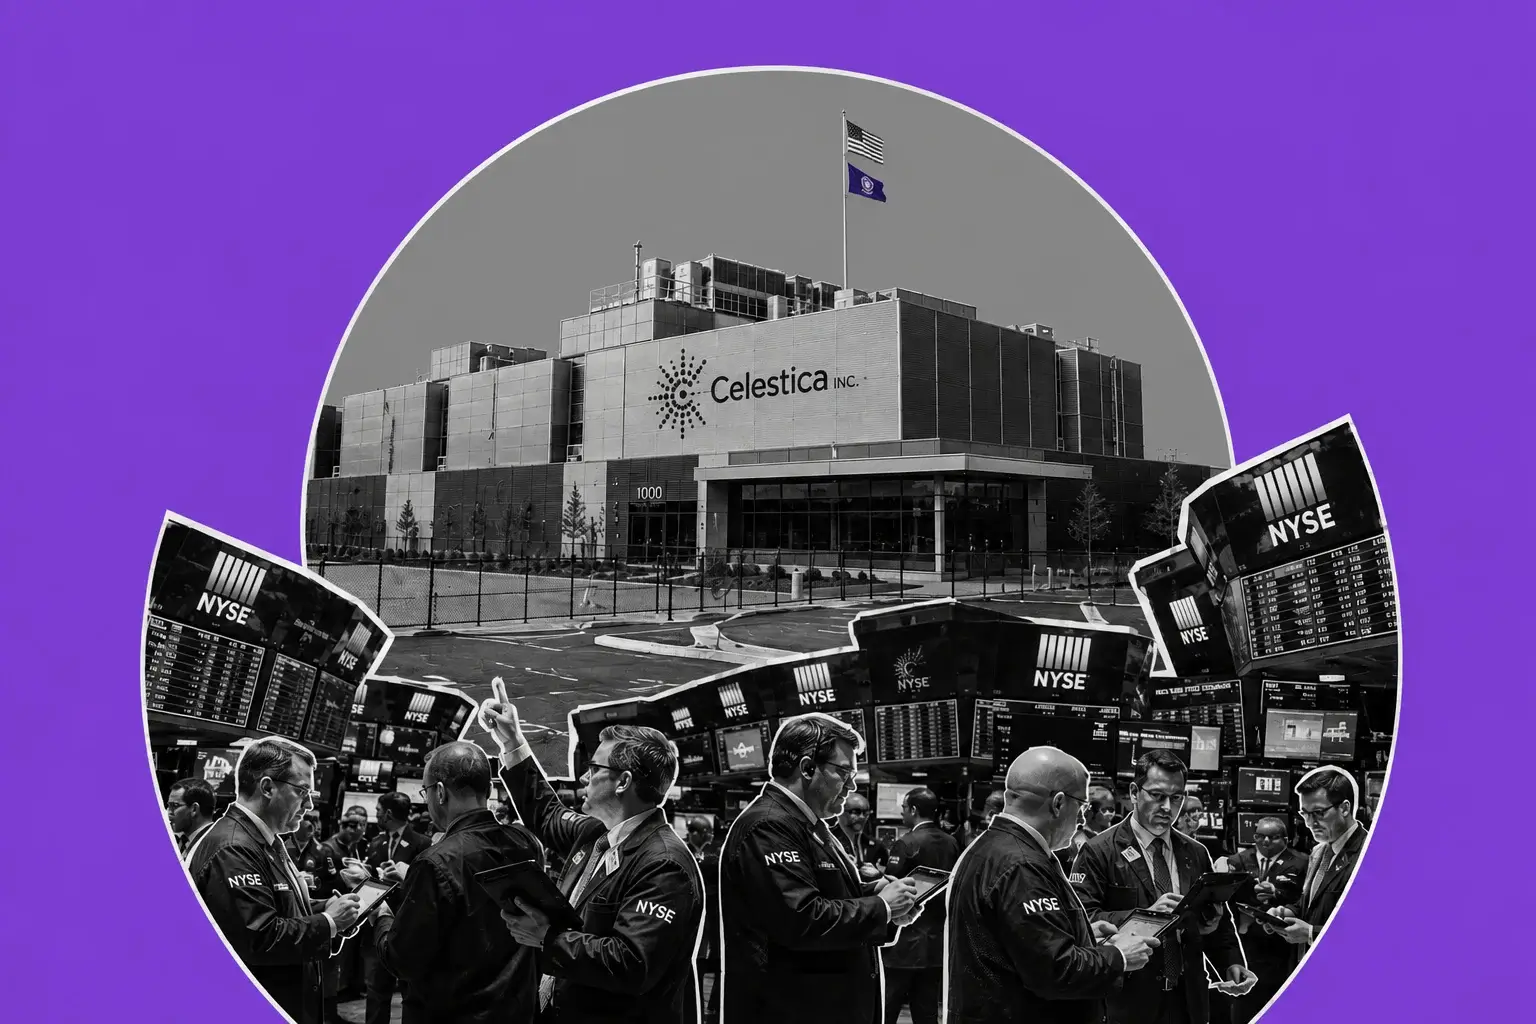
Celestica Holds $298 With 2026 Guidance At $20.5B And $11.30 EPS — $302 Or $290 Decides The Next Move
Second-quarter adjusted operating margin expanded to 8.2% and CCS revenue reached $3.81B at an 8.7% segment margin | That's TradingNEWS
Key Points
- CLS closed $298.70, sitting 36.8% below the $472.40 all-time high set June 2.
- Q2 revenue rose 62% to $4.70 billion with adjusted EPS of $2.54, both above guidance.
- The stock trades 26.4x guided 2026 adjusted EPS of $11.30 against 36.65x trailing.
Celestica (NYSE: CLS) closed Monday at $298.70 with a day range of $296.42 to $302.08 and bid/ask at $298.60 by $299.75. Market capitalization stands at $37.76 billion on 126.11 million shares outstanding. Volume ran 1 million against a 2 million average.
The 52-week range tells the story: $183.66 to $474.03. The all-time closing high was $472.40 on June 2, 2026. At $298.70 the stock sits 36.8% below that peak.
None of that drawdown came from the business deteriorating. Second-quarter revenue of $4.70 billion rose 62% year over year. GAAP earnings per share hit $3.17 against $1.82. Adjusted operating margin expanded to 8.2% from 7.4%. Both revenue and adjusted EPS came in above the high end of guidance — for the second consecutive quarter.
The company raised its 2026 outlook twice this year, and the current guidance calls for $20.5 billion in revenue, adjusted EPS of $11.30, an 8.4% adjusted operating margin and $600 million of free cash flow. Third-quarter revenue is guided to $5.25 billion to $5.55 billion with adjusted EPS of $2.88 to $3.08.
What produced the de-rating was a combination of multiple compression and a major equity raise that diluted existing holders. The stock moved into a bear market during that stretch, and the Toronto listing tumbled to C$407 before closing Monday at C$415.07.
The thesis for this forecast: Celestica is a beat-and-raise story trading at a beat-and-lower multiple, and the gap between those two facts is the trade. At $298.70 against $11.30 of guided 2026 adjusted EPS, the stock changes hands at 26.4 times this year's earnings — against a normalized trailing multiple of 36.65 and a price-to-sales ratio of 2.22.
The complication arrives today. Beta stands at 2.04, and Nasdaq 100 futures are down 1.11% with the 10-year Treasury at 4.786% and Federal Reserve hike odds at 66.4%.
A twice-market-beta AI hardware name in a duration shock does not get to trade its own fundamentals.
Two Quarters Of Beats And Two Guidance Raises
The operating record this year has been close to flawless, and the specifics matter because the stock has ignored them.
First-quarter revenue reached $4.05 billion, up 53% from $2.65 billion in the prior-year period. GAAP earnings from operations came in at 6.7% of revenue against 4.9%. Adjusted operating margin was 8.0% versus 7.1%. GAAP EPS hit $1.83 against $0.74, and adjusted EPS reached $2.16 against $1.20 — above the high end of the guidance range. The company raised its 2026 annual outlook on that print.
Second quarter revenue reached $4.70 billion, up 62% from $2.89 billion. GAAP earnings from operations improved to 9.8% of revenue from 9.4%. Adjusted operating margin expanded to 8.2% from 7.4%. GAAP EPS hit $3.17 against $1.82 and adjusted EPS reached $2.54 against $1.39. Both revenue and adjusted EPS again came in above the high end of guidance, and the company raised the annual outlook a second time while stating it expects growth to accelerate in 2027.
Two quarters, two beats on both lines, two raises. Adjusted EPS grew 80% in the first quarter and 83% in the second.
The margin trajectory is the underappreciated part. Adjusted operating margin moved from 7.1% to 8.0% to 8.2% across those periods, with full-year guidance now at 8.4%. For a contract manufacturer historically valued on thin single-digit margins, that expansion changes the earnings power materially — every 10 basis points on $20.5 billion of revenue is $20.5 million of operating profit.
The 2025 baseline frames the acceleration. Full-year 2025 revenue was $12.39 billion, up 28.46% from $9.65 billion, with earnings of $832.50 million, up 94.51%. The 2026 guidance of $20.5 billion represents 65.5% growth on top of that.
Management has flagged component constraints affecting revenue and EPS growth in recent quarters, with those constraints expected to resolve in upcoming periods — leading to a catch-up in revenue and a re-acceleration of EPS growth.
That is a company saying the reported numbers are understating underlying demand.
The Back-Loaded Guidance That Nobody Is Modelling
Run the arithmetic on the annual outlook and a specific problem emerges.
First-half revenue totalled $8.75 billion — $4.05 billion in the first quarter plus $4.70 billion in the second. Third-quarter guidance has a midpoint of $5.40 billion, taking nine-month revenue to $14.15 billion. Against a full-year target of $20.5 billion, that implies fourth-quarter revenue of $6.35 billion.
That is an 18% sequential step from the third-quarter midpoint and a 35% step from the second quarter.
The earnings math is steeper. First-half adjusted EPS came to $4.70, combining $2.16 and $2.54. Third-quarter guidance has a midpoint of $2.98, taking nine-month adjusted EPS to $7.68. Against the full-year target of $11.30, the implied fourth quarter is $3.62 — a 21% sequential increase.
Guidance is heavily back-loaded, and that is both the bull case and the risk.
The bull reading is that management has visibility. The company has stated it maintains high visibility through 2028 with a strong pipeline of program wins in a robust demand environment. A fourth quarter of $6.35 billion is not a hope; it is a schedule of committed programs ramping as component constraints ease.
The bear reading is that a fourth-quarter step of that size leaves no margin for error. Any component slippage, any hyperscaler pushing a delivery into the first quarter of 2027, and the annual number misses despite two consecutive raises. Project-driven hardware businesses miss on timing far more often than on demand.
The market appears to be trading the second reading. A stock that beat guidance twice and raised twice does not fall 36.8% from its high unless investors are discounting the back half.
Third-quarter results are the checkpoint. Delivering the $5.25 billion to $5.55 billion range with adjusted EPS in the $2.88 to $3.08 band keeps the annual target credible. Coming in at the low end pushes the implied fourth quarter above $6.5 billion and makes the full-year figure arithmetically difficult.
At $298.70 against $11.30 of guided earnings, the stock trades 26.4 times a number the market does not fully believe.
CCS At $3.81 Billion And 84% Growth Is The Entire Story
The segment split shows exactly where the business is and where the risk sits.
Connectivity and Cloud Solutions delivered $3.81 billion in second-quarter revenue, up 84% year over year, at an 8.7% segment margin. Advanced Technology Solutions contributed $0.89 billion, up 8%, at a 6.3% margin.
CCS is 81% of revenue and produced essentially all of the growth.
The composition of that segment explains why. CCS covers Communications and Enterprise end markets, with Enterprise comprising the servers and storage businesses. This is the AI data center exposure — networking switches, server platforms and storage systems built for hyperscalers scaling out compute capacity.
The 8.7% segment margin is the number that separates Celestica from traditional contract manufacturing. Standard electronics manufacturing services businesses earn 3% to 5%. Earning 8.7% means the company is selling hardware platform solutions and design services rather than pure assembly — it owns intellectual property in the switch and server platforms rather than simply building someone else's design.
Advanced Technology Solutions is the ballast. It covers Aerospace and Defense, Industrial, HealthTech and Capital Equipment, with Capital Equipment spanning semiconductor, display and robotics equipment. At $0.89 billion growing 8% with a 6.3% margin, it is a stable, diversified, unexciting business.
The structural risk is stated plainly by the market: heavy reliance on a small number of hyperscaler customers combined with the dominance of the CCS segment means any slowdown in AI or cloud orders weakens the narrative quickly.
That concentration cuts both ways. A single hyperscaler expanding a program adds hundreds of millions of revenue. A single hyperscaler pausing removes it just as fast.
The recent market debate around one large platform company selling excess data center capacity was read by some as evidence hardware demand is cooling. The counterargument is that the situation is specific to that company's own build-out rather than a signal about the broader spending cycle.
Celestica's third-quarter guidance answers it directly.
The Equity Raise That Broke The Chart
The de-rating had a specific trigger and it was not an earnings miss.
Celestica executed a major equity raise in August, and the stock moved into a bear market as traders reacted to that dilution alongside the earnings report. The Toronto listing tumbled to C$407, down nearly 40% from its highest point. Coverage at the time framed the raise as bolstering readiness for fiscal 2027.
Share count now stands at 126.11 million against a $37.76 billion market capitalization.
Dilution is straightforward arithmetic. New shares issued at a discount reduce earnings per share for every existing holder, and in a stock where the entire valuation case rests on an EPS trajectory from roughly $10 in 2026 toward $15 in 2027 and $19 in 2028, any dilution compresses that path.
The offsetting argument is what the capital funds. Celestica is scaling from $12.39 billion of revenue in 2025 to a guided $20.5 billion in 2026 with a further acceleration signalled for 2027. Growth at that rate consumes working capital — inventory, receivables and manufacturing capacity all expand ahead of the revenue they support. Component constraints make that worse, because securing supply requires prepaying or carrying larger buffers.
Funding that expansion with equity rather than debt is defensible in a market where the 10-year Treasury sits at 4.786%, the 30-year is at 2007 levels and corporate issuance is competing with a $40 trillion federal debt load. Equity is expensive at a compressed multiple; debt is expensive at these rates. There is no cheap option.
Free cash flow guidance of $600 million for 2026 provides context on the internal funding capacity. Against $20.5 billion of revenue, that is a 2.9% conversion — respectable for a manufacturer scaling this fast, and insufficient to self-fund the working capital build alone.
The market's reaction was correct in direction and arguably excessive in magnitude. A dilutive raise justifies a lower price. A 36.8% drawdown from the all-time high, on a company that beat and raised twice, is a repricing of the multiple rather than a repricing of the raise.
Separating those two effects is what determines whether $298.70 is a discount or a fair level.
Valuation: 26.4x Guided 2026 Against 36.65x Trailing
The multiple arithmetic is where the debate resolves, and it depends entirely on which earnings number you use.
At $298.70 against guided 2026 adjusted EPS of $11.30, the stock trades 26.4 times this year's earnings. The normalized trailing price-to-earnings ratio sits at 36.65. Price-to-sales is 2.22. There is no dividend.
The forward path extends the compression. Published estimates trace EPS from roughly $10 in 2026 to $15 in 2027, $19 in 2028 and $26 in 2029. On the 2027 figure, $298.70 implies just under 20 times. On 2028, roughly 16 times. On 2029, under 12 times.
For a company guided to grow revenue 65.5% this year with an accelerating 2027 and visibility through 2028, that is not an expensive multiple by any conventional measure.
The bear valuation case turns on the reliability of those estimates rather than the arithmetic. An EPS trajectory that quadruples from $10 to $26 in four years assumes AI infrastructure spending compounds without interruption, that hyperscaler concentration does not bite, that adjusted operating margin holds above 8%, and that no further dilution occurs. Every one of those is a live question.
The sell-side positioning reflects genuine disagreement rather than consensus. Published price targets over the past month have spanned $406 at the low end to $477 at the high, with a $430 target reaffirmed following the equity raise and one target cut to $406 from $430. Ratings have ranged from Buy to Overweight, with mean target estimates cited between $426 and $477 depending on the aggregation date.
The broader survey is more divided than headline ratings suggest. Across the past year, 14 analysts issued Buy recommendations and 12 issued Sell — an almost even split on a stock carrying a Strong Buy headline consensus from a different sample.
The recurring valuation objection is straightforward: it trades at a high multiple and it comes down to how much you want to pay for AI capital expenditure exposure with a beta of 2.04.
At 26.4 times guided earnings after a 36.8% drawdown, the price paid for that exposure is materially lower than it was in June.
Beta 2.04 Into A 4.786% Ten-Year Is The Immediate Problem
The macro overlay is doing most of the work in this stock right now, and today it is working against it.
Beta stands at 2.04 — twice the volatility of the Toronto benchmark. Every major sovereign curve broke to a multi-decade extreme on Tuesday. The US 10-year Treasury reached 4.786%, the highest since January 2025. The 30-year hit 2007 levels. Japan's 10-year struck 3.00% for the first time since 1996. Germany's Bund pushed to a 2011 high of 3.3546%.
CME FedWatch prices a 25 basis point Federal Reserve hike at the September 15-16 FOMC meeting at 66.4%, up from 39.6% a week ago, after a Jackson Hole keynote that put PCE inflation at 3.7% year over year and 4.1% annualized over six months.
Nasdaq 100 futures are down 1.11%. The VanEck Semiconductor ETF is off more than 1%, with Nvidia, AMD and Micron each down more than 1%. Dow futures are down 0.59% — the growth complex taking nearly double the hit of the cyclical complex, which is the signature of a discount-rate shock rather than a growth scare.
For Celestica, that configuration is directly hostile. The stock's valuation rests on an EPS trajectory reaching $26 by 2029, which means the majority of its present value sits in cash flows three to five years out. A synchronized global repricing of the risk-free rate compresses those cash flows mechanically, and a 2.04 beta amplifies the compression.
The offsetting consideration is that the demand driver is rate-insensitive. Hyperscaler capital expenditure is funded by operating cash flow at companies with enormous balance sheets, and the financing structures now circulating for AI compute show capital adapting rather than stalling. Celestica's programs are contracted with visibility through 2028.
The demand is durable. The multiple is not.
That distinction explains how a company can beat guidance twice, raise its outlook twice, and still trade 36.8% below its high. It also explains the sharper observation embedded in the drawdown: the stock has fallen 18% over 90 days despite delivering better numbers than it guided.
Business execution and share price have been moving in opposite directions since June.
Technical Structure: $296.42 Held, $302.08 Capped
The chart is in a confirmed downtrend and currently testing a narrow band.
Monday's session ran $296.42 to $302.08 with a close at $298.70 — a range of just $5.66, or 1.9%, on volume of 1 million against a 2 million average. That is a compressed, low-participation session, which typically precedes a directional resolution.
The reference levels are close and well defined. The $296.42 session low is immediate support, with the $290 handle beneath it and then $283 as the next structural marker. The August 20 close at $302.00 sits directly above, followed by the $302.08 session high and then the $310 area.
The larger structure is bearish. The all-time closing high of $472.40 was set June 2, 2026. The stock has traded down to $298.70 since — a 36.8% decline over three months, with a documented 18% drop across 90 days and an acceleration into bear-market territory during August on the earnings and dilution reaction.
The 52-week low at $183.66 sits 38.5% beneath current price. The 52-week high at $474.03 sits 58.7% above.
That is an enormous range and it reflects a stock that has been repriced twice in twelve months — up on the AI infrastructure revaluation and back down on multiple compression.
For the recovery case, the sequence to watch is straightforward. Reclaiming $302.08 clears Monday's high. Above that, $310 and then the mid-$330s where the stock consolidated before the August decline. The published price targets clustering between $406 and $477 require moves of 36% to 60% and are not near-term references.
Volume is the tell to monitor. At 1 million against a 2 million average, participation has thinned considerably. Declines on falling volume are distribution exhausting rather than accelerating. A reversal needs volume to expand on the upside, and it has not yet.
For anyone trading this technically, note that the Toronto listing at C$415.07 and the New York listing at $298.70 track the same asset through a currency that has its own volatility. The USD/CAD move adds noise to any cross-listing comparison.
Competition: Flex, Jabil And The Hardware Platform Distinction
Celestica competes across a spectrum where its positioning differs materially from the peer group it is usually screened against.
The traditional comparison set is electronics manufacturing services: Flex (FLEX), Jabil (JBL), Sanmina (SANM), Benchmark Electronics and Plexus. Those businesses earn 3% to 5% operating margins on assembly and supply chain execution, and they trade at multiples consistent with that economics.
Celestica's CCS segment earned 8.7% in the second quarter. That is roughly double the traditional EMS margin, and the reason is the hardware platform solutions business — developing infrastructure platforms, hardware and software design solutions including open-source software that can be used as-is or customized, rather than building to someone else's print.
Owning the platform design changes the customer relationship and the margin structure. It also raises the switching cost, because a hyperscaler that qualified a Celestica-designed switch platform cannot move it to a competitor without requalification.
On the optics and interconnect side, the comparison set includes Fabrinet (FN), Coherent and Astera Labs — companies levered to the same AI infrastructure spending through different layers of the stack. Those names have been correlated with Celestica through the entire 2026 drawdown, with the optical and memory complex hitting resistance since the summer.
The switching demand specifically has been cited as the driver of upgrades — strong AI-driven demand for ethernet switching supporting a 50% earnings growth path to 2028.
The company has also been noted for a recent collaboration with AMD, extending its platform exposure beyond the incumbent accelerator ecosystem.
The structural vulnerability remains customer concentration. Celestica operates 50 sites across 15 countries under CEO Robert Mionis, but the revenue is concentrated in a handful of hyperscaler relationships within CCS. Changes in customer procurement methods have been flagged as a specific margin risk — if a hyperscaler moves from a turnkey model to consigned components, revenue drops even when unit volumes hold.
That is a real and underappreciated risk. It does not require demand to fall; it only requires the commercial structure to change.
For sector exposure, the semiconductor ETFs track the same cycle with more diversification and less single-customer risk.
Read More
-
Yen Stalls at 160 Despite a 3% JGB and Tokyo Core CPI at 2.0% — Intervention Sits at 164, Friday's Payrolls Decide
02.09.2026 · TradingNEWS ArchiveEnergy
-
QQQ ETF ($706.22) Slides 7.4% Below Its High as the Market Reprices the AI Capex Bill — $686.57 Target if $700 Breaks
22.10.2026 · TradingNEWS ArchiveStocks
-
XRPI ($7.00) and XRPR ($10.74) Slide Toward 52-Week Lows as Spot XRP ETF Flows Stall at $708,510
22.10.2026 · TradingNEWS ArchiveCrypto
-
NG ($2.775) Decoupled From Europe’s €88 Gas Crisis as LNG Feedgas Hits 18.9 Bcf/d — $3.30 Upside on Cold Weather
22.10.2026 · TradingNEWS ArchiveCommodities
-
Dollar-Yen (157.35) Loses 157.65 as the Yen Rallies on Haven Demand — 155 Target if 156 Breaks
22.10.2026 · TradingNEWS ArchiveForex
What The Third Quarter Has To Deliver
The next print is the checkpoint that determines whether the current price is a discount or a warning.
Guidance calls for revenue of $5.25 billion to $5.55 billion and adjusted EPS of $2.88 to $3.08. The midpoints are $5.40 billion and $2.98. Against second-quarter revenue of $4.70 billion, the midpoint implies 15% sequential growth.
Three specific disclosures decide the reaction.
First, the revenue print relative to the range. Coming in at or above the high end — consistent with the pattern of the past two quarters — keeps the $20.5 billion annual target credible and supports the implied fourth quarter of $6.35 billion. Landing at $5.25 billion pushes the required fourth quarter above $6.5 billion and makes the annual figure arithmetically strained.
Second, adjusted operating margin. Full-year guidance is 8.4% against 8.2% delivered in the second quarter and 8.0% in the first. That implies the back half runs above 8.4% to hit the annual average. Margin expanding through a period of rapid revenue scaling and component constraints is the operational test, and it is the metric most likely to disappoint if input costs or expedite fees rise.
Third, the component constraint commentary. Management has said constraints affecting revenue and EPS growth are expected to resolve in upcoming quarters, producing a catch-up in revenue and a re-acceleration of EPS. Any language extending that timeline pushes the back-loaded guidance further right.
The secondary items are the CCS segment growth rate against the 84% delivered in the second quarter, and any update on the 2027 acceleration management flagged alongside the second-quarter release.
The historical reaction pattern is not encouraging for bulls. The stock fell into a bear market after the second-quarter beat-and-raise, because the market focused on the equity raise rather than the numbers. Two consecutive quarters of exceeding the high end of guidance have produced a 36.8% drawdown from the June high.
That establishes the asymmetry. A beat gets sold if the market is focused on something else. A miss gets punished either way.
Downside Map: $290, $283 And The Path Toward $250
The bear case has clear levels and a defined catalyst set.
The first requirement is a close below Monday's $296.42 low. That breaks the narrow band the stock has been holding and opens the $290 handle.
Beneath $290, the next structural marker is $283, and below that the stock enters territory it last occupied earlier in the year. The $250 area becomes the reference if the decline extends, and the 52-week low at $183.66 is 38.5% below current price — a level reached before the AI infrastructure revaluation.
The catalyst set is specific and near-term. A Federal Reserve hike on September 16, currently 66.4% priced, compresses the multiple on a 2.04-beta name whose value sits in 2028 and 2029 cash flows. A payroll beat above the 55,000 consensus on Friday takes the 10-year through 4.80% and starts that process early.
Company-specific triggers carry more weight. Third-quarter revenue at the low end of the $5.25 billion to $5.55 billion range makes the implied fourth quarter of $6.35 billion look unreachable. Adjusted operating margin coming in beneath 8.2% would break the expansion trend that has driven the earnings acceleration. And any extension of the component constraint timeline pushes revenue recognition into 2027.
The structural risk that would do the most damage is customer-driven. Heavy reliance on a small number of hyperscalers in a segment producing 81% of revenue means a single program pause or a shift in procurement model removes hundreds of millions of revenue without warning. The market debate around excess data center capacity being resold is a reminder that hyperscaler build plans are revised more often than they are announced.
The mitigating consideration is that a substantial amount of bad news is already priced. The stock is 36.8% off its June high, trades at 26.4 times guided 2026 earnings against 36.65 normalized trailing, and carries a price-to-sales ratio of 2.22 on a business growing revenue 65.5% this year.
Falling further from here requires the guidance itself to break, not just the multiple.
Upside Map: $302, $335 And The Route Back Toward $400
The recovery path requires clearing levels in sequence and each has recent history.
The first is $302.08, Monday's session high, which also sits just above the August 20 close of $302.00. Reclaiming and holding it clears the immediate consolidation.
Above that, $310 is the next reference, followed by the mid-$330s where the stock traded before the August decline accelerated. That zone represents the pre-dilution consolidation area and is the level that would signal the equity raise has been fully absorbed.
Beyond it, the published target band opens up. Price targets over the past month have clustered between $406 and $477, with $430 reaffirmed following the raise. From $298.70, reaching $406 is a 35.9% move and $477 is a 59.7% move. The all-time high at $472.40 sits 58.1% above.
The catalyst required is a third quarter that validates the back-loaded guidance. Revenue at or above the high end of $5.55 billion with adjusted EPS at or above $3.08, adjusted operating margin holding above 8.4%, CCS growth sustaining near 84%, and component constraints confirmed as easing.
The structural argument beneath it is genuinely strong. Revenue guided to grow 65.5% to $20.5 billion. Adjusted EPS at $11.30 with a path toward $15 in 2027 and $19 in 2028. Adjusted operating margin expanding from 7.1% to a guided 8.4%. Free cash flow of $600 million. High visibility through 2028 on a strong pipeline of program wins. Growth explicitly expected to accelerate in 2027.
At 26.4 times guided 2026 earnings and under 20 times 2027, a company delivering that growth profile does not obviously belong at a compressed multiple.
The macro condition is the constraint. This stock does not re-rate while the 10-year is making new highs and the Federal Reserve is two-to-one priced to hike. The multiple expansion required for a move toward $400 needs the rate path to stabilise first.
That makes September 16 the gating event for the upside, and the third-quarter print the gating event for the earnings case.
Forecast: Discount Is Real, Timing Is Not
Weighting the evidence produces a clear conclusion and a set of levels.
The business case is intact and improving. Two consecutive quarters above the high end of guidance on both revenue and adjusted EPS. Two annual guidance raises. Revenue growing 53% then 62% year over year. Adjusted operating margin expanding from 7.1% to 8.2% with 8.4% guided for the full year. CCS revenue up 84% to $3.81 billion at an 8.7% segment margin. A 2026 outlook of $20.5 billion revenue, $11.30 adjusted EPS and $600 million free cash flow. Growth explicitly expected to accelerate in 2027 with visibility through 2028.
The valuation case supports it. At $298.70 the stock trades 26.4 times guided 2026 adjusted EPS, against a 36.65 normalized trailing multiple and a 2.22 price-to-sales ratio. On the published 2027 path it trades under 20 times.
The problems are timing and structure. Guidance is heavily back-loaded, implying fourth-quarter revenue of $6.35 billion and adjusted EPS of $3.62 — sequential steps of 18% and 21% from the third-quarter midpoints. Customer concentration in a segment producing 81% of revenue is a single point of failure. The August equity raise diluted the EPS path that underpins the entire valuation. And a 2.04 beta into a 4.786% 10-year with 66.4% Fed hike odds means the multiple compresses regardless of execution.
Near-term verdict: neutral. The stock has spent three months falling on good news, and nothing in the macro setup this week changes that. A 2.04-beta AI hardware name does not bottom while Nasdaq futures are down 1.11% and the entire semiconductor complex is off more than 1%.
Levels. Downside: $296.42 is Monday's low, $290 the first handle beneath, $283 the next structural marker. Upside: $302.08 and $310 are the immediate tests, the mid-$330s the pre-decline consolidation zone.
Medium-term verdict: constructive, conditional on the third-quarter print. Revenue at or above $5.55 billion with adjusted operating margin holding above 8.4% validates the $20.5 billion annual target and makes 26.4 times guided earnings look cheap against a 65.5% growth rate. Revenue at the low end makes the implied fourth quarter unreachable and takes the stock toward $250.
Own the demand story. Wait for the rate shock to clear before paying for it.




