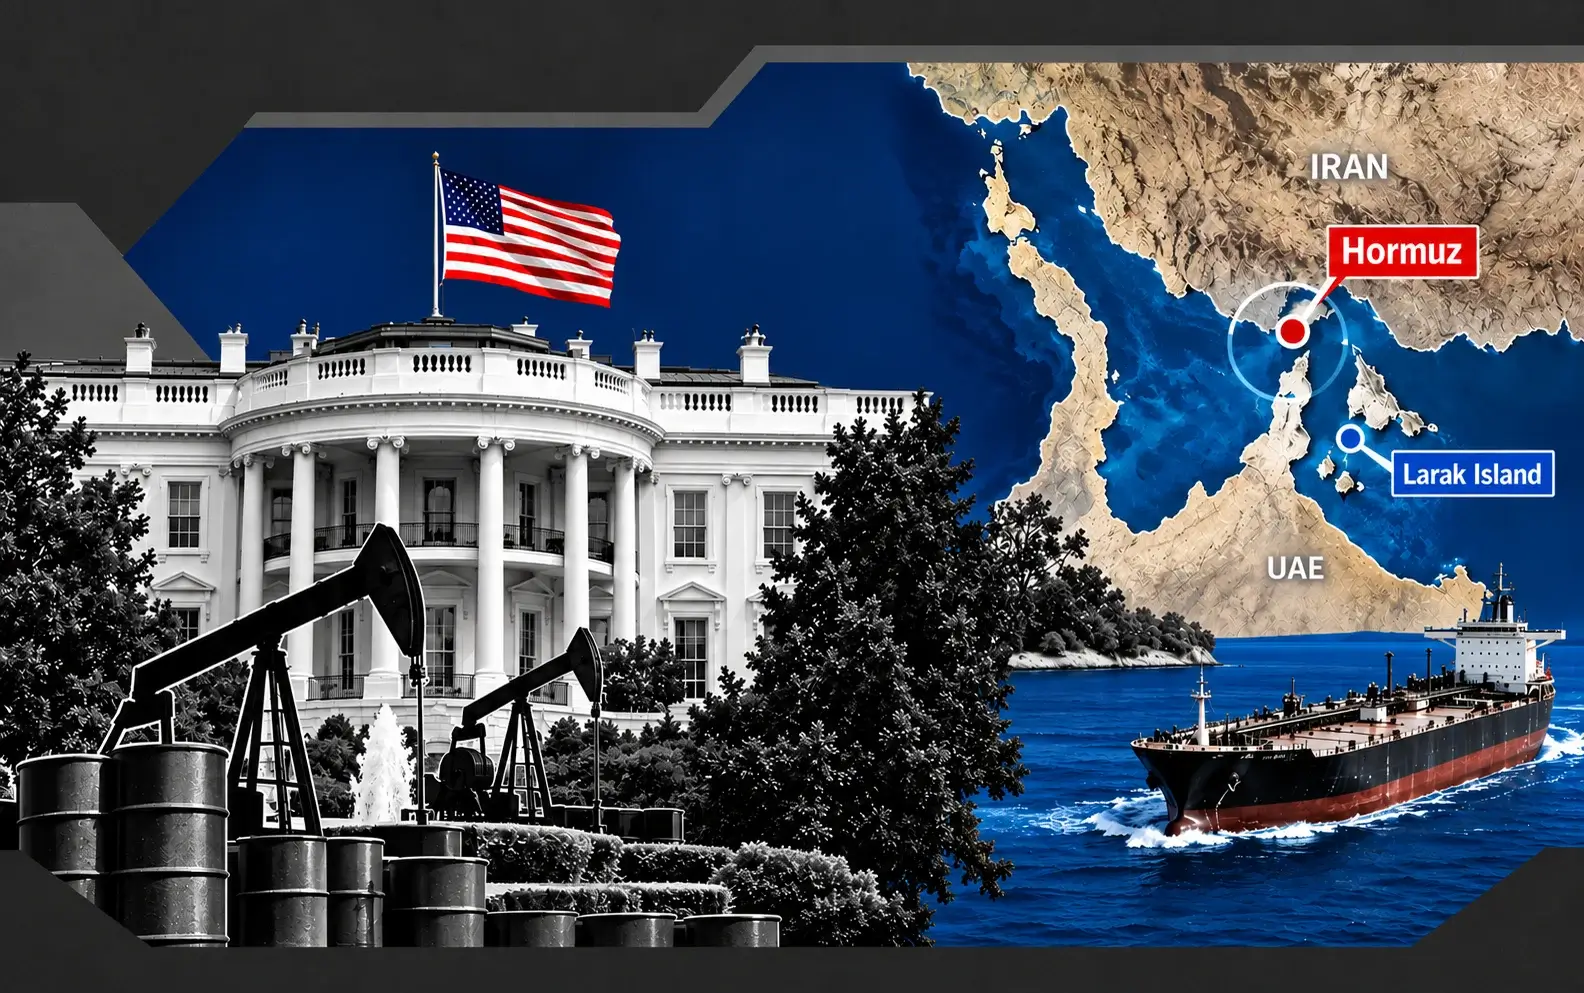
Crude Round-Trips To Pre-Escalation Levels With WTI At $74.69 And Brent At $79.08
Commercial crude built 2.479M barrels against a 1.5M draw forecast while distillate drew 3.473M to 107.2M | That's TradingNEWS
Key Points
- WTI traded $74.69 and Brent $79.08 after WTI shed 11% across the week's first three sessions.
- Gulf exports stalled at 16.1 million bpd in July, still 40% below the 24 million bpd pre-war average.
- Distillate stocks fell 3.473 million barrels to 107.2 million, 12% below the five-year average.
West Texas Intermediate opened Thursday's session down 53 cents, or 0.7%, at $74.69 a barrel before grinding back through $74.80 and $75.00 and printing $76.13 on the September contract by mid-morning in New York, up 91 cents or 1.21%. That intraday reversal of roughly $1.44 off the low is the whole character of this tape: a market selling every diplomatic headline and buying it back within hours.
Brent traded $79.08, down 37 cents or 0.5%, then $79.12 and $79.40 as the session progressed, holding a Brent-WTI spread near $4.39. Brent settled up slightly Wednesday while WTI edged lower — a divergence that tells you the pressure is on the U.S. benchmark while the international grade holds the geopolitical premium.
The week's damage was front-loaded and severe. WTI lost 11% across the first three sessions, with Brent shedding roughly 5% in each of two consecutive days before snapping the decline Wednesday on a reported missile attack on a Saudi vessel in the Red Sea. Both benchmarks sit at three-week lows on the curve.
The context that matters most: prices have simply returned to the levels prevailing when the interim peace agreement was signed on June 17. Every dollar of the July escalation premium has been unwound. Brent at $79.08 against a pre-war February 27 baseline is roughly $7 above where crude traded the day before the conflict began, meaning the market is now pricing a near-complete resolution of a five-month supply shock that has not actually resolved.
The distance from the highs is the reason this remains a live trade rather than a settled one. Brent started 2026 at $61, finished the first quarter at $118 — the largest quarterly increase on an inflation-adjusted basis in data going back to 1988 — surpassed $100 on March 12, and hit a four-year high above $126 in late April. From $126 to $79.08 is a decline of 37.2%. From $61 to $79.08 is a gain of 29.6%.
Sentiment turned outright dovish this week. Some selling pressure emerged specifically on reports that Iran-Oman talks are making progress, and traders have positioned for a final deal. Gulf tanker backlogs and shipping delays are still working through the system, which is precisely the gap between the headline and the physical barrel that makes $74.69 a difficult level to sustain.
Brent At $79.08 And The June 17 Round Trip
The single most useful frame for the current price is that Brent has round-tripped to its June 17 level, when the United States and Iran signed an interim peace agreement, and a memorandum of understanding followed on June 18 committing to end the conflict and open the Strait of Hormuz.
That agreement did not hold. On July 7, Iran targeted three ships in the strait and reignited strikes on both sides. A ceasefire was declared essentially over after Iran targeted 85 U.S. military sites in Bahrain and Kuwait. Brent had dropped to $72 on the OPEC+ announcement and rose to $78 by July 8. A strike on Yanbu landed July 25, and a Bab al-Mandeb disruption compounded it.
So the market has now priced the same outcome twice inside seven weeks, and it broke down the first time. Brent at $79.08 embeds a full resolution premium that the previous full resolution premium already failed to deliver.
The sequence of the collapse from the highs traces the diplomatic arc precisely. In late June, Brent August futures settled down 4.34% at $71.99 while WTI August fell 3.74% to $69.23 — the first WTI close below $70 since February 27, the day before the war began. Prompt Brent traded at $72.68 while September was priced at $73.59, a contango signalling ample short-term supply as tankers exited the strait and more than 11,000 stranded seafarers began transiting out after safety guarantees.
Then it reversed. Tit-for-tat strikes over a late-June weekend pushed Brent to $73.21, 127 cents above the pre-war level. By mid-July it was back at $80.57 after talks in Switzerland were abruptly called off. Every attempt to price peace has been followed by an escalation that reprices risk higher.
At $79.08 the market is making the same bet a third time, with one material difference: the physical recovery is further along. Gulf exports have risen, OPEC+ has added quota for five consecutive months, and inventories are building rather than drawing. Those are real developments rather than headlines.
The question the forecast has to answer is whether the physical improvement is now sufficient to hold prices down even if the diplomacy fails again.
The Coordinates Deal Is The Entire Bid — Or The Entire Offer
Iran and Oman have reached an understanding on the geographic coordinates for a shipping route through the Strait of Hormuz, with a joint announcement being finalised, provided certain third parties do not interfere. That conditional clause is the most important phrase in the oil market this week.
The structure under negotiation runs deeper than a shipping lane. The United States, Iran and Oman are reported close to a 60-day interim agreement to reopen the waterway without tolls, insurance charges or fees of any kind on transiting vessels. Qatar has drafted an interim proposal. Iran is weighing a separate proposal to allow European countries to clear mines from the strait. Saudi Arabia has continued talks with Yemen's Houthi forces through Omani mediators to keep the Red Sea conflict from escalating.
The sticking point is sovereignty over the chokepoint, and it is not a detail. Washington has refused any deal that would leave Iran in control of access through the strait, on the grounds that it violates international norms and would represent a strategic loss. Yet the framework under discussion would hand Tehran authority over vessels entering the Gulf. The agreement may also hinge on the United States lifting its blockade of Iranian ports — a concession with no public commitment behind it.
Two parties negotiating a route while disagreeing on who controls it is not a completed deal. It is a mechanism for producing headlines that move crude $2 a barrel in either direction on a daily basis, which is exactly what has happened all week.
The real hinge point now becomes the trajectory of U.S.-Iran discussions, because meaningful progress there is essential before disrupted energy flows can realistically resume. The Oman route addresses transit safety. It does not address whether Gulf producers can restore the roughly 8 million barrels per day of export capacity that remains offline, and it does not address the tanker backlogs, insurance premiums and shipping delays still working through the system.
For the forecast, the asymmetry runs against current pricing. A signed 60-day interim deal is largely in the price at $79.08 Brent. A collapse in the framework — through a third-party objection, a port-blockade impasse, or another strike — is not. The downside from a signature is perhaps $4 to $6. The upside from a failure is $10 or more, because the market has already spent its peace premium.
What Breaks It: Yanbu, The Gulf Of Aden And Lebanon
The escalation vectors are live and they multiplied this week. Yemen's Iran-aligned forces said they launched a missile attack on a Saudi oil tanker off Yanbu, the kingdom's Red Sea port city, and a second missile attack on a Saudi tanker in the Gulf of Aden. Saudi Arabia has confirmed neither incident.
Those two claims matter disproportionately because they target the workaround rather than the chokepoint. Yanbu is the Red Sea terminus of the pipeline that lets Saudi crude bypass Hormuz entirely. Striking Yanbu and the Gulf of Aden simultaneously closes the alternative route while the primary route is being negotiated. Concerns that Houthi attacks could hit Red Sea shipping are directly limiting optimism about an end to Middle East shipping disruptions — and a July 25 strike on Yanbu already established that these are not empty threats.
Iran has separately warned neighbouring Gulf states that their energy infrastructure could become targets if they assist any military action against Tehran. That threat has teeth: during the closure, Iranian action around the strait sharply curtailed exports from Saudi Arabia, Iraq and Kuwait, and combined production from those three fell by around 6 million barrels per day between the first quarter and May.
The Lebanon front reopened as well. Israel launched attacks in southern Lebanon after accusing Hezbollah of violating a ceasefire — a development that has historically preceded broader regional escalation rather than followed it.
Set against that, prices fell. Crude declined on Thursday because talks are progressing, while three separate active military engagements ran concurrently across the Red Sea, the Gulf of Aden and southern Lebanon.
That divergence between headline risk and price is the definition of a market that has stopped paying for geopolitical insurance. It is the crude equivalent of implied volatility collapsing to a floor while bad news accumulates — a configuration that resolves violently when the market is forced to reprice.
The forecast implication: at $74.69 WTI and $79.08 Brent, the risk premium embedded in crude is close to zero relative to the actual state of the conflict. Two tanker attacks in a single day did not lift the price. The next escalation that actually removes barrels will.
Gulf Exports At 16.1 Million bpd Against 24 Million Pre-War
The physical supply picture is the strongest bearish argument and it comes with a large caveat. Gulf crude and condensate exports were largely steady in July and remain about 40% below pre-war levels. Gulf exports rose 6.5 million barrels per day in June to reach 16.1 million bpd, against a pre-war average of 24 million bpd.
That is a 7.9 million bpd shortfall still sitting in the system. The recovery has been enormous in absolute terms — 6.5 million bpd restored in a single month is one of the fastest supply normalisations on record — and it has stalled. July was flat against June. The remaining 7.9 million bpd requires the strait to function normally rather than through temporary corridors, and that requires the deal.
The OPEC+ aggregate tells the same story. Group output fell to 33.13 million bpd in May from 42.77 million bpd in February, a collapse of 9.64 million bpd, or 22.5%. It began recovering in June and remains below pre-war levels. The United Arab Emirates, having exited the group effective May 1, produced near record highs of 3.8 million bpd in June while unconstrained by quota.
The demand side has absorbed the shortfall through three channels. Chinese imports fell. Non-Middle East producers raised exports. And a record global strategic stock release was coordinated internationally — a one-time supply injection that cannot be repeated and that has to be replaced eventually.
That last point is the bearish case's weakest link. Prices have returned to pre-war levels while 7.9 million bpd of Gulf export capacity is still offline, partly because strategic reserves were drained to cover the gap. Those barrels have to be rebought. The tanker count, not quota headlines, remains the supply variable that matters, and June's 16.1 million bpd against a 24 million bpd baseline is the gap to close.
Official forecasting now expects most crude production to return to near pre-conflict averages by the end of this year, with the majority of shut-in production back online in the first quarter of 2027. That timeline is what justifies $74 Brent in the third quarter and $65 in 2027 — and it assumes the strait normalises on schedule.
If it does, the market is correctly priced. If July's flat export reading extends into August, the shortfall persists and $79 Brent is too low.
OPEC+ Adds 188,000 bpd For A Fifth Month On Paper
OPEC+ agreed to raise production quotas by another 188,000 barrels per day from August, the fifth consecutive monthly increase and the third straight at that exact figure. Saudi Arabia's share is 62,000 bpd, bringing its required production to 10.4 million bpd.
The arithmetic of the unwind is worth stating precisely. April and May carried 206,000 bpd increases each, before the UAE's exit. The seven core members raised quotas by almost 800,000 bpd from April through July, and roughly 940,000 bpd has been added to quotas since the war began. All of it forms part of a phased rollback of the 1.65 million bpd voluntary cut agreed in 2023, when the group still included the UAE.
Here is why none of it has mattered for price. The increase has remained largely on paper because the closure of the strait meant Saudi Arabia, Kuwait and Iraq physically could not export the barrels they were permitted to produce. Raising a ceiling that nobody can reach costs nothing while the constraint binds, and it saves a negotiation when the constraint lifts. Production is probably still below the group's targets.
That is the setup that turns bearish the moment Hormuz normalises. Members with restored logistics will have headroom already in place, and 940,000 bpd of quota created during the shortage becomes real barrels the week the route opens. The group has been pre-positioning for exactly that.
September is the checkpoint. It is the point at which the April 2023 tranche was expected to be fully unwound. If roughly 191,000 bpd remains outstanding, the schedule has slipped and the group will have to acknowledge it.
Internal cohesion has weakened. The UAE left the group entirely. Iraq is pressing for a higher quota. The membership stands at 21 countries including Iran, but only seven — Saudi Arabia, Russia, Iraq, Kuwait, Algeria, Kazakhstan and Oman — have handled monthly production management since the UAE's departure. A seven-member cartel managing supply for a market where a non-member is producing 3.8 million bpd unconstrained is a fractured coordination mechanism.
For the forecast, OPEC+ is a bearish overhang with a delayed trigger. The quota exists. The barrels do not yet. When they arrive, they arrive together.
Read More
-
Yen Stalls at 160 Despite a 3% JGB and Tokyo Core CPI at 2.0% — Intervention Sits at 164, Friday's Payrolls Decide
02.09.2026 · TradingNEWS ArchiveEnergy
-
CHAT Fund Holds $96.37 as Korean Memory and Chip Exposure Drive a 109.73% Year — Break of $98.02 Opens $105.20
18.09.2026 · TradingNEWS ArchiveStocks
-
First-Generation XRPR and XRPI Ride XRP's Rebound to $1.386 as Spot Funds Post First Outflow — Break of $1.40 Opens $1.54
18.09.2026 · TradingNEWS ArchiveCrypto
-
NG Holds $2.9255 as Storage Surplus Narrows From 5.5% to 3.7% in 3 Weeks — Break of $3.00 Opens $3.15
18.09.2026 · TradingNEWS ArchiveCommodities
-
Dollar Surges to 157.90 as BoJ's Divided Hike Fails to Lift the Yen — Break of 158.87 Opens 159
18.09.2026 · TradingNEWS ArchiveForex
The Saudi Price Cut Signals A Market-Share Fight
The clearest read on how the largest producer sees the next twelve months came through pricing rather than volume. Saudi Arabia cut its August Arab Light official selling price to Asia by the largest margin in more than two decades, set on July 6 — the day after the quota decision.
An official selling price cut of that magnitude is not a response to weak demand. It is a bid for volume. The kingdom is positioning to reclaim Asian market share it lost during five months when its barrels could not physically reach buyers, and it is prepared to discount aggressively to do it. Traders attributed the cut to Hormuz normalisation and oversupply.
The sequencing matters and it has been widely conflated. The price cut was set roughly two weeks before the Bab al-Mandeb disruption and the July 25 strike on Yanbu. Those are separate stories and should not be read as one — the discount reflected a view of the supply landscape formed before the latest escalation, not a reaction to it.
The competitive context sharpens the signal. Chinese buyers have been seeking alternatives, particularly for Iranian crude, which was permitted to sell during the ceasefire after sanctions were removed but has struggled to attract customers. Iran's largest customer is actively diversifying away. Non-Middle East producers raised exports through the disruption and captured volume. Every barrel of Gulf capacity that comes back online returns to a market where competitors have taken share.
That dynamic is structurally bearish for the medium term regardless of what happens to the strait. A price war among restored Gulf producers competing for Asian refinery slots, against a backdrop of quota headroom already granted and demand growth revised down three consecutive times, is how $65 Brent in 2027 becomes plausible.
The near-term read is different. Saudi Arabia's state shipper posted record profits on higher freight rates and increased vessel chartering — the kingdom is not flooding the market yet, and elevated freight economics indicate the logistics system is still absorbing the disruption rather than operating normally.
Discounting into Asia while chartering at record rates describes a producer preparing for volume competition it cannot yet execute.
Commercial Crude Builds 2.479 Million Against A Draw Forecast
The inventory report released Wednesday for the week ending July 31 was outright bearish on the headline and considerably more nuanced underneath.
Commercial crude inventories rose 2.479 million barrels to 406.987 million, against market expectations for a 1.5 million barrel draw — a 4 million barrel miss against consensus. That leaves stocks roughly 6% below the five-year average for this time of year, so the absolute level remains tight even after the build.
The prior week had delivered the opposite. Crude fell 7.167 million barrels to 404.5 million in the week ending July 24, more than five times the 1.3 million draw expected. Two weeks, a 7.167 million draw followed by a 2.479 million build, on a base near 405 million barrels. That volatility reflects import timing rather than demand: crude imports averaged 6.2 million bpd last week, up 515,000 bpd week over week, with net imports up 297,000 bpd.
Cushing is the detail that changes the interpretation. Stocks at the NYMEX delivery point rose 2.356 million barrels to 21.0 million. That hub had fallen below 20 million barrels earlier in the summer and touched 18.6 million — a level that historically signals tightening physical availability at the benchmark delivery point. Rebuilding to 21.0 million relieves the squeeze pressure that had been supporting the front of the WTI curve.
Total crude including the strategic reserve actually declined, falling 0.36 million barrels to 711.8 million, because the reserve drew 2.841 million. Total commercial petroleum inventories rose 2.0 million barrels.
So the honest reading is a build in commercial crude driven by a 515,000 bpd import surge and slightly lower refinery runs, against a total inventory position that fell. That is not a glut. It is a week where barrels arrived faster than refiners could process them, at a hub that needed the barrels.
The next report lands August 12, covering the week ending August 7 — the first clean read on whether the import surge was a one-week timing effect or the leading edge of restored Gulf flows reaching U.S. shores.
Distillate At 107.2 Million Is 12% Below The Five-Year Average
The product side of the report is where the bullish case lives, and it received almost no attention.
Distillate inventories fell 3.473 million barrels to 107.2 million, against expectations for a 0.2 million barrel increase — a 3.7 million barrel miss in the bullish direction. Stocks now sit roughly 12% below the five-year average for this time of year, deepening from about 10% below just two weeks earlier.
Gasoline fell 1.643 million barrels to 209.7 million, against expectations for a 1.3 million draw, leaving stocks roughly 7% below the five-year average. Both finished gasoline and blending component inventories decreased.
That combination — crude building while distillate and gasoline draw harder than forecast — describes strong refined product demand meeting insufficient refinery output, not demand destruction. Distillate is the barometer that matters because it tracks industrial activity, freight and heating rather than discretionary driving. A 12% deficit to the five-year average with the heating season still three months away is a genuinely tight position.
Production explains the gap. Gasoline production decreased to 9.6 million bpd. Distillate production decreased to 5.2 million bpd. Refinery crude inputs averaged 17.2 million bpd, down 183,000 bpd from the prior week. Refiners produced less of both products while demand held, and inventories absorbed the difference.
Demand data confirms the resilience. Total products supplied over the last four weeks averaged 20.4 million bpd, down just 0.9% from the same period last year despite crude having traded above $100 for much of the spring. Motor gasoline supplied averaged 9.0 million bpd over four weeks, up 0.6% year over year — actually higher than a year ago after a period of extreme price shock.
The one product in surplus is propane and propylene, up 0.8 million barrels and sitting 32% above the five-year average, down from 34% two weeks prior.
For the forecast, the product picture argues that crack spreads stay wide and that any crude weakness gets partially absorbed by refiners bidding for barrels. Distillate at 12% below average is the strongest single argument against a slide through $70 WTI.
Refineries At 96.5% Are Not Signalling Demand Destruction
The bear case on crude always starts with demand destruction: high prices kill consumption, refineries pull back, crude piles up. This data set does not support that argument.
Refinery utilization ran 96.5% of operable capacity for the week ending July 31, down from 97.2% the prior week. That 97.2% reading was the highest in the four-week dataset, which had ranged between 95.8% and 96.6% before the jump. Refiners are running near the physical ceiling of the U.S. system, and a 0.7 percentage point pullback from a multi-week high is maintenance noise rather than a demand signal.
Set that against the price history and the resilience is remarkable. Refiners operated above 96% through a period when Brent traded from $61 to $118 in a single quarter, surpassed $126 in late April, and remained above $100 for weeks. Crack economics stayed strong enough to justify maximum throughput. That happens when product demand holds and product inventories are short — which is precisely what the 12% distillate deficit and 7% gasoline deficit describe.
The math does not support a supply glut at current production levels. In the week ending July 24, refineries absorbed output at 97.2% utilization and still drew commercial crude down 7.167 million barrels. Two weeks later, at 96.5% utilization with imports up 515,000 bpd, crude built 2.479 million. The variable was imports, not runs.
Four-week import data reinforces the tightness: crude imports averaged about 5.8 million bpd, down 4.4% from the same four-week period a year earlier. Total motor gasoline imports averaged 463,000 bpd and distillate imports 99,000 bpd — negligible product import cover.
The seasonal pattern is also working against the bears. Over the past twenty years, inventories have typically decreased from June through August as gasoline consumption for transportation peaks, then built from September through November. The correlation coefficient between inventories and price runs negative 0.54. A build in the last week of July runs counter to seasonality, which makes it more likely a timing artifact than a trend.
Refiners running at 96.5% into a 12% distillate deficit is the physical market telling you it wants barrels. The paper market at $74.69 WTI is telling you something different.
The Strategic Reserve At 304.8 Million And A Vanishing Backstop
The most consequential number in the inventory report is the one almost nobody trades on. The Strategic Petroleum Reserve fell 2.841 million barrels to 304.809 million, continuing a multi-month decline and sitting at multi-decade lows.
That reserve was the mechanism that broke the spring price spike. A record global strategic stock release, coordinated internationally, was one of the three forces cited for pushing crude back to pre-war levels alongside lower Chinese imports and higher non-Middle East exports. Government inventories absorbed the supply shock so commercial inventories and prices did not have to.
At 304.8 million barrels, that capacity is largely spent. The reserve is drawing 2.8 million barrels a week while commercial crude sits 6% below its five-year average, distillate 12% below and gasoline 7% below. Total crude including the reserve fell 0.36 million barrels on a week when commercial crude built 2.479 million — meaning the only reason the headline looked bearish is that government barrels moved into commercial tanks.
That is not new supply. It is a transfer, and the transfer has a terminal date.
The forward implication is asymmetric and underpriced. If the Hormuz framework holds and Gulf exports climb toward 24 million bpd, the reserve gets refilled, and refilling represents incremental demand of hundreds of millions of barrels over several years. If the framework fails and another 7.9 million bpd of export capacity stays offline, there is no strategic buffer left to deploy — the response function that capped the last spike is unavailable for the next one.
Either path is bullish crude relative to $74.69. The bearish path requires the strait to normalise without the reserve being refilled, which is not a policy any government has articulated after drawing stocks to multi-decade lows during a war.
For comparison, the reserve held 387.2 million barrels in a recent pre-conflict period, 10.2% above the year-ago level at the time. From 387.2 million to 304.809 million is a decline of 82.4 million barrels, or 21.3%.
That is the cost of holding oil at $79 through a five-month closure of the world's most important chokepoint. It has been paid once and cannot be paid twice.
Demand Forecasts Cut Three Times And $65 Brent In 2027
The bearish structural case rests on demand, and the revisions have been relentless. OPEC trimmed its 2026 oil demand growth forecast by 20% in its July report, the third consecutive downward revision, cutting the outlook to 970,000 bpd from 1.17 million bpd in the June assessment. The 2027 forecast was raised by 12% to 1.94 million bpd. Official U.S. forecasting lowered its own 2026 demand estimate by roughly 1 million bpd.
Price forecasts followed. The Brent spot price averaged $85 a barrel in June, down $22 from May and $32 from its April peak. The third-quarter forecast was set at $74 a barrel, a reduction of $27 from the prior month's outlook. Brent is projected to fall to an average of $65 in 2027 as ongoing inventory accumulation puts downward pressure on prices. Retail gasoline is forecast to average $3.80 a gallon in the third quarter.
Global inventories are expected to fall 2.2 million bpd in the third quarter, against more than 7 million bpd in the prior forecast — a reduction of nearly 5 million bpd in the projected draw. Most crude production is expected back near pre-conflict averages by the end of this year, with the majority of shut-in production online in the first quarter of 2027.
Brent at $79.08 sits $5.08 above that $74 third-quarter average forecast, which means the market is already pricing more geopolitical residual than the base case allows. If the forecast is right, crude has $5 of downside before it reaches fair value on official projections, and another $14 to reach the 2027 average.
The counterargument is that those forecasts were completed July 1, before the Yanbu strike, before the Bab al-Mandeb disruption, before the current Oman negotiation and before July's Gulf exports came in flat rather than continuing June's 6.5 million bpd recovery. The next update lands August 11 and will carry the first full month of post-Yanbu data alongside monthly production reports mid-month.
A demand growth rate of 970,000 bpd against 1.94 million bpd projected for 2027 also implies acceleration rather than deterioration. The demand story is a 2026 air pocket, not a structural peak — a distinction the group has been explicit about in rejecting forecasts that global demand peaks soon.
The Backwardated Curve Says The Sell-Off Overshot
The structure of the futures curve is the most technically bullish element in this market and it contradicts the spot price.
A deeply backwardated curve, tight stocks at the delivery hub and light speculative positioning all warn that the WTI sell-off may have gone too far. Backwardation means prompt barrels trade at a premium to deferred barrels — the market paying up for immediate delivery. That structure does not coexist with a genuine surplus. It is the physical market signalling scarcity while paper positioning signals the opposite.
Contrast that with late June, when prompt Brent traded at $72.68 against September at $73.59 — a contango that correctly signalled ample short-term supply as tankers exited the strait. The curve has flipped since, which means the physical tightness returned even as the headline price fell.
Light speculative positioning is the second element. After 11% down in three sessions and a 37.2% decline from the April high above $126, length has been flushed. A market with thin speculative positioning has fewer overextended longs to liquidate and fewer trapped shorts to squeeze, which produces sticky prices around known levels until new money arrives — and it means the next directional move has to be funded by fresh positioning rather than by a stop cascade.
Cushing at 21.0 million barrels is the third. That is up 2.356 million on the week, which relieves the acute squeeze, and it sits against a summer trough of 18.6 million and a threshold near 20 million that historically marks tightening physical availability. A 21.0 million barrel hub is functional rather than comfortable.
Add the product deficits — distillate 12% below the five-year average, gasoline 7% below, crude 6% below — and the physical picture across the board is tight while the screen prints a three-week low.
That divergence is the trade. Backwardation plus a 12% distillate deficit plus 96.5% refinery utilization plus a strategic reserve at multi-decade lows plus 7.9 million bpd of Gulf export capacity still offline, against a price that has round-tripped to its pre-escalation level.
The market is pricing a resolution that the physical barrel has not yet delivered.
What Actually Has To Happen For $70 WTI
Building the bear case honestly requires a specific sequence, and every step has to land.
First, the Iran-Oman coordinates deal has to be jointly announced without third-party obstruction — the explicit condition attached to it. Second, the 60-day interim arrangement covering the reopening without tolls has to be signed by all three parties, which requires Washington to accept an arrangement it has publicly rejected on sovereignty grounds, or Tehran to concede control it has insisted on. Third, the U.S. blockade of Iranian ports has to lift, a step with no public commitment attached. Fourth, mine clearance has to proceed, which currently depends on Iran approving European involvement.
Only then do Gulf exports move from 16.1 million bpd toward the 24 million bpd pre-war average — a 7.9 million bpd restoration that requires functioning insurance markets, cleared tanker backlogs, and Houthi attacks in the Red Sea and Gulf of Aden to stop.
At that point, 940,000 bpd of OPEC+ quota granted during the shortage becomes real barrels, Saudi Arabia executes the market-share strategy its record official selling price cut signalled, the UAE keeps producing 3.8 million bpd unconstrained, and Iraq gets the higher quota it is pressing for. Commercial inventories build against a 6% deficit to the five-year average, distillate rebuilds from 12% below, and the strategic reserve stops drawing at 304.8 million barrels.
That sequence produces $70 WTI and $74 Brent, consistent with official third-quarter projections, and eventually $65 Brent in 2027.
Every element of it is plausible. None of it is done. And the market has already priced roughly the entire outcome at $74.69 WTI and $79.08 Brent, which is why two tanker attacks in a single day moved crude lower rather than higher.
The bull case requires only that one step fails. A third party objects to the coordinates. The port blockade impasse holds. A Houthi missile connects. Israel-Lebanon escalates into a wider front. Iran follows through on its threat to target Gulf neighbours' energy infrastructure. Any single break sends crude back through $85, because there is no strategic reserve left to cap it and no risk premium currently in the price to absorb the shock.
That is the asymmetry into next week.
The Trade Into Next Week: $72 Or $82
The forecast resolves into a defined band with skewed risk. WTI at $74.69 to $76.13 sits at the low end of a three-week range, with Brent at $79.08 to $79.40 holding the $79 handle. The near-term levels are mechanical.
The bear path needs WTI to lose $74.69 and then $74.00, which opens the June low zone at $69.23 and the psychological $70 level that has been breached only twice since the war began — on June 24 at a $70.34 close with a $69.63 session low, and on June 26 at $69.23. Brent losing $79 exposes $76 and then the $71.99 June settlement. That path requires the joint announcement, the interim signature, and Gulf exports resuming their June trajectory.
The bull path is shorter and better funded. Reclaiming $76.13 on WTI and $80 on Brent takes crude back to the mid-July range, where Brent settled at $80.57. Above that, the July 8 level near $78 on WTI and the escalation highs come into view, and a genuine breakdown in the framework would target $85 Brent — the June average — before anything resembling a supply crisis returns.
The base case is continued chop. Brent $76 to $82, WTI $72 to $78, resolved by headline flow rather than data, with the August 11 forecast update and the August 12 inventory report as the scheduled catalysts. Monthly production reports mid-month carry the first full post-Yanbu picture.
Position sizing should respect what the physical market is saying against what the screen is saying. Backwardated curve. Cushing at 21.0 million after a summer trough of 18.6 million. Distillate 12% below the five-year average and drawing 3.473 million against a forecast build. Gasoline 7% below. Commercial crude 6% below. Refineries at 96.5%. Strategic reserve at 304.809 million, a multi-decade low, drawing 2.841 million a week. Gulf exports stalled at 16.1 million bpd against 24 million pre-war. Two tanker attacks in one session that moved price lower.
Base case into next week: range $72 to $82 Brent-equivalent, with the risk skewed higher because the peace premium has already been spent and the reserve backstop is gone. Invalidation on a WTI daily close below $72.
Crude at pre-escalation levels with 7.9 million bpd offline is a bet on diplomacy, not on barrels.