





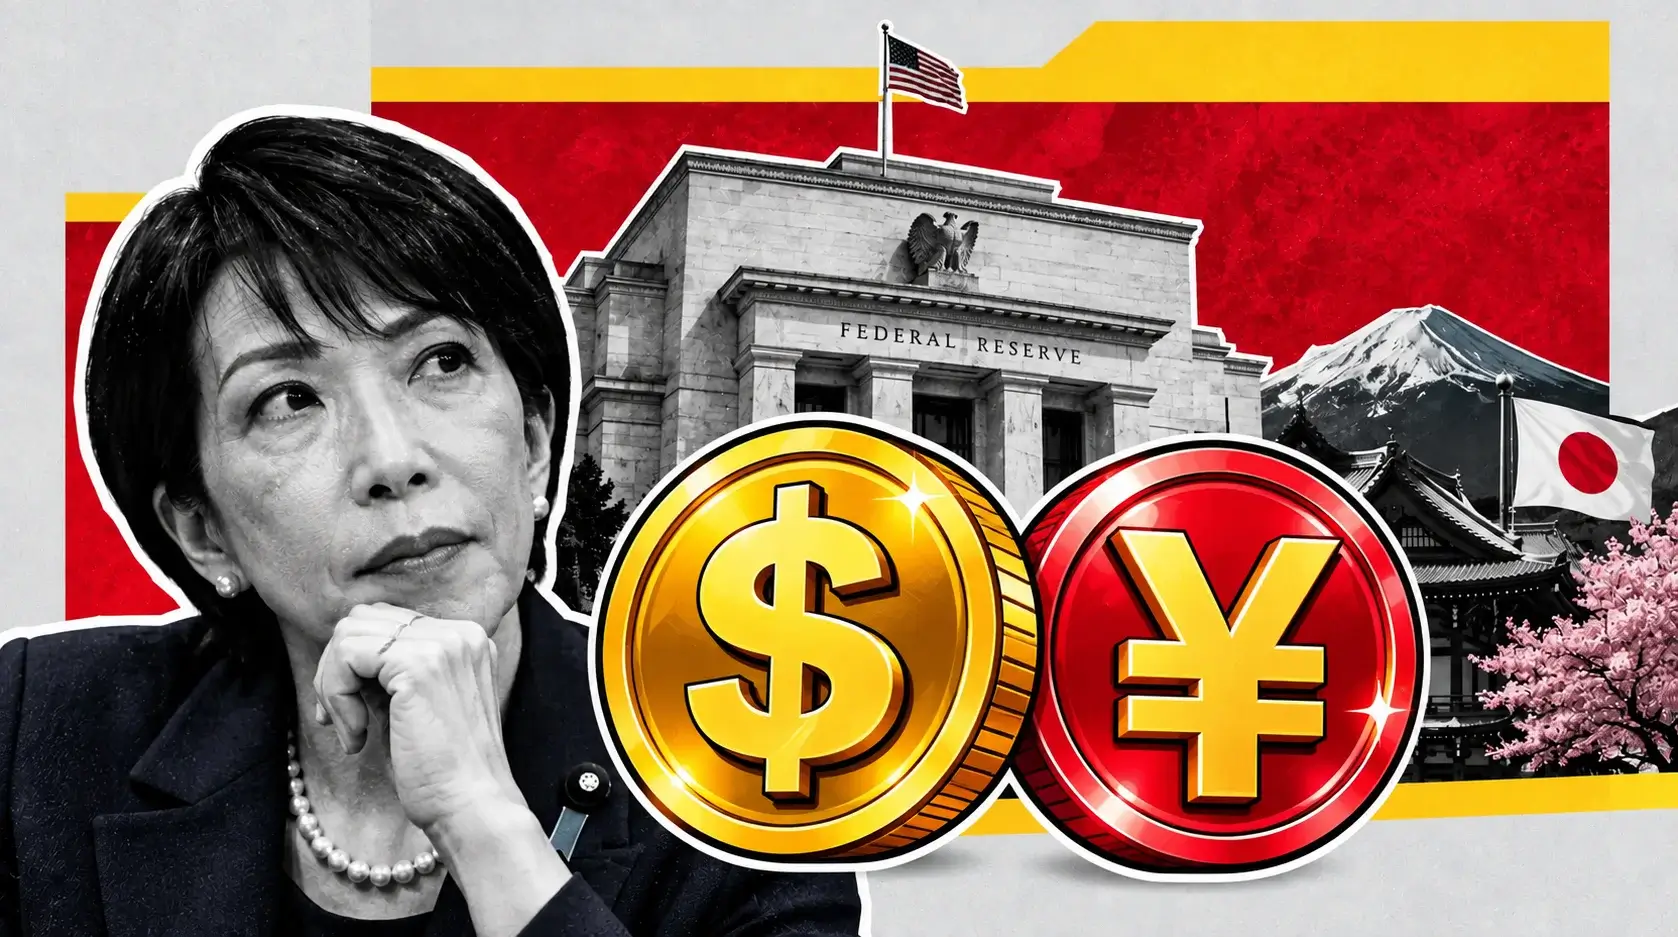
Dollar-Yen (USD/JPY) Cracks 155.00 to 6-Month Lows as Japan's Loudest Dove Concedes a September Hike
MUFG ruled out intervention behind the 500-pip plunge | That's TradingNEWS
Key Points
- USD/JPY trades near 154.06, its lowest since late February, after breaking 155.15 support.
- Japan's 10-year yield hit 3.001% on September 1, compressing the US spread to about 178 basis points.
- The completed head-and-shoulders targets 149.60; a bounce is capped at 156.74.
USD/JPY has breached the support area around 155.15 to hit fresh six-month lows near 154.00 on Monday, September 7, 2026, accelerating a decline that has taken the pair to its lowest level since late February. The yen resumed its uptrend as the dust from a strong US payrolls report settled and Japanese officials hinted at a steepening of the Bank of Japan's tightening cycle.
The pair traded at 155.60 earlier in the session before the break, and sat around 156.00 at the start of the week with a four-month low of 155.23 behind it. That low is now history.
US equity and bond markets are closed for Labor Day, which thins liquidity and amplifies moves in a pair already in free fall.
The thesis for this forecast is that the market has stopped trading the Fed and started trading the Bank of Japan, and that shift is structural rather than tactical. For four years USD/JPY has been a one-way function of American rates. It is now a two-sided trade, and the side that has been dormant since 2024 has woken up.
The evidence is in the price. The yen strengthened sharply from the 160 level on September 2 all the way to 155.30 — a five big-figure move — driven by a hawkish shift in Bank of Japan rhetoric rather than anything from Washington. A 500-pip plunge occurred between Wednesday and Thursday alone.
What produced it: board member Hajime Takata, one of the BoJ's most hawkish voices, gave a speech leaving the door open for an outsized interest rate increase as well as back-to-back hikes. The policy meeting falls September 17-18, with most economists expecting 25 basis points and 50 basis points also in play.
Then came the confirmation that mattered more. Takuji Aida, economic adviser to Prime Minister Takaichi and one of the most vocal opponents of BoJ rate hikes, now expects a hike at the September meeting followed by another by January.
When the loudest dove flips, the repricing is not a positioning squeeze. It is a regime change.
The technical damage is severe. Monday's break took out the neckline of a bearish head-and-shoulders pattern on the daily chart, with a measured target near 149.60.
Friday's US August CPI is the only thing standing between here and that level.
The 500-Pip Plunge From 160 on September 2
The speed of last week's move is what makes this different from previous yen rallies.
USD/JPY sat at 160 on September 2. By overnight Thursday it had reached 155.30, a five big-figure move inside 48 hours. The bulk of it — roughly 500 pips — occurred between Wednesday and Thursday. On Thursday the yen jumped more than 2% against the dollar, at one point touching 155.28, its strongest level since August 3.
That August 3 reference matters, because it dates back to shortly after the United States and Japan staged a joint intervention to support the struggling Japanese currency on July 31.
Friday brought a partial reversal. The pair bounced from lows in the 155.30 area back above 156.00, though upside traction remained weak. The yen still closed on track for its strongest weekly performance since July's coordinated intervention.
Monday erased the bounce and extended the move.
The market spent the weekend debating what caused a 500-pip plunge. Analysts at MUFG noted it is not entirely clear whether the moves were driven by FX intervention, but pointed out that Bank of Japan current account data for Wednesday do not suggest intervention was the driver — attributing it instead to broader dollar weakness combined with the policy backdrop.
That distinction is critical for forecasting. Intervention-driven moves reverse; policy-driven moves persist. If the move was genuinely about Takata's speech and the accompanying repricing of BoJ expectations, then 154 is a waypoint rather than a destination.
MUFG also flagged a weak US dollar as a separate trigger, ruling out BoJ intervention as the explanation.
The broader context frames how far this has come. The pair entered 2026 pressing against ¥160, oscillated between ¥152 and ¥160 through January and February with a sharp dip to ¥152-153 in late January, then traded ¥155-159 in March. It broke above the 2024 highs near 162 during the summer, reaching levels not seen since the 1980s, with the cycle peak at 163.97.
From 163.97 to 154.06 is a decline of 6.0% in roughly two months.
Year to date the pair is down 0.43%, having traveled 12 big figures in both directions to get there. Over five days it has fallen 2.49%.
The Head and Shoulders Top That Just Completed
The technical structure that broke Monday is the most significant pattern on the daily chart in two years.
USD/JPY pierced a support area a few pips above 155.00 on Monday, which functions as the neckline of a bearish head-and-shoulders formation — a common figure for trend shifts. The pattern's components are well defined: left shoulder at 160.71, head at 163.97, and right shoulder at 160.38.
A sustained break of the 154.76 to 155.01 key support zone completes the pattern. That zone corresponds to the 38.2% retracement of the 139.87 to 163.97 uptrend at 154.76 and to cluster support at 155.01.
The measured target sits at the October 2025 low around 149.60, with a separate Fibonacci projection at 149.07. From 154.06, that represents a further 2.9% to 3.2% of downside.
The pattern also carries a wider structural implication. As long as the 155.01 cluster support held, the larger uptrend was still expected to continue through 163.97 once the correction completed. A firm break of 155.01 raises the chance that USD/JPY is already in a larger-scale correction and opens a deeper fall back toward 139.87, the 2025 low, in the medium term.
That is a 9.8% move from current levels, and it is now the medium-term bear case rather than a tail scenario.
The break also generates a bearish failure swing pattern on the daily chart. Monday's violation of the 155.20 support zone — defined by the lows of August 3 and September 3 and 4 — produced a negative signal of bearish continuation, with a break below 154.78 required to validate it and expose targets at the 152.00 zone and 150.92.
Price has traded through 154.78 intraday.
The counterweight to all of this: the long-term uptrend from the 2011 low at 75.56 remains in progress, with a medium-term projection target as high as 176.55. Nothing that has happened in the past week changes a fifteen-year structural trend. What it changes is the intermediate one.
Two frameworks, two conclusions. The daily chart says lower. The multi-decade chart says this is a correction inside a bull market.
For a trading horizon of weeks, the daily chart wins.
Support: 154.78, 154.26, and the 152.00 Floor
The downside map has three tiers and the first two are already in play.
Immediate support is 154.78, the 38.2% Fibonacci retracement of the 139.88 to 163.98 uptrend. A break below it validates the bearish continuation signal.
Beneath that sits 154.26, the top of the rising and thick daily Ichimoku cloud — significant support that has not been tested in this move. The February 24 low near 154.00 is the level the pair is currently testing, and the February 23 low sits at the same area.
The second tier runs 152.00 to 152.20. The late January lows just above 152.00 correspond to the January 25 trough and the 50% retracement of the primary uptrend. Year-to-date lows sit around 152.20. That band is where the pair spent late January before recovering, and it represents the last visible structure before the head-and-shoulders target.
The third tier is 150.92, the July 27, 2025 spike high, followed by the pattern targets at 149.60 and 149.07.
Distance from 154.06: 152.20 is 1.2% down, 150.92 is 2.0%, 149.60 is 2.9%, and the 2025 low at 139.87 is 9.2%.
Key daily support from the end-April to early-May lows near 155.50 has already given way. The psychological level at 155.00 was the line traders were watching, and its break was described as the point where sellers would find fresh legs to keep the downside run going.
They have.
The support area around 155.00 had held downside attempts several times since May. When key supports like that break, they tend to boost confidence for bears, and the pressure shifts toward the February low and then the year-to-date lows.
The one factor that argues for a pause: daily studies are in full bearish configuration but oversold, which may provide headwinds to further immediate downside. Oversold conditions in a trending market delay moves rather than reverse them, but they do produce sharp corrective bounces that trap late sellers.
The 154.26 cloud top is where that bounce would most likely originate.
Resistance: 155.15, the 156.70 Shelf, and the 158.50 Two-Hundred-Day
The upside is now cluttered with broken supports that have converted to resistance.
The first level overhead is 155.15 to 155.20, the zone the pair broke Monday and the area defined by the lows of August 3, September 3, and September 4. Reclaiming it would negate the head-and-shoulders neckline break and turn the intraday bias neutral.
Above that, 154.78 has already become resistance on the Fibonacci framework, and stronger upticks are expected to be capped under the 156.50 to 156.75 zone to keep the larger bearish structure intact and provide better selling levels.
The horizontal shelf at 156.60 to 156.74 corresponds to the August 7 low and has been identified as the level bulls would need to reclaim. Above 156.74, intraday bias turns neutral.
Beyond that, the map runs to 158.05 — the area between the August 18 and 19 lows — and then the 200-day simple moving average at 158.50. The 100-day SMA sits at 159.92, and the pair holds well below it, which confirms the broader uptrend framework remains above price with sellers in control.
The heavier resistance band is 159.59 to 160.62, corresponding to the 50% and 61.8% retracements of the 163.97 to 155.22 decline. That zone would cap any meaningful recovery and coincides with the head-and-shoulders right shoulder at 160.38.
Distance from 154.06: 155.20 is 0.7% up, 156.70 is 1.7%, 158.50 is 2.9%, 159.92 is 3.8%, and 160.38 is 4.1%.
The condition for any of it is a catalyst, and the only one available before the central bank meetings is Friday's US CPI. A hot core print that pushes Fed hike odds past 70% while the BoJ meeting still sits ten days out would produce the corrective bounce the oversold readings imply.
ING's year-end 2026 forecast sits at 158, with downside risks if Fed hawkishness abates on lower US inflation and softer activity. At 154.06, spot trades 2.5% below that projection with under four months remaining.
Even the bullish house view now requires a recovery rather than a continuation.
Realistic ceiling this week absent a hot CPI: 156.00. Clearing 156.74 requires the Fed to hike and the BoJ to disappoint.
Momentum: RSI at 27 and a 10/200 Death Cross
The momentum picture is uniformly bearish and stretched, which creates a specific kind of risk.
The daily Relative Strength Index has reached oversold levels near 27, and the MACD on the same timeframe is heading lower at sub-zero levels. That combination reinforces the downward momentum despite the risk of a corrective bounce.
An RSI at 27 is deeply oversold by conventional standards. Earlier in the week the reading sat around 32, hovering just above oversold and hinting that downside momentum was stretched but not yet signaling a confirmed reversal. It has since pushed through.
Daily studies are in full bearish configuration, including the recent formation of a 10-day/200-day moving average death cross. Price now holds well below both the 100-day and 200-day moving averages.
The practical consequence of oversold readings in a trending market is not reversal — it is violence. Positions that get stopped out on a 200-pip corrective bounce lose money on a trade whose direction was correct. Anyone short USD/JPY from 156 needs stops placed above 156.74 rather than above 155.20, because the oversold condition guarantees at least one sharp squeeze before the pattern target is reached.
The five-day performance illustrates the momentum. USD/JPY has fallen 2.49% over five sessions, 1.41% over a month, and 1.18% over six months. It remains up 5.18% over twelve months, which shows how much of the 2026 rally has been given back in a single week.
The bearish continuation signal requires the break below 154.78 to validate. Price has traded through it intraday but has not settled below it, and the daily close is what confirms the pattern.
That close arrives Monday evening with US markets shut and liquidity thin — the worst possible conditions for a technically significant settlement. Traders should weight Tuesday's close more heavily than Monday's.
The Ichimoku cloud top at 154.26 provides significant support and sits directly beneath current price. A market that is oversold, sitting on cloud support, and eight days from a live central bank meeting is a market that consolidates rather than extends.
Expect chop between 154.00 and 155.50 into Friday.
Read More
-
Yen Stalls at 160 Despite a 3% JGB and Tokyo Core CPI at 2.0% — Intervention Sits at 164, Friday's Payrolls Decide
02.09.2026 · TradingNEWS ArchiveEnergy
-
QQQ ETF ($706.22) Slides 7.4% Below Its High as the Market Reprices the AI Capex Bill — $686.57 Target if $700 Breaks
22.10.2026 · TradingNEWS ArchiveStocks
-
XRPI ($7.00) and XRPR ($10.74) Slide Toward 52-Week Lows as Spot XRP ETF Flows Stall at $708,510
22.10.2026 · TradingNEWS ArchiveCrypto
-
NG ($2.775) Decoupled From Europe’s €88 Gas Crisis as LNG Feedgas Hits 18.9 Bcf/d — $3.30 Upside on Cold Weather
22.10.2026 · TradingNEWS ArchiveCommodities
-
Dollar-Yen (157.35) Loses 157.65 as the Yen Rallies on Haven Demand — 155 Target if 156 Breaks
22.10.2026 · TradingNEWS ArchiveForex
The Bank of Japan on September 17-18: 25 Basis Points Priced, 50 in Play
The event that has driven this entire move arrives in ten days.
The Bank of Japan holds its policy meeting on September 17-18, 2026. Most economists expect a 25 basis point hike, but a 50 basis point increase is also in play — a genuinely unusual configuration for a central bank that spent a decade at or below zero.
The repricing has been aggressive rather than gradual. The yen was lifted from its multi-decade lows by the first intervention in late July and received a fresh boost from a strong hawkish shift in BoJ rhetoric signalling a rate hike at the September meeting, alongside a change in trader sentiment favoring further yen longs.
The specific catalyst was board member Hajime Takata — one of the BoJ's most hawkish members — who gave a speech leaving the door open for an outsized interest rate increase as well as back-to-back hikes. That phrase, back-to-back, is the one that moved the market. A single 25 basis point hike is priced. A sequence of them is not.
The context for how far Japan has travelled: the BoJ introduced negative interest rates in 2016 and directly controlled the yield on its 10-year government bonds. It lifted rates in March 2024, retreating from ultra-loose policy. The massive stimulus programme caused the yen to depreciate against its main peers, a process that accelerated in 2022 and 2023 as policy divergence with other central banks widened.
That divergence is now closing from the Japanese side rather than the American side, which is a first for this cycle.
Governor Kazuo Ueda leads a board that has become progressively less unified. Takata's hawkishness is not new; what is new is that it now appears to represent the direction of travel rather than a dissent.
The market's positioning into the meeting is the risk. With 25 basis points widely expected and 50 in play, a straight 25 with cautious guidance would be interpreted as dovish relative to expectations and would produce a sharp USD/JPY bounce toward 156.70. A 50 basis point move, or a 25 with explicit signalling of a follow-up, takes the pair to the head-and-shoulders target at 149.60 quickly.
Both outcomes are live. Neither is priced with confidence.
The BoJ publishes its statement and outlook at boj.or.jp.
When the Loudest Dove Converts
The single most informative development of the past week was not Takata's speech. It was who agreed with him.
Takuji Aida, economic adviser to Prime Minister Takaichi and seen as one of the most vocal opponents of BoJ rate hikes, now expects the Bank of Japan to raise rates at its September 17-18 meeting, followed by another hike by January next year. Aida has warned that a faster tightening pace could weigh on the economy — but the warning is attached to an expectation, not a dispute.
Danske Bank flagged this as a marked shift in Japanese policy expectations, noting it suggests more rate hikes may be in the BoJ pipeline.
The political dimension matters. Aida advises the prime minister. Japanese governments have historically resisted BoJ tightening because of the growth cost, and the fiscal position makes higher rates expensive to service. When a government adviser who has publicly opposed hikes concedes that two are coming, the political constraint on the central bank has been lifted.
What lifted it is the cost-of-living side of the ledger. Japanese officials have made clear that a weak yen poses a threat to import costs and to Japan's cost-of-living crisis, which has been a key topic for the electorate. With Brent at $97.50 and Japan importing essentially all of its energy, a yen at 163 was an inflation problem the government could not defend politically.
The trade-off changed. A weak yen used to support exporters and Japanese equities. At 163 with $97 crude, it was destroying household purchasing power faster than it was helping corporate earnings.
That is why intervention arrived on July 31 and why the policy rhetoric has hardened since.
The forecast implication is that the yen now has a policy floor beneath it rather than only an intervention threat. Intervention slows moves; policy reverses them. Markets have spent four years betting against the BoJ and winning. The bet has stopped working.
The residual risk is execution. Aida's own warning — that faster tightening could weigh on the economy — is the constraint that could still cause the BoJ to hike once and stop. A single hike followed by explicit guidance that the cycle is over would be the most dollar-positive outcome available on September 18.
Japanese Yields at 3% for the First Time in Three Decades
The bond market has been leading the currency, and it broke a thirty-year ceiling.
Japan's 10-year government bond yield hit 3% for the first time in three decades on September 1, with the yield last up 6 basis points at 3.001%. Investors demanded a higher premium for holding Japanese debt amid fiscal worries, a weak yen, and rate-hike prospects.
That figure deserves to sit alongside the US 10-year at 4.784% and the two-year at 4.37%. The spread between US and Japanese ten-year yields has compressed to roughly 178 basis points, down from the 400-plus basis points that sustained the carry trade through 2022 and 2023.
The carry trade is the mechanism that took USD/JPY from 102 to 163. Japanese institutions borrowed at zero and bought foreign assets. Every basis point of compression in that spread reduces the incentive, and a JGB yielding 3% is a domestic alternative that did not exist for a generation.
Analysts have flagged the reflexive risk: prolonged weakness in the currency could prompt domestic investors to reduce their holdings of US assets. Japanese repatriation is the tail risk that would take USD/JPY through the head-and-shoulders target in days rather than weeks, because it is a flow rather than a positioning shift.
US Treasury Secretary Scott Bessent added to the pressure, saying he has information the market does not have and that it is his belief the Japanese government and the BoJ will do things that lead to a stronger yen — specifically that Ueda would do the right thing.
A US Treasury Secretary publicly forecasting a stronger yen ahead of a BoJ meeting is close to verbal intervention, and it came before the September repricing.
Officials in both Washington and Tokyo have expressed concerns that disorderly moves in the yen could destabilize global markets. That is unusual alignment — the previous four years featured Tokyo worried about weakness and Washington indifferent.
Both capitals now want the same thing. Both have said so. And the July 31 joint intervention demonstrated they will act together.
That is the strongest structural argument for lower USD/JPY, and it operates independently of any technical level.
Intervention: What July 31 Did and What Last Week Was Not
Distinguishing intervention from repricing is essential for forecasting the durability of this move.
The United States and Japan staged a joint intervention to support the yen on July 31, 2026. Prior to that, Japanese authorities had sold just over $70 billion in late April and early May at levels just above 160.
Those actions established a demonstrated policy floor and a demonstrated willingness to spend. What they did not do is reverse the trend — USD/JPY recovered through August and was back at 160 by September 2.
Last week was different, and MUFG's analysis is the reason to believe it. Bank of Japan current account data for Wednesday do not suggest the moves were driven by intervention, with the firm pointing instead to broader dollar weakness and the policy backdrop. MUFG explicitly ruled out BoJ intervention as the explanation for the 500-pip plunge.
A five big-figure move without intervention is a market repricing on its own. That is far more durable than an official operation, because there is no reserve balance to exhaust and no political limit on how far it runs.
The market has spent the past week weighing the possibility of further Japanese currency intervention against rising expectations for BoJ rate hikes. Both forces point the same direction, which is a configuration the yen has not enjoyed at any point in this cycle.
The outlook for successful intervention has historically been poor when the rate differential was working against the yen. It is no longer working against the yen. Intervention conducted into a converging rate differential, with a hiking central bank ten days away and a US Treasury Secretary publicly endorsing yen strength, has a completely different success probability than intervention conducted into a widening one.
Traders should assume authorities will not need to intervene at these levels. They should also assume that if USD/JPY bounces sharply toward 158 before the BoJ meeting, the threat returns immediately.
The asymmetry that creates: rallies get sold into an intervention threat, declines run without official resistance. That is the mirror image of the environment that prevailed from 2022 through mid-2026.
Intervention data is published by the Bank of Japan and tracked in official series.
The Dollar Side: 162,000 Jobs Against Debt Worries
The American leg has been the weaker driver, and that is the anomaly.
August nonfarm payrolls grew 162,000 against expectations near 55,000, with unemployment steady at 4.1% and June and July revised higher by a combined 55,000. Fed funds futures moved September hike probability to near 60%. The two-year Treasury yield closed Friday at 4.37%, its highest since January 2025, and the 10-year finished at 4.784%.
That package should have sent USD/JPY higher. Strong payrolls stopped the slide temporarily, leaving this week's inflation data to determine whether the rebound sticks.
It did not stick. The pair opened the new week by breaking 155.00.
The reason is on the other side of the ledger. The US dollar faces headwinds from debt worries and uncertainty about the Fed's policy outlook ahead of Friday's CPI release. Concerns about rising government debt and economic policy uncertainty are pressuring the greenback independent of rate expectations — the same dynamic that kept EUR/USD from breaking down after the payroll beat.
The Fed is now in its pre-meeting blackout ahead of the September 15-16 decision. No official can steer expectations, which leaves Friday's August CPI as the last input. The print is expected to split, with headline at 0.4% month over month driven by energy against a benign 0.2% core.
Chairman Kevin Warsh took office in May 2026 and has committed publicly to returning inflation to 2%, a stance that moved hike probabilities from below 40% to 65.4% after his Jackson Hole address.
The problem for dollar bulls is that a hike is already 60% priced. Confirmation delivers limited incremental support, while a benign core print has to unwind a crowded position — and the crowd is long dollars.
Against a currency whose central bank is 90% priced to hike two days later, that asymmetry is brutal.
The sequencing is what makes this week dangerous. Fed decides September 16. BoJ decides September 18. If the Fed hikes and the BoJ delivers 50 basis points, the differential compresses despite both tightening, and USD/JPY continues lower.
Two hikes, one direction. That is the setup nobody positioned for in July.
Two Central Banks, Two Days Apart
The calendar concentrates all the risk into a 48-hour window next week.
The Federal Reserve decides September 15-16 with the target range at 3.50% to 3.75% and hike odds near 60%. The Bank of Japan decides September 17-18 with a 25 basis point hike widely expected and 50 basis points in play.
The permutations and their USD/JPY consequences:
Fed hikes, BoJ hikes 25 with cautious guidance — the differential is roughly unchanged and positioning unwinds. USD/JPY bounces toward 156.70 and possibly 158.05. This is the most dollar-positive outcome.
Fed hikes, BoJ hikes 50 or signals back-to-back moves — the differential compresses meaningfully. USD/JPY breaks 152.20 and targets 149.60.
Fed holds, BoJ hikes 25 — a 25 basis point compression from both sides at once. The head-and-shoulders target completes and 149.07 comes into range.
Fed holds, BoJ holds — a violent short-covering rally in USD/JPY back toward 158, because the entire yen long position built over the past week has no justification.
The probability distribution favors both hiking, which is the outcome the market is least prepared for because it produces continued yen strength through a compressing differential rather than the reflexive dollar strength most models generate.
Before that, this week delivers US August PPI on Thursday alongside the ECB decision, and US August CPI on Friday. Japan has no tier-one releases before the meeting.
That imbalance means USD/JPY trades on American data all week and on Japanese policy next week — with the Japanese leg carrying the larger surprise potential given the 25-versus-50 uncertainty.
Positioning into that combination is expensive. Implied volatility in yen options should be bid all week, and traders expressing a directional view are better served through options than outright futures given the gap risk across two central bank meetings in three days.
Full US release detail is at bls.gov/cpi, with FOMC materials at federalreserve.gov.
Scenario Map: Three Paths Through September 18
Three outcomes are live and the triggers are dated.
The bear case is the base case and carries the highest probability. USD/JPY has completed a head-and-shoulders top by breaking the 154.76 to 155.01 neckline, with the left shoulder at 160.71, head at 163.97, and right shoulder at 160.38. RSI at 27 and a 10/200 death cross confirm the momentum. The measured target sits at 149.60 with a Fibonacci projection at 149.07, and the path runs through 154.26 cloud support, the 152.00 to 152.20 year-to-date lows, and 150.92. The trigger set: a daily close below 154.78, a benign US core CPI on Friday collapsing Fed hike odds toward 40%, and a BoJ hike of 50 basis points or a 25 with explicit back-to-back signalling on September 18.
The corrective bounce scenario is the highest-probability short-term outcome and the one that hurts late sellers. Daily studies are in full bearish configuration but oversold, which provides headwinds along with the significant support at the 154.26 cloud top. A hot US core CPI Friday pushing hike odds past 70%, combined with a BoJ that delivers only 25 basis points with cautious guidance, produces a squeeze toward 155.20, then the 156.50 to 156.75 zone, and possibly 158.05 and the 200-day SMA at 158.50. Stronger upticks should be capped under 156.75 to keep the larger bear structure intact.
The structural reversal scenario requires the BoJ to hold on September 18 while the Fed hikes on September 16. That would invalidate the entire repricing of the past week, force liquidation of yen longs built from 160 down to 154, and target the 159.59 to 160.62 resistance band — the 50% and 61.8% retracements of the 163.97 to 155.22 decline. ING's 158 year-end forecast sits inside that path.
Probability weighting: continued weakness with a sharp corrective bounce somewhere between here and 152 is the base case. The larger question is whether the medium-term correction extends toward the 2025 low at 139.87, which a firm break of 155.01 has now opened as a genuine possibility.
Ten days, two central banks, one completed pattern.
Verdict: Bearish Below 155.15 — 149.60 Is the Target, 156.74 the Invalidation
The forecast is bearish with a warning about oversold conditions. USD/JPY at 154.06 has broken the 155.15 support that formed the neckline of a bearish head-and-shoulders top — left shoulder 160.71, head 163.97, right shoulder 160.38 — and now trades at its lowest level since late February, having fallen five big figures from 160 on September 2 in a move MUFG explicitly attributes to policy repricing rather than intervention. That distinction is the whole trade: intervention-driven moves reverse and policy-driven moves persist. What drove it was BoJ board member Hajime Takata leaving the door open for an outsized increase and back-to-back hikes ahead of the September 17-18 meeting, where 25 basis points is widely expected and 50 is genuinely in play, followed by Takuji Aida — economic adviser to PM Takaichi and among the loudest opponents of tightening — conceding that a September hike and another by January are now his base case. When the loudest dove converts, the political constraint is gone. Underneath it, the Japanese 10-year hit 3.001% on September 1 for the first time in three decades, compressing the US-Japan spread to roughly 178 basis points from the 400-plus that built the carry trade, and Treasury Secretary Bessent has publicly forecast a stronger yen. The measured target from the completed pattern sits at 149.60 with a Fibonacci projection at 149.07, and a firm break of 155.01 opens a medium-term path back toward the 2025 low at 139.87. The path runs through 154.78, the 154.26 cloud top, 152.00 to 152.20 at the year-to-date lows, and 150.92. The risk to that view is mechanical rather than fundamental: daily RSI at 27 with a 10/200 death cross is a fully bearish but deeply oversold configuration, and oversold trends produce violent corrective bounces that stop out correctly positioned shorts. Any rally should be capped under the 156.50 to 156.75 zone, with 156.74 as the level that turns intraday bias neutral and invalidates the immediate bearish setup. Friday's US August CPI is the near-term decider — a hot core takes the pair back toward 156.70, a benign 0.2% core accelerates the decline toward 152. Then the Fed decides September 16 and the BoJ September 18, and the outcome nobody has positioned for is both hiking, which compresses the differential and sends USD/JPY lower anyway. Trade the 155.15 line as resistance, use options rather than futures across two central bank meetings in three days, and stop out above 156.74.





