





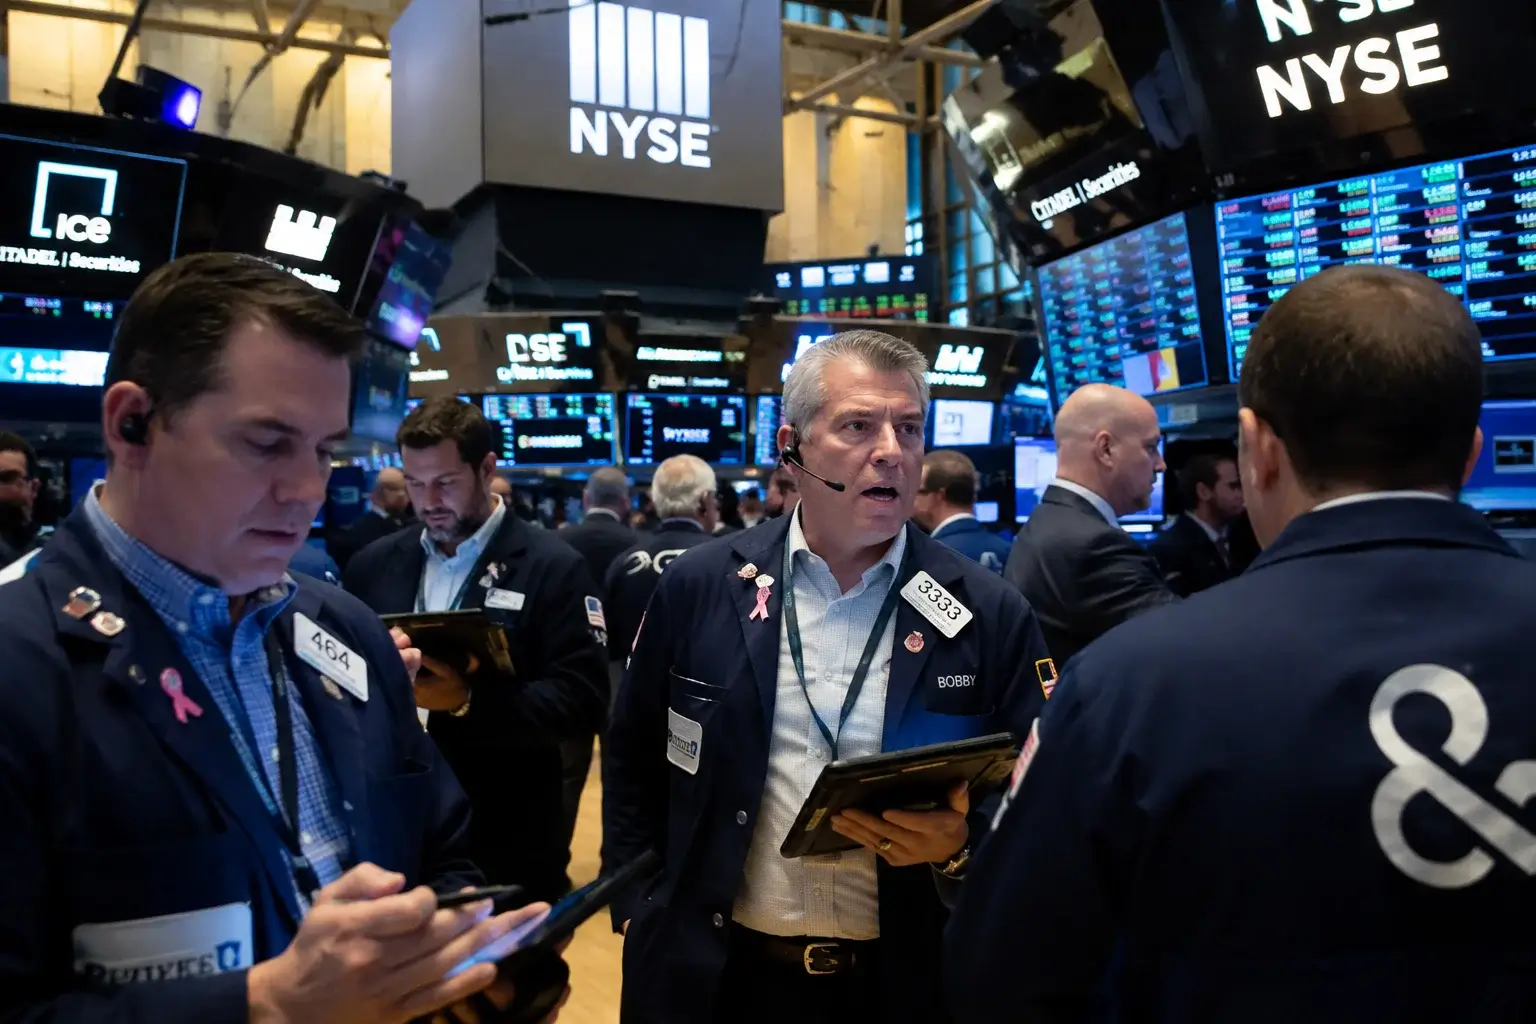
Dow (DJI) 52,552.97, S&P 500 (SPX) 7,533.77 and Nasdaq (IXIC) 25,881.95 Slide as Netflix (NFLX) Drops 10% on Soft Guidance
Netflix guided Q3 revenue 130 basis points below consensus and lost 8.58% after hours to $67.97 | That's TraidngNEWS
Key Points
- Netflix guided Q3 revenue to $12.86 billion versus $13 billion expected, sending shares down 8.58% to $67.97.
- TSMC posted record $40.2 billion revenue and 67.7% gross margin, then fell over 5% on a capex raise to $60–$64 billion.
- Intuitive Surgical beat by 12% at $2.80 per share and dropped 11%, making four of six beats sold this week.
The setup into Friday's open is ugly and it is not ambiguous. S&P 500 futures sit at 7,503.50, down 74.25 points or 0.98%. Nasdaq-100 futures are at 28,688.25, off 537.50 points or 1.84%. Dow futures trade 52,388.00, lower by 398 points or 0.75%. Russell 2000 futures are at 2,969.20, down 21.50 or 0.72%. The VIX has ripped to 18.37, up 1.64 points or 9.80%, a fourth straight session pushing higher. Gold is bid at $4,000.80, up $8.70 or 0.22%. Bitcoin has rolled over to $62,932, down $1,106.01 or 1.73%. All four equity contracts are tracking weekly losses, and the drag is coming from one place: semiconductors.
What matters about this tape is not the size of the move. It is the mechanism. Five sessions ago, the market decided the AI hardware complex had been priced for a level of execution nobody can deliver twice. Since then every confirming data point has been sold. Beats get sold. Raised guidance gets sold. Record profits get sold. That is not an earnings problem. That is a positioning problem, and positioning problems do not resolve on good news — they resolve when the flow exhausts itself.
The thesis for Friday is straightforward: this is a valuation and crowding unwind concentrated in semis and AI hardware, and the index level now depends entirely on whether the rest of the market — banks, energy, healthcare, staples — can absorb the bleed. Thursday it barely did. The Dow lost 105.67 points while the Nasdaq Composite dropped 1.47%. That 127-basis-point spread between the blue-chip benchmark and the tech benchmark is this entire week compressed into one number.
Netflix landing a 9% after-hours hole on top of that is what turns a contained sector event into a broad-tape problem. It opens a second front, in communication services, on a name with nothing to do with wafer capacity or HBM pricing. The bid faded overnight and never came back. The PHLX Semiconductor Index tumbled 4.29% Thursday, and Asia followed on Friday with Japan's Nikkei 225 falling 4%. Two continents, one trade, and no headline required to trigger either leg of it.
Netflix Guides 130 Basis Points Light and the Stock Snaps
Netflix reported second-quarter revenue of $12.56 billion, up 13.4% year over year against a consensus of $12.59 billion. Earnings came in at 80 cents per share versus 79 cents expected. Net income was $3.40 billion. Operating margin printed 33.4%, down from 34.1% a year earlier. On its face that is a quarter clearing the bar by a penny and missing the top line by 0.16%. Nobody trades that.
What got traded was the guide. Netflix put third-quarter revenue at $12.86 billion against the Street's $13 billion, and third-quarter earnings at 82 cents versus 84 cents. That revenue figure implies 11.7% growth. Consensus carried 13%. The deceleration is 130 basis points deeper than modeled, and it lands on a stock already cut hard from its highs. Netflix entered the print down 21% for 2026, and 11.7% marks its slowest guided growth since the third quarter of 2023.
The reaction was violent relative to the miss. Shares closed the regular session at $74.35, up 0.91%, then got smoked to $67.97 after hours, down 8.58%. That print took the stock through its 52-week low of $70.86 and into fresh territory below a range topping out at $127.75. Premarket Friday has it down more than 10%. Over twelve months the stock is off 40%.
The offsets exist and the tape ignored every one. Netflix repurchased $4.7 billion of stock in the quarter, its largest quarterly buyback ever, with $27.1 billion of authorization still open. It held full-year free cash flow near $12.5 billion, kept the full-year operating margin forecast at 31.5%, and narrowed full-year revenue to $51.0 billion to $51.4 billion around an unchanged $51.2 billion midpoint. It reaffirmed $3 billion of 2026 advertising revenue, double the prior year. Third-quarter operating margin is guided to 33.2% against 28.2% a year ago. Free cash flow did fall to $1.53 billion from $2.27 billion on higher cash taxes tied to the Warner Bros. termination fee. First-half viewing hours grew 2% to 97 billion. The stock trades at 23.9 times earnings with a PEG of 0.5. U.S. and Canada revenue grew 10%, underperforming its own trailing four quarters, and only Latin America accelerated sequentially. Management also pulled its engagement disclosure to an annual cadence starting in 2027, which the tape read as defensive.
Thursday's Close Built the Trap: 7,533.77, 25,881.95, 52,552.97
Thursday's tape is the reference point for everything happening Friday morning. The S&P 500 lost 0.51% to end at 7,533.77. The Nasdaq Composite declined 1.47% to 25,881.95. The Dow shed 105.67 points, or 0.20%, closing at 52,552.97. That leaves the S&P sitting 33.77 points above the 7,500 handle and the Nasdaq 281.95 points above 25,600 — the two levels that decide whether futures follow through into cash.
The internals split along a hard line. Inside the Dow the decline was led by Goldman Sachs down 5.02%, Alphabet down 4.64% and Caterpillar down 4.15%, while the strongest performers were Nike up 4.04%, IBM up 3.90% and Salesforce up 3.36%. A session where the index loses 20 basis points while its worst component drops 5.02% is a session where money is rotating, not leaving. That distinction is why the Dow has held while the Nasdaq bleeds. Abbott ripped over 10% on earnings the same day.
Tuesday's session, two days earlier, was the mirror image. The S&P closed up 0.38% at 7,543.59, the Nasdaq advanced 0.9% to 26,107.01, and the Dow added 9.63 points, or 0.02%, to 52,508.27 as semis rebounded and the VanEck Semiconductor ETF traded 2.5% higher on the June CPI print. IBM weighed on the 30-stock index that day, down 25% after warning second-quarter profits would land below expectations on soft software and infrastructure demand. Three sessions later IBM is a top Dow gainer. That is the whipsaw this tape is producing.
From Tuesday's 26,107.01 to Thursday's 25,881.95, the Nasdaq Composite has given back 225.06 points, or 0.86%. Add Friday's 1.84% futures decline and the drawdown runs to 2.7%. The S&P has traveled from 7,543.59 to 7,533.77 across the same window — a loss of 9.82 points, or 0.13%. The gap between those two numbers is the whole trade: index-level damage of nothing, tech-level damage approaching 3%. Money is moving inside the market, not out of it. That holds until the destinations run out. On July 6 the Dow closed above 53,000 for the first time. It is now 447.03 points below that mark and the Nasdaq is doing the heavy lifting in the wrong direction.
TSMC Printed Records, Raised Everything, and Got Sold
The cleanest illustration of this week's mechanism came out of Taiwan. TSMC delivered second-quarter revenue of $40.2 billion, the very top of its $39.0 billion to $40.2 billion guide and up 36% year over year. Gross margin printed 67.7%, above the guided 65.5% to 67.5% band. Net profit surged 77% to $22 billion, a record. Full-year revenue growth guidance went to above 40% from above 30%. Capex went to $60 billion to $64 billion. U.S. investment commitments went to $265 billion. The stock dropped more than 5%.
There is no soft spot in that release. The company beat, raised, and expanded margins simultaneously, at scale, in the one business sitting underneath every advanced AI chip that ships. And it got hit for 5% into a sector-wide flush that then exported itself straight into Asia.
The fear is not the top line. It is the capex line. The prior range was $52 billion to $56 billion. The new range lifts both ends by $8 billion, 15% higher. A foundry spending that aggressively is either confirming demand visibility through 2028 or building capacity into a cycle that tops first. The market picked the second reading and expressed it across the entire supply chain.
The technicals confirm the break. TSM trades near $406, below the prior $410 to $419 support zone and below both EMAs, with RSI at 38. Support sits at $397.70, then $386.20. Recovery requires a close back above $419. The stock was $426.62 two days before the print and touched $474.71 at its high. It is still up 52% in 2026, which is precisely the problem — the gains that need defending are enormous.
This is the second consecutive instance of the pattern. ASML lifted guidance on July 15 and closed lower. TSMC beat and raised on July 16 and closed lower on the 17th. Two of the most consequential reports on the semiconductor calendar, both clearing the bar, both sold. The bar is not set at the consensus number anymore. It is set at perfection, and perfection has no upside. June revenue at TSMC ran NT$442.68 billion, up 67.9% year over year, with first-half revenue of NT$2,404.48 billion, up 35.6%. None of that mattered for a single tick.
Memory Is Where the Damage Concentrated
The epicenter of this unwind is memory, and the dislocation between price and fundamentals there is getting extreme. Micron plunged 6% Thursday as the selloff in memory names extended, taking the stock 17% below its $1,213 peak. Micron closed July 14 at $904.28, trading at 6.8 times forward earnings against a long-run average of 16.8 times — a third of what the market has historically paid for its future profits, from the best-performing SOXX holding of the past year, up 654%. The stock has since broken $910 and $898 support with nothing obvious beneath.
The sector benchmark says the same thing with less noise. SOXX has fallen 13.2% over four weeks, the sharpest four-week move for the fund since April 2025, with the drawdown from the late-June peak at 15%. It gained 102.6% from its February low into that high and remains up 84.6% year to date against 17.1% for the Nasdaq-100 tracker. Its PEG ratio sits at 1.26, the lowest reading since 2016, against 1.56 for QQQ. The fund started the year near $308 and changed hands above $562 last week.
Read that literally. The market is now pricing semiconductors to grow faster than the broader tech index while costing less per unit of that growth, for the first time in a decade. Either the growth estimates are wrong or this is a mechanical unwind of the most crowded position on the board.
The competitive overhang is real and it is Chinese. CXMT's plan for an $8.5 billion IPO landed directly into this tape, and the read-across to commodity DRAM pricing is what pushed memory through support. The counter is that export limits keep CXMT out of the highest-end AI-server memory, which is exactly where Micron's mix advantage lives — HBM booked through fiscal 2026 across 16 long-term customer agreements. SK Hynix and SanDisk both fell over 7% on July 16. Western Digital was among the hardest hit. Kioxia slumped over 15% in Tokyo. Intel cratered 21% across seven trading days and is testing double-bottom support near $94 ahead of its July 23 report, where it has guided revenue up to $14.8 billion. The group has stopped discriminating between commodity DRAM exposure and AI-server exposure. That is what capitulation looks like from the inside.
Alphabet's Second Down Day Turns a Delay Into a Multiple Problem
Alphabet is down 1.5% premarket, a second consecutive decline, after tumbling 4.43% Thursday on reports that its Gemini 3.5 Pro model — positioned as the company's most capable — has slipped its schedule by months.
The size of the reaction is the tell. A model delay of a few months, at a business generating hundreds of billions in advertising revenue, is worth a 4.43% haircut in market capitalization only if the market has been paying for the model rather than the cash flows. It has been. Alphabet carried the March-to-June melt-up, joined the Dow at the end of June, and rallied alongside the rest of Big Tech on July 6. That positioning is the exposure, and it is being unwound in exactly the same manner as the semis.
Management's answer on the call was that the innovation cadence remains relentless and that confidence in holding momentum through 2026 is intact. Sundar Pichai said it directly. The tape did not care, which is the recurring feature of this week — verbal reassurance against a mechanical unwind accomplishes nothing.
The second-order read matters more than the headline. Alphabet is a TSMC customer, a memory buyer, and one of the hyperscalers underwriting the entire AI hardware complex through its capital budget. A stumble in its model roadmap is precisely the data point that gets extrapolated into the capex question that just hammered TSMC and Micron. If the leading-edge model race slows, defending $60 billion to $64 billion of foundry capex gets harder, and defending HBM pricing power gets harder with it. That linkage is why one Gemini headline moved three industries in a single session.
Alphabet also sits inside the crosscurrent of the July 15 rotation, when money paring semiconductor exposure moved into large-cap platforms — Amazon and Alphabet up 3%, Microsoft up nearly 3%, Apple up 4% to a record high. Two sessions later Alphabet is handing that back. When the rotation destination itself starts selling off, the index no longer has a place to hide the flow, and the S&P's 33.77-point cushion above 7,500 stops looking like a cushion. Alibaba rose 3.26% and Baidu 2.51% in Hong Kong on an Apple AI partnership the same day.
Intuitive Surgical Beat by 12% and Lost 11%
The most instructive single-stock event of the session has nothing to do with chips. Intuitive Surgical reported adjusted earnings of $2.80 per share against a $2.50 estimate — a 12% beat — on revenue of $2.89 billion versus $2.82 billion expected. It maintained its full-year outlook for da Vinci procedure growth at 14%. The stock fell 10.8% after hours to $358.93 and is down more than 11% premarket.
That is a 12% earnings beat, a revenue beat, and a maintained guide, met with an 11% drawdown. Shares had closed the regular session at $402.33, up 3.43%, on a day the Nasdaq lost 1.47%. Twelve hours later they gave back three times the gain.
The mechanics are gross margin and expenses. A maintained procedure growth outlook was read as an unchanged ceiling rather than a floor, and tariff-related margin pressure plus rising operating expense pushed the focus off the headline beat entirely. Intuitive was already having a punishing 2026, down 29% on the year before this print. A stock down 29% with a 12% beat that still loses 11% is telling you the sell-side model is not the marginal price setter — flow is.
That pattern is now this week's signature. TSMC beat and raised and got sold 5%. ASML raised and closed lower. Netflix beat on earnings and got sold 10%. Intuitive beat by 12% and got sold 11%. Truist beat by 15 cents and got a 1.4% bid, which counts as the exception. Abbott ripped 10% on Thursday, which counts as the other one. Four of six major beats this week were sold. The hit rate on good news is 33%.
That is what a de-risking tape looks like. It is not about whether the quarter was good. It is about whether the position was crowded going in, and how much of the forward multiple was already banked. Every name getting punished this week entered with either an enormous twelve-month gain to defend or a chart already in a downtrend that nobody wanted to catch. Intuitive was the second category. TSMC was the first. Netflix was both — 21% down on the year and still handed a 10% haircut for guiding 130 basis points light.
Truist Beat by Fifteen Cents and the Tape Barely Moved
The regional bank tape closes out the week's earnings docket and it is delivering the only clean upside in the session. Truist Financial reported earnings of $1.23 per share against a $1.08 estimate — a 15-cent, 13.9% beat — with revenue also above expectations against a $5.24 billion consensus. Shares are up 1.4% premarket after closing at $52.31 and trading down 1.8% after hours on Thursday. The stock closed $51.95 on Tuesday.
A 13.9% beat generating a 1.4% move is the arithmetic of a tape that has stopped rewarding fundamentals. It is also arriving into a name the Street had already given up on. Truist absorbed three sell-side downgrades in the first eight sessions of July, with price targets landing in the $54 to $56 band. It is the worst performer among the seven regional banks reporting this week, up 5% year to date against 14.56% for the regional bank ETF and 20%-plus gains for five of the seven. Options positioning implied a 3.2% move on the print. It got 1.4%.
Fifth Third Bancorp reports before the bell with a 95-cent estimate on $3.25 billion of revenue, and has beaten earnings estimates ten straight quarters. Travelers reports with a $5.36 estimate on $11.35 billion, and closed at $338.00, up 0.1% after hours.
Elsewhere in the premarket, Alcoa slipped 2% despite adjusted earnings of $2.12 against a $2.06 estimate on revenue of $3.97 billion versus $3.94 billion — the company lowered its 2026 alumina production outlook and that overrode the beat. SpaceX fell more than 3.5% after aborting a Starship launch on engines that failed to start, with Elon Musk promising another attempt within days; the stock closed $131.11, down 3.08%, with a $137.76 high and $130.74 low, and has already broken below its IPO price weeks after debuting. It now sits in 179 U.S.-listed ETFs. GSK is down more than 2% after halting development of camlipixant, the chronic cough drug from its $2 billion Bellus Health acquisition, which missed its primary endpoint. STAAR Surgical fell 5.6% on preliminary second-quarter numbers. Verizon rose 1% on selling 274 company-owned storefronts and cutting 500 corporate jobs. BP and ConocoPhillips are both up more than 1% on crude.
The June CPI Print Is Doing All the Heavy Lifting
The only thing keeping this tape from a genuine break is the inflation data, and it was better than anyone modeled. Headline CPI fell 0.4% in June against a Dow Jones estimate of a 0.2% decline, the largest single-month drop since April 2020, pulling the annual rate to 3.5% from 4.2% in May against a 3.8% forecast. Core CPI was flat on the month versus a 0.2% expected rise, putting the twelve-month core rate at 2.6% from 2.9%, three-tenths below consensus and the lowest since February.
The composition is entirely energy. The energy index fell 5.7%, its largest one-month decline since April 2020. Gasoline dropped 9.7%. Electricity fell 1%. Shelter rose 0.1%. Food rose 0.2%. Communication services, motor vehicle insurance and medical care all declined. Over twelve months energy is still up 15.7% and gasoline up 26.7%, which is the entire reason the annual rate sat at 4.2% in May.
The policy consequence was immediate. Market-implied odds of a rate hike at the upcoming meeting collapsed to 15% from 40% before the release. Read that again — the pricing debate this year is about hikes, not cuts, and the June print is what took the near-term hike off the table. Fed Chair Kevin Warsh testified before Congress the same morning and said the Fed has no tolerance for persistently high inflation. On this data he does not have to prove it.
The problem is durability. A 0.4% monthly decline driven by a 9.7% gasoline drop is a one-off with an expiration date attached, and that date is being set in the Strait of Hormuz right now. The June relief reflects the post-ceasefire collapse in crude that took Brent from an $85 June average to below $70 on July 1. Crude has since ripped back above $79. July CPI, out August 12, will carry the reversal. The disinflation that is currently underwriting equity multiples has a two-week half-life if this week's energy move holds, and the market knows it. That is why a 2.6% core print bought exactly one green session before the chip unwind resumed on Wednesday.
Read More
-
Yen Stalls at 160 Despite a 3% JGB and Tokyo Core CPI at 2.0% — Intervention Sits at 164, Friday's Payrolls Decide
02.09.2026 · TradingNEWS ArchiveEnergy
-
QQQ ETF ($706.22) Slides 7.4% Below Its High as the Market Reprices the AI Capex Bill — $686.57 Target if $700 Breaks
22.10.2026 · TradingNEWS ArchiveStocks
-
XRPI ($7.00) and XRPR ($10.74) Slide Toward 52-Week Lows as Spot XRP ETF Flows Stall at $708,510
22.10.2026 · TradingNEWS ArchiveCrypto
-
NG ($2.775) Decoupled From Europe’s €88 Gas Crisis as LNG Feedgas Hits 18.9 Bcf/d — $3.30 Upside on Cold Weather
22.10.2026 · TradingNEWS ArchiveCommodities
-
Dollar-Yen (157.35) Loses 157.65 as the Yen Rallies on Haven Demand — 155 Target if 156 Breaks
22.10.2026 · TradingNEWS ArchiveForex
Crude at $79.74 Puts a Clock on the Inflation Relief
The energy tape is the counterweight to everything the CPI print delivered. September Brent advanced 0.9% to $85.01. August WTI gained 1% to $79.74, having settled Thursday at its highest since June 15. Both contracts are up more than 11% this week and tracking their best weekly performance since late April. Brent has risen 7.64% over the past month and 24.07% year over year.
The driver is the collapse of the June framework. U.S. Central Command has completed a sixth consecutive night of strikes against Iran, hitting military logistics infrastructure and maritime capabilities. The U.S. reimposed a naval blockade on Iranian ports and coastal areas and reportedly struck an oil tanker near Iran's main export terminal for the first time since the blockade returned. Iran retaliated against U.S. bases in Kuwait and Jordan. Tehran has instructed Yemen's Houthis to stand ready to close the Bab el-Mandeb Strait — Saudi Arabia's Red Sea export route — if Iranian power infrastructure is targeted. President Trump said U.S. forces would hit Iran's infrastructure next week absent a diplomatic breakthrough. The Treasury authorization permitting Iranian oil sales expired at 12:01 a.m. EDT today.
The chokepoint math is what matters. Hormuz handles 20% of the world's oil traffic. Tanker transits have fallen sharply since the escalation, though some vessels are still moving. Trump abandoned his demand for a 20% cargo protection fee after the shipping industry pushed back and the IMO ruled mandatory tolls illegal, and Gulf states will invest in the U.S. instead. Iran agreed to no toll for 60 days under the June 17 interim deal.
The macro consequence is a live inventory problem. The EIA now forecasts global oil consumption falling by an average of 1.2 million barrels per day in 2026, with 0.8 million of that from non-OECD countries, before rebounding 2.0 million barrels per day in 2027 to 104.8 million. Brent averaged $85 in June, $22 below May, and traded above $114 in March at the peak of the war premium. The round trip from $114 to $70 to $85 in four months is the volatility the CPI series is now importing directly. Energy stocks are the only green on the premarket board.
The Bond Market Is Voting Risk-Off, Not Reflation
The rates complex is confirming the equity signal rather than contradicting it, which is what makes this a de-risking event rather than a rotation. The 10-year Treasury yield is more than 4 basis points lower at 4.525%. The 2-year, which tracks near-term Fed pricing, shed 3 basis points to 4.124%. The 30-year, the maturity most sensitive to geopolitical stress, is more than 3 basis points lower at 5.061%.
Every point on the curve is bid. That is the tell. If this were a growth scare driven by inflation, the front end would sell off and the curve would flatten from the wrong direction. If it were pure geopolitical hedging, the long end would outperform the belly. What is actually happening is a parallel shift lower — capital moving out of the highest-multiple equity exposure and into duration without discriminating. The 2s10s spread sits at 40.1 basis points, and the 10s30s at 53.6 basis points.
The 30-year at 5.061% is the number to watch through the weekend. That yield is carrying the Hormuz risk premium and the term premium from a hike-versus-cut debate that has swung 25 percentage points in market-implied probability in three days. A 30-year above 5% with a 2.6% core CPI print is not a bond market that believes the June disinflation is durable. It is a bond market pricing the July energy reversal that has not shown up in the data yet.
Gold at $4,000.80 confirms the same read from the other side. It is up 0.22% on the session, holding the $4,000 handle against a dollar that fell 0.6% on the CPI release. Bitcoin at $62,932, down 1.73%, is not confirming anything except that it trades as a Nasdaq beta instrument in a chip unwind. It has shed $1,106.01 overnight while the semis were being flushed in Asia.
The cross-asset picture is internally consistent: duration bid, gold bid, crude bid, VIX up 9.80%, high-multiple equity offered, crypto offered. That is a textbook risk-off configuration with an energy shock stapled to it. What it is not is a growth panic. Credit is not moving and the 2-year is only 3 basis points lower.
Consumer Sentiment at 10:00 a.m. ET Is the Only Scheduled Catalyst
The economic calendar has exactly one entry that can move this tape, and it lands 30 minutes after the open. The University of Michigan's preliminary July consumer sentiment reading prints at 10:00 a.m. ET.
The base is low and the trajectory is fragile. June's final reading came in at 49.5, revised up from a 48.9 preliminary and against a 50 forecast, marking the first improvement in four months. It followed May's 44.8, the lowest level on record. The expectations gauge printed 50.7, a three-month high and up from 49.3 in the initial estimate. Current conditions were revised down to 47.7 from 48.4, against 45.8 in May. Year-ahead inflation expectations eased to 4.6% from 4.8%, still far above the 3.4% recorded in February before the Iran conflict started. Long-run expectations fell to 3.3% from 3.4% preliminary and 3.9% in May. Overall sentiment sits 13% below January and 19% below a year ago.
The entire June improvement was gasoline. Expected business conditions over the next five years surged 16% as concern over the long-term consequences of the Iran conflict eased. Lower-income households, where gasoline is the largest share of the budget, showed the strongest gain.
Every input that produced that reading has reversed. The July survey window captures a war re-escalation, six straight nights of U.S. strikes, an 11% weekly move higher in crude, and a Hormuz transit collapse. Gasoline at the pump follows WTI with a two-to-three-week lag, which puts the July survey right in the transmission window. Prediction markets are pricing the print with an unusually wide distribution — one book has the 40.0 to 42.9 range at 61%, another has readings of 55.0 or higher and the 43.0 to 45.9 range each near 54.5%. That spread is not a forecast. It is an admission that nobody has a model for this.
A sub-45 print pulls the record low back into view and hands the bears a consumer story to layer on top of the chip unwind. Anything holding 49 keeps the June recovery intact and gives the tape a reason to stabilize into the weekend. The inflation expectations sub-index matters more than the headline for rates, given a Fed chair who just told Congress he has zero tolerance for persistent inflation.
Asia Front-Ran the Damage Overnight
The Friday setup was written in Tokyo and Seoul before U.S. futures did anything. Japan's Nikkei 225 fell 4%. Kioxia slumped more than 15%. South Korean markets were closed for a storm, which removed the natural venue for the memory flush and concentrated it into Japan and the U.S. premarket instead.
That sequencing matters. The Thursday U.S. session produced a 4.29% decline in the PHLX Semiconductor Index. Asia then repriced its own semiconductor complex against that mark overnight, with TSMC's Taipei listing absorbing the capex read-through and dragging its U.S. ADR to $406. By the time U.S. futures opened, the damage was already in the price, which is why Nasdaq-100 contracts are down 1.84% before a single U.S. share has traded.
Thursday's Asian tape had been mixed rather than uniformly negative. Hong Kong's Hang Seng was up 1.29% in its final hour, led by real estate up 2.17% and consumer cyclicals up 2.07%, with Alibaba rising 3.26% and Baidu 2.51% on their Apple AI partnership. Mainland China's CSI 300 closed 1.85% lower at 4,698.43. That divergence — Hong Kong bid on platform AI, the mainland offered — is the same rotation the U.S. ran on July 15 and is now unwinding.
Earlier in the week the Korean leg was the epicenter. SK Hynix led the July 13 semiconductor decline after its Nasdaq debut drew profit-taking in Seoul, pulling Micron down 6% in the U.S. premarket before the open. The KOSPI plunged nearly 10% intraday during the early-July flush and triggered circuit breakers, with Samsung Electronics and SK Hynix each sliding 9% to 12%. Samsung had reported preliminary second-quarter operating profit of 89.4 trillion won, up more than 1,800% year over year, and fell 7% on it.
Outside tech, the European tape gave two data points that went nowhere. ABB agreed to buy U.K. flow control maker Rotork for £4.1 billion, or $5.6 billion, its largest acquisition ever. The U.K. economy grew 0.1% in May, in line with consensus, after a 0.1% April contraction and 0.3% March growth. Neither registered against the semiconductor flow.
What Has to Hold: 7,500 on SPX and 25,600 on IXIC
The levels are tight and the math is simple. The S&P 500 closed at 7,533.77, leaving 33.77 points, or 0.45%, of cushion above 7,500. Futures at 7,503.50 have already spent it. The Nasdaq Composite closed at 25,881.95, with 281.95 points, or 1.09%, above 25,600. Nasdaq-100 futures down 1.84% imply the Composite opens through that level rather than at it. The Dow closed at 52,552.97, 447.03 points below the July 6 record close above 53,000, with futures at 52,388.00 pointing to a break of 52,500 at the bell.
The bull case rests on three numbers. Core CPI at 2.6% is the lowest since February and cut the near-term hike probability to 15% from 40%. TSMC guided full-year revenue growth above 40%, an increase from above 30%, and raised capex 15%, which is a demand signal regardless of how the tape traded it. SOXX at a 1.26 PEG is the cheapest per unit of growth since 2016 while still up 84.6% year to date.
The bear case rests on one. Four of six major earnings beats this week were sold — TSMC down 5% on a record, Netflix down 10% on a penny beat, Intuitive down 11% on a 12% beat, ASML lower on raised guidance. Truist up 1.4% on a 15-cent beat and Abbott up 10% are the exceptions that define the rule. When the market stops paying for beats, the marginal bid is gone and price is set entirely by exit flow.
Crude at $79.74 and Brent at $85.01, both up 11% on the week, are the variable that decides whether this stays a sector event. The June CPI relief was 100% energy. Gasoline fell 9.7% and is now reversing in real time. If July CPI on August 12 carries an energy reversal into the headline, the 15% hike probability reprices toward 40% and the multiple support underneath the entire tape goes with it.
Watch 7,500 into the close and 4.525% on the 10-year. If the S&P holds the handle on a 1% futures gap and yields stay bid, this is a chip unwind that has found its floor. If it doesn't, the next reference is 7,400, and the Nasdaq's 25,600 goes first.




