


EUR/USD Price Forecast - EUR at 1.1579 — Rising Channel Broken, DXY Eyes 100.00
February NFP sheds 92,000 jobs but wages surge 3.8%, ECB frozen by stagflation with Lagarde, De Guindos and Rehn all warning Friday | That's TradingNEWS
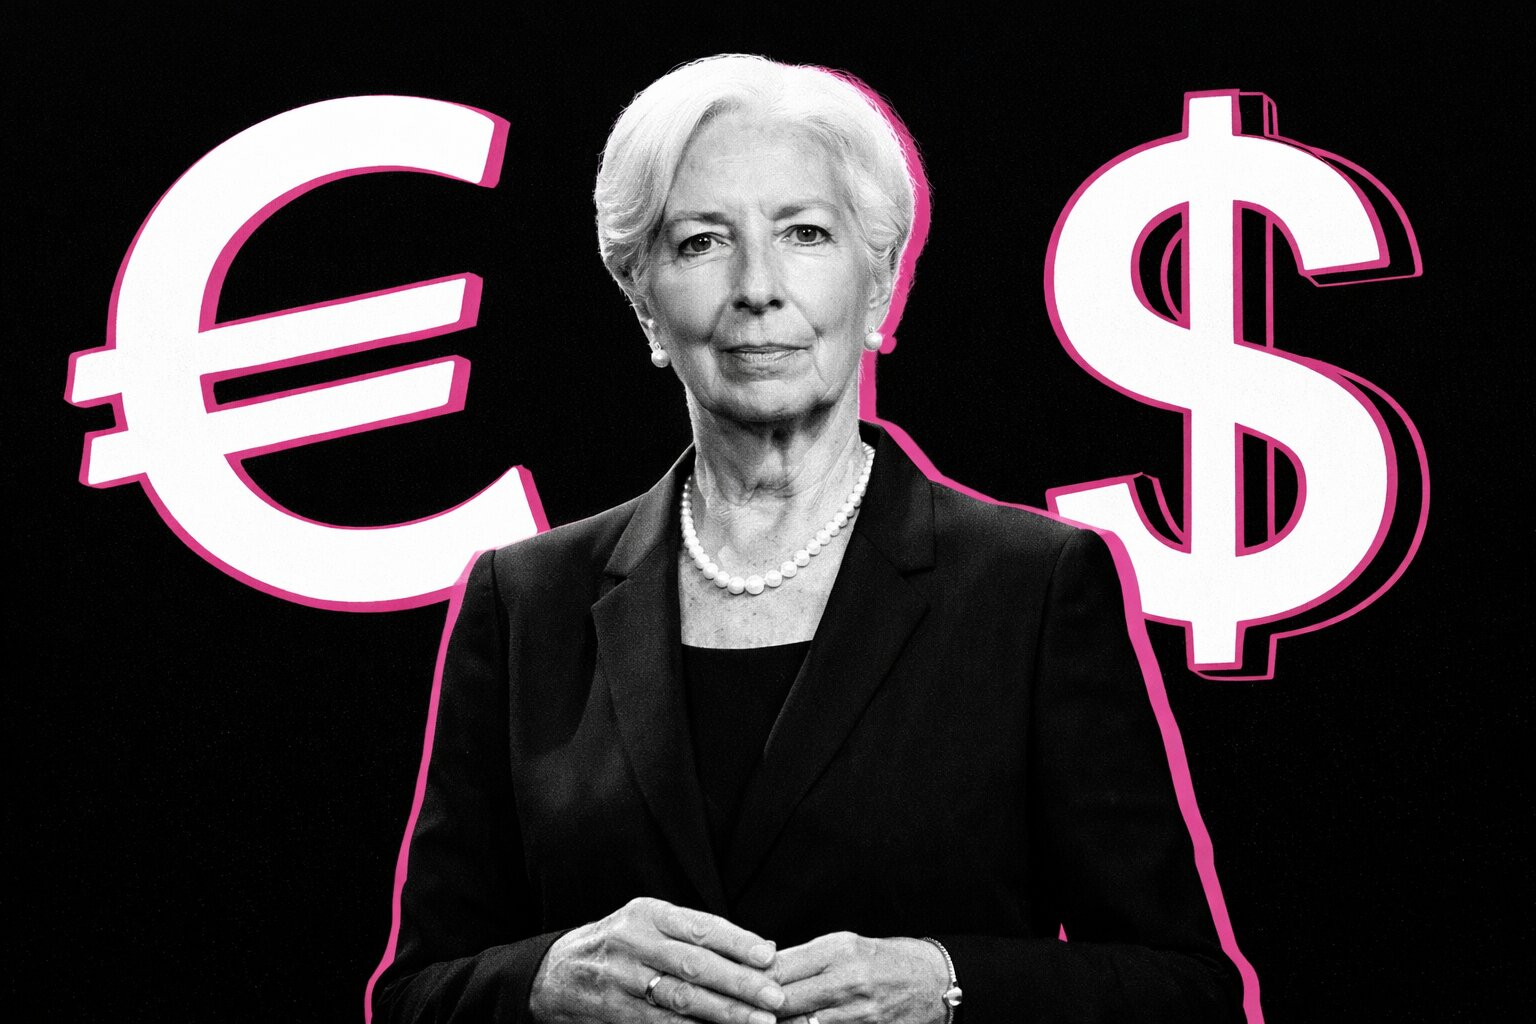
EUR/USD at 1.1579 — Channel Break, RSI at 40, DXY Targeting 100.00, and Every Rally Is a Selling Opportunity
EUR/USD is trading at 1.1579 on March 6, 2026 — rejected at 1.1644, pressing the January low of 1.1578, below both the 50-day and 200-day EMAs, and having broken the rising channel that contained price since mid-2025. That channel break on a daily close is not a routine technical development — it is a regime change from buying dips to selling rallies. The Dollar Index holds 99.21, RSI sits at 40, and Brent crude above $91 is doing more damage to the EUR than any Fed speech could repair.
Why Oil at $91 Destroys the EUR and Supports the USD
The structural asymmetry is stark and measurable. The U.S. has been a net oil exporter since 2019 — when Brent crosses $90, XOM, CVX, and OXY generate record cash flows while the broader U.S. growth picture absorbs the energy shock with significantly more resilience than Europe. Europe imports the majority of its energy. Every dollar Brent adds above $70 is a direct tax on European corporate margins, consumer spending, and manufacturing input costs — particularly Germany. ECB Vice President Luis de Guindos, Governing Council member Olli Rehn, and Christine Lagarde all delivered identical caution Friday: rising energy prices complicate inflation while simultaneously destroying growth. Three officials, same message, same day — the ECB has no clean policy response to a supply-side stagflation shock. That institutional paralysis is structurally bearish for the EUR.
Read More
-
FDVV Slips Near $60 as the "High Dividend" ETF's Hidden Tech Top — NVIDIA, Apple, Microsoft — Gets Caught in the AI Air Pocket
26.06.2026 · TradingNEWS ArchiveStocks
-
IBIT Drives Bitcoin ETF Flows Negative for 2026 as $7.2B Exits Across Two Record Streaks — But On-Chain Data Says Cyclical, Not Structural
26.06.2026 · TradingNEWS ArchiveCrypto
-
Natural Gas Holds $3.30 on Expiry Day as Next Week's Heat Wave Overpowers a Bearish Storage Print and Record Production
26.06.2026 · TradingNEWS ArchiveCommodities
-
Dollar-Yen Grinds to 40-Year Highs Near ¥161.70 as the Warsh Fed Keeps the Rate Gap Wide and Tokyo's Intervention Threat Loses Its Bite
26.06.2026 · TradingNEWS ArchiveForex
DXY at 99.21 — Ascending Channel, Both EMAs Holding, $100.00 in Sight
The Dollar Index holds above its 50-day EMA at 98.87 and 200-day EMA at 98.03, consolidating just above the 0.236 Fibonacci level at 99.18. RSI at 55-60 signals steady directional momentum without exhaustion. A sustained break above 99.50 targets 99.68 then 100.00. Chicago Fed's Austan Goolsbee reinforced Fed independence and institutional credibility Friday — implicitly supporting restrictive policy if inflation persists. The February Challenger layoffs fell to 48,307 from January's 108,435 — corporate America is not in distress-firing mode, removing the one data argument that could have justified broad dollar selling.
NFP -92,000 But Wages +3.8% — The Stagflation Trap That Freezes Both Central Banks
February payrolls fell 92,000 against a 58,000 consensus. December revised to -17,000 from +65,000. The three-month average is 6,000. The six-month payroll average is negative for the fourth time in five months. In any normal environment this kills the dollar. But average hourly wages grew 0.4% versus 0.3% expected, up 3.8% year-over-year — combined with oil at $91, that is the stagflation triangle. The Fed cannot cut into accelerating wages and energy-driven inflation. CME FedWatch shows only 35.3% probability of any cut through June. The ECB is equally frozen. Two central banks paralyzed by the same shock — but the USD benefits from safe-haven flows and energy export revenues while the EUR absorbs the growth destruction. EUR/USD bounced from lows toward 1.1600 on the NFP miss and immediately faded. A major data miss that cannot hold the pair above 1.1600 for more than minutes is the most bearish signal the market can generate.
Technical Structure — 1.1578 Is the Line, 1.1468 Is the Target
The 9-day EMA sits at 1.1686. The 50-day EMA at 1.1753. The upper descending channel boundary at 1.1790. Every moving average is above price and sloping downward. RSI at 35 on the daily chart sits below the 50 midline — not oversold, not inviting contrarian buying, just sustained bearish pressure with room to run lower. The 0.382 Fibonacci resistance at 1.1644 has rejected every recovery attempt. Below the current 1.1578-1.1531 zone, the seven-month low of 1.1468 is the next structural target, followed by 1.1400 and the low 1.10s on a full Hormuz closure scenario.
EUR/USD is a sell on any recovery to 1.1640-1.1686. Channel broken, RSI at 35-40, DXY targeting 100.00, ECB trapped by stagflation, Brent above $91 with zero visible Iran de-escalation. Target 1.1530 then 1.1468. Stop on a daily close above 1.1750.


