EUR/USD Price Forecast: Pair Pinned at 1.1604 as Dollar Rallies on Hawkish Fed and ECB Hike Bets Fade
EUR/USD trades below the 1.1795 pivot as DXY pushes to 99.28, Fed Chair Warsh leans hawkish | That's TradingNEWS
Key Points
- EUR/USD trades at 1.1604, capped below 1.1795 with the pair printing lower highs under a descending trendline.
- DXY rallied to 99.28 on sticky US CPI and Fed hike risk; ECB hike bets cut from 85bps to 65bps on weak PMIs.
- A daily close below 1.1570 opens 1.1500 and 1.1470; reclaim of 1.1795 needed to reopen the 1.2088–1.2400 path.
EUR/USD is changing hands at 1.1604 in mid-session Friday trade, May 22, 2026, down roughly 0.15% on the day and on track to close the week on the back foot for the fourth consecutive session. The pair has been quietly losing altitude under a descending trendline from the early-May rejection at 1.1795, with intraday prints walking through the 1.1600 handle during European hours before steadying just under it. The week's range carries a high near the 1.1666 retest of the falling MA cluster and a low at 1.1594, defining a tight band that hides a much more important structural picture. Place this consolidation against the broader macro tape and the read is unambiguous. The euro is being pressured on two flanks simultaneously — stagflation risk in the eurozone is forcing the rates market to walk back its ECB hike pricing from a peak of 85 basis points for the year to roughly 65 basis points today, while the Dollar Index sits at 99.28, riding an ascending two-week channel and refusing to give back its post-CPI bid. The market is pricing 2.6% probability for a Fed cut at the June meeting against 97.4% expecting the 3.50% to 3.75% band to hold, with the forward strip now incorporating the possibility of rate hikes as early as 2027. The pair is not in a range. It is in a controlled, lower-highs-lower-lows distribution that needs only a clean closing break of the 1.1570 to 1.1500 support shelf to confirm a measured move toward the 1.1350 to 1.1115 zone identified by every credible wave-count map circulating right now.
The Technical Structure Is Pointing Down and the Indicators Are No Longer Conflicted
The price action on the lower timeframes is producing the kind of structure that requires no special interpretation. EUR/USD is printing lower highs and lower lows on the 2-hour and 4-hour charts, with rejection candles forming repeatedly against the white descending trendline that has capped every rally attempt since the early-May high at 1.1795. The pair tested the red moving average near 1.1660 and was rejected with bearish wicks at distribution. The RSI sits below 48, confirming a clear absence of bullish momentum, and the MACD continues to trade in negative territory after a brief flatline earlier in the week. The volume profile is more diagnostic than the indicators themselves: the 1.1620 zone is showing as resistance with sellers in clear control of the order book, while 1.1580 to 1.1560 sits as the next layer of demand. A daily close beneath 1.1570 opens 1.1500 as the first measured target. A clean break of 1.1500 then exposes 1.1470, and a confirmed loss of that floor mechanically transitions the chart from corrective consolidation into trending breakdown, with 1.1350 as the next significant demand cluster and 1.1115 as the deeper structural objective. On the upside, the resistance lattice begins at the descending trendline near 1.1660, with 1.1700 above that and the cycle pivot at 1.1795 as the line that defines the entire trade. Nothing above the chart turns constructive until 1.1795 is closed above on a daily basis with confirming volume. Until then, every rally is being sold rather than chased, and the rejection candles tell that story without needing to consult a single indicator.
The Wave Structure Frames the Path Lower and Tells You Where the Trade Invalidates
The medium-term wave count anchors the bearish read with precision. On the weekly timeframe, an ascending wave of larger degree B is developing, with wave (A) of B forming as its component, and on the daily timeframe the third wave 3 of (A) is unfolding, with wave i complete and a corrective wave ii now developing. On the 4-hour chart, wave (c) of ii is forming with wave iii of (c) currently in motion — the most aggressive part of any corrective sequence and the leg that historically delivers the cleanest impulsive moves. If that count is correct, EUR/USD continues to decline toward the 1.1350 to 1.1115 zone before the broader uptrend resumes. The level that invalidates the entire bearish framework is 1.1795. A breakout and consolidation above it would reopen the path to 1.2088 to 1.2400, but the structural map is unambiguous about the prerequisite: nothing in the chart turns bullish until that pivot is reclaimed. Until then, every corrective bounce is a selling opportunity rather than a base for the next leg higher. The shorter-term setup is best framed by a stop above 1.1835 for short positions taken on rallies below 1.1795, with profit-taking objectives stacked at 1.1350 initially and 1.1115 as the deeper reach. The long alternative requires a sustained break above 1.1755 to 1.1795 with stops below the breakout, targets at 1.2088 first and 1.2400 in extension. The trade structure is binary at the 1.1795 pivot, and the price action this week is telling you which side of that pivot the market has chosen.
The Dollar Has Recaptured Its Mojo and the DXY Chart Is Confirming It
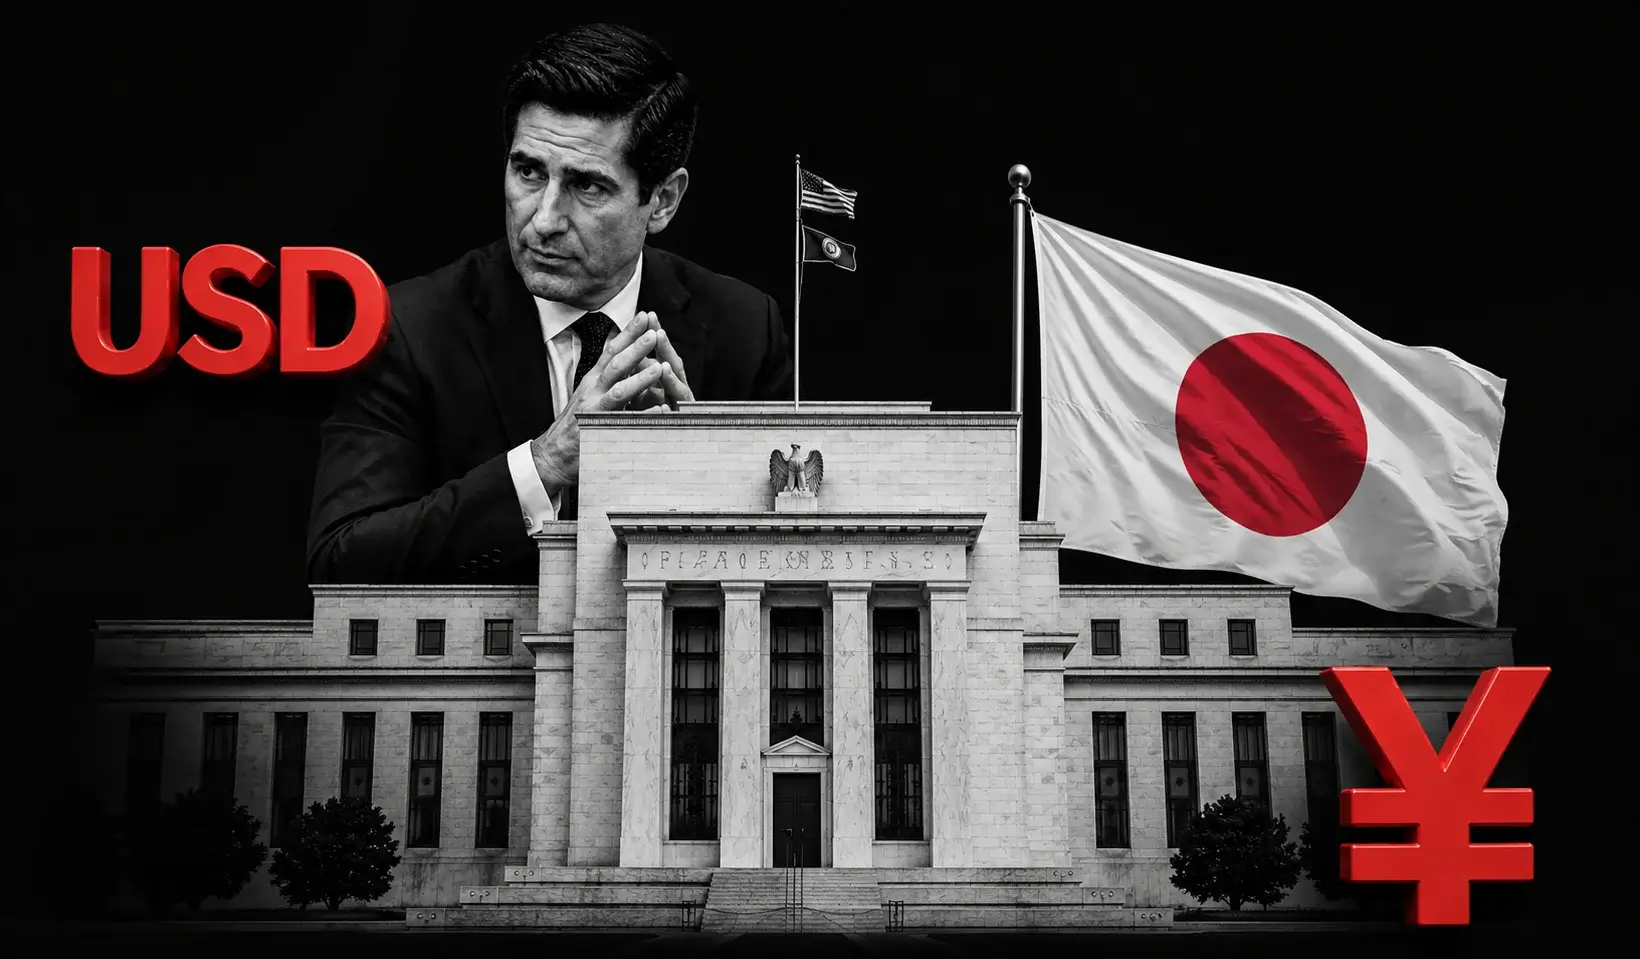
The dollar side of the cross is doing the bulk of the heavy lifting in this move, and the DXY at 99.28 is the data point that ties everything together. The dollar index is trading inside a blue ascending channel that has been forming since the mid-May lows, with green continuation candles printing on the way through the red 50 moving average near 98.90. The index is now generating higher highs and higher lows, with bullish engulfing patterns forming near 99.00 support and the RSI above 55 indicating constructive momentum without yet flashing overbought conditions. The Fibonacci extension targets above the spot price are stacked at 99.41, 99.51, and 99.73, with the volume profile confirming 98.97 as solid support and buyers dominating the order book at that level. That is the textbook structure of a trending breakout, and as long as it holds, the cross-rate gravity on EUR/USD is going to remain negative. The dollar has caught a sustained bid for three identifiable reasons that all reinforce each other: an above-consensus April CPI print that surprised the market with stickiness in both headline and core readings, particularly in shelter; an explicit hawkish lean from Fed Governor Christopher Waller this morning, calling for the central bank to "hold rates steady for the near term" and warning that the next move could be a hike rather than a cut if inflation continues to surprise to the upside; and the swearing-in of Kevin Warsh as the new Fed Chair at the White House at 11:00 a.m., the first chair to take the oath at that location since Greenspan in 1987, with the market pricing in his early tenure as decidedly non-dovish.
The Eurozone Side Is Where the Story Gets Genuinely Difficult
The euro side of the pair is being weighed down by a deteriorating fundamental backdrop that the bid in the dollar simply compounds. Germany's first-quarter GDP came in at +0.3% quarter-on-quarter, a print that reads as resilience in isolation but conceals a fragile outlook. The economy remains heavily dependent on imported energy, and the sustained run in Brent crude at $104.12 with WTI at $97.72 is feeding directly into Europe's inflation and growth profile in a way that is meaningfully more painful than the equivalent macro stress on the U.S. side. The fiscal hopes that had been building earlier in the year around defense and infrastructure spending in Berlin have started to fade, and the timely survey data is reinforcing the slowdown narrative. This week's PMI surveys pointed clearly toward weakening business activity across the eurozone, with the composite reading slipping into territory that no longer supports the recovery narrative the bulls were trying to construct in March. The stagflation cocktail of slowing growth and persistent imported inflation is precisely the regime that strips the euro of the rate-differential support it had been counting on. Markets had priced in 85 basis points of cumulative ECB tightening earlier this year on the assumption that the central bank would need to defend against the inflation pass-through from oil. That pricing has been pared back to roughly 65 basis points as the growth-versus-inflation tradeoff has tilted toward growth concerns, and the two-year real yield differential between the U.S. and the eurozone has consequently moved in the dollar's favor, which is exactly the mechanical driver of the EUR/USD downtrend.
The Iran War Is Not Resolving and the Oil Premium Is Working in the Dollar's Favor
The geopolitical tape continues to deliver headlines that cut against the euro in a way that is structural rather than transitory. The U.S.-Iran conflict that began on February 28 remains hot, the Strait of Hormuz is effectively closed, and the talks have produced no path to a clean resolution. Iran's Supreme Leader continues to insist that the country's enriched uranium stockpile must remain inside Iran, while President Trump's framing has been categorical: "We don't need it, we don't want it, we'll probably destroy it after we get it, but we're not going to let them have it." That is not a position that meets in the middle. The U.S. naval blockade continues, U.S. military officials are reportedly preparing operational briefs on potential further actions, and crude markets are pricing the standoff directly. Brent at $104.12 is up roughly 1.5% on the session, WTI at $97.72 is up 1.4%, and the U.S. national gasoline average at $4.55 per gallon is the highest Memorial Day weekend print since 2022. GasBuddy has flagged a path above $5.03 if the Strait does not reopen by midsummer. The market dynamic that emerges from this combination is the one that EUR/USD is now expressing in price: oil shock → European stagflation > U.S. stagflation → dollar bid relative to euro on rate-differential repricing. The relationship has been so consistent through May that the dollar index is now trading with elevated correlation to Brent crude — a textbook petrocurrency dynamic that is unusual for the U.S. dollar but accurate in describing the current cycle. A temporary deal that reopens part of the Strait of Hormuz for limited tanker traffic remains the most plausible interim outcome, but until even that materializes, the pressure on the euro side is structural and the rallies in EUR/USD are likely to be sold into rather than chased.
Fed Hike Pricing Has Replaced Rate-Cut Pricing as the Operative Force on the Greenback
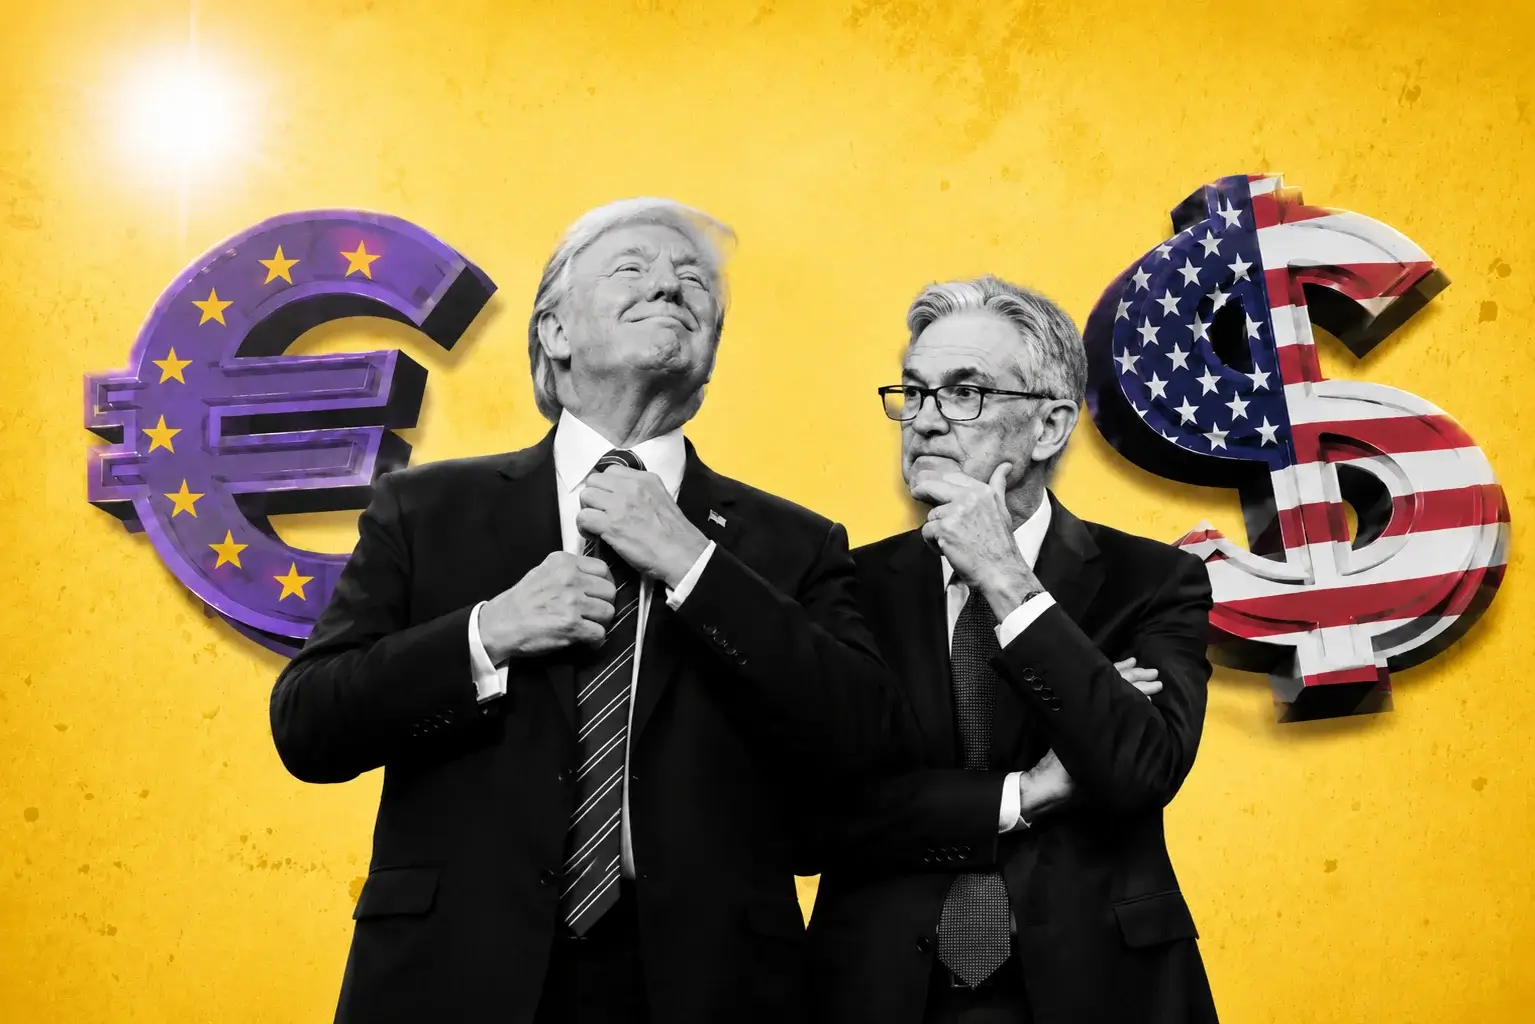
The transformation in Fed pricing over the past six weeks is the single biggest reason EUR/USD has lost the ability to hold rallies above the descending trendline. Markets entered May expecting the Fed to deliver one to two rate cuts before year-end based on the assumption that the labor market would soften enough to give the central bank cover to lean dovish. The April CPI print, with both headline and core coming in above consensus and shelter inflation showing renewed stickiness, blew up that consensus. The CME Group rates curve now prices a 2.6% probability for a cut to 3.25% to 3.50% at the June meeting and 97.4% for the current corridor to hold. The forward strip has migrated to incorporate the possibility of rate hikes as early as 2027, which is a regime-defining repricing that has not happened in this cycle before. Four FOMC policymakers have dissented at recent meetings, and Waller's commentary this morning made the hike scenario explicit rather than implicit. The simple read is that the dollar bid is no longer about safe-haven demand or oil correlation — it is about a Fed that has decisively walked away from the rate-cut bias the market had attached to it, and a market that is now positioning for the possibility of additional tightening in a U.S. economy that continues to outperform Europe on growth even as inflation runs hot in both jurisdictions. EUR/USD cannot rally sustainably while that pricing remains in place. The pair would need either a clean reversal in U.S. inflation data, a credible dovish pivot from the Warsh-led FOMC, or a sharp acceleration in eurozone growth that re-establishes the ECB tightening narrative, and none of those three vectors is visible on the current calendar.
The Consumer Backdrop on Both Sides of the Atlantic Is Telling You Where the Pressure Sits
A meaningful piece of the euro weakness story sits in the consumer data, and the cross-Atlantic comparison cuts cleanly against the euro. The University of Michigan's final May consumer sentiment print landed at 44.8, an all-time low and below the previous trough recorded in June 2022. That sounds catastrophic for the U.S. side until you place it against the equivalent confidence measures in the eurozone, where the same energy shock has produced sentiment declines that are more severe in their second-derivative impact on actual consumption. The U.S. consumer is unhappy with prices but continues to spend on services and discretionary categories. The European consumer is pulling back more sharply because the energy pass-through is harsher and the broader macro picture lacks the AI-capex and equity-wealth tailwinds that are propping up U.S. consumption. The S&P 500 is on track for its eighth straight weekly gain, the longest streak since late 2023, with the Dow Jones Industrial Average printing an intraday record high of 50,686. That wealth effect channel is operative in the U.S. and absent in Europe, which is the asymmetry the rates market is now pricing into the dollar. The VIX at 16.59 is compressed, signaling no imminent risk-off panic that might generate safe-haven euro flows, and the cross-asset picture continues to favor the dollar at the expense of the European currencies.
The Yield Differential Is Doing the Mechanical Work That the Price Chart Is Visualizing
Layered underneath the technical setup, the rates picture is the engine room of the move. The U.S. 10-year Treasury yield sits at 4.584%, off Tuesday's intraday peak of 4.69% but still elevated. The 30-year yield is at 5.088%, just below a level earlier this week that marked the highest reading since before the 2008 financial crisis. The 2-year yield sits at 4.14%, off a one-year high of 4.122% that printed on the front end. The equivalent German 10-year Bund yield is meaningfully lower and has been compressed by the deterioration in eurozone growth expectations, widening the U.S.-Germany rate gap to a multi-week high. The two-year real yield differential between EUR/USD has expanded in the dollar's favor over the past three weeks, which is the cleanest fundamental driver of the pair's directional bias. As long as the U.S. curve trades with hike-risk premium embedded and the German curve trades with growth-concern compression, the differential cannot rotate back in the euro's favor without either a U.S. shock or a positive eurozone surprise that resets growth expectations. Neither is on the immediate calendar. The pair is bearish for mechanical reasons before any geopolitical or sentiment factor is layered on top.
Rallies Are Being Sold and Dips Are Being Held — That Is the Tell
The intraday tape is the corroborating evidence that the structural read is correct. Every attempt to push EUR/USD above the descending trendline this week has been met with rejection candles within hours, often within the same session. The bounce off 1.1594 earlier in the week extended to 1.1666 before the offer reappeared and dragged the pair back to 1.1604. That is the textbook signature of a market in controlled distribution rather than accumulation, and it tells you that the larger discretionary books are using strength to add short exposure rather than treating it as a base for a longer-term reversal. The pattern of bearish wicks at the upper boundary of each session's range, combined with the absence of any meaningful follow-through on the bid side, suggests that the dealer community is also leaning short into the long weekend rather than positioning for upside. That positioning bias is itself a force that perpetuates the bearish structure. A genuine reversal would require either a fresh dovish catalyst from the Fed, a sudden de-escalation in Iran that reopens Hormuz, or a positive eurozone growth surprise that rebuilds the ECB-tightening narrative. Absent any of those, the path of least resistance remains lower, and the 1.1570 floor is now the line that decides whether the next leg targets 1.1500 or extends directly to 1.1470 without pausing.
Bund Yields and ECB Repricing Are Not Helping the Euro Anymore
The ECB rate path has been one of the more dramatic repricings in the G10 complex this year. Investors entered 2026 expecting the European Central Bank to hike aggressively in response to the imported inflation surge from the Middle East, with 85 basis points of cumulative tightening priced into the strip at the peak of expectations. The collapse in eurozone PMIs through May has pulled that pricing back to 65 basis points, a meaningful step down that has compressed the rate-differential support for the euro at exactly the moment the dollar side has been firming on its own hike-risk narrative. The fiscal package that had been the basis for the German growth recovery — defense and infrastructure spending — has lost credibility in the rates market as a sufficient offset to the energy shock, and the secondary effects on German manufacturing competitiveness in a high-oil regime are starting to bleed into the data. Christine Lagarde's most recent communications have been notably less hawkish than the rhetoric of March and April, which has reinforced the rates market's view that the ECB will tolerate a slower hiking pace if growth conditions continue to deteriorate. The euro is consequently caught between a Fed that is talking hikes harder than the market priced six weeks ago and an ECB that is hiking less aggressively than the market priced eight weeks ago. That kind of double-sided rate-differential compression is exactly the regime that produces sustained downtrends in EUR/USD rather than range-bound consolidation.
Read More
-
VOO ETF Rebounds to $689.80 Toward Its $699 Record as AI Chips Overpower the Iran Shock
09.07.2026 · TradingNEWS ArchiveStocks
-
XRP ETFs Lock Away 970M Tokens With $1.5B of Inflows While the Price Sleeps at $1.09 — The Coiled Spring
09.07.2026 · TradingNEWS ArchiveCrypto
-
Oil Fades to $72.65 WTI Even as the US Strikes Iran a Second Night — The Glut Answers the War Premium
09.07.2026 · TradingNEWS ArchiveCommodities
-
The Yen Sinks to a 40-Year Low Near 162.5 as the Iran Oil Shock Compounds the Widest Rate Gap in Years
09.07.2026 · TradingNEWS ArchiveForex
What Invalidates the Bearish Case and What Invalidates the Bullish Case
The risk parameters need to be drawn precisely because the consolidation will eventually resolve and the boundaries are visible on the chart. The bearish thesis breaks on a daily close above 1.1795, which would reclaim the descending trendline, force the structural shorts that have been added on every bounce to cover, and reopen the path to 1.2088 as the first measured target and 1.2400 in extension. The thesis also breaks if Brent crude falls below $90 on a clean Hormuz reopening, which would deflate the European stagflation pressure that has been the primary fundamental driver of the move; if Fed Chair Warsh surprises dovish at the June meeting with a framing that emphasizes growth risk over inflation risk; if eurozone PMIs deliver a positive surprise that re-establishes the ECB hiking narrative; or if the U.S. CPI print for May comes in materially below consensus and forces the rates market to walk back the 2027 hike pricing. The bullish thesis breaks on a daily close beneath 1.1570 with confirming volume, which mechanically opens 1.1500 and then 1.1470 as the next targets and exposes the broader 1.1350 to 1.1115 zone as the structural objective. The thesis also breaks if Brent crude pushes through $115 on a Hormuz escalation rather than a reopening, if eurozone PMIs decelerate further into recessionary territory, if the Fed delivers an actual hike rather than merely signaling one, or if a fresh European political crisis — France, Germany, or the European Parliament — reintroduces euro-specific risk premium of the sort that compressed the cross during the 2023 banking-sector stress.
The Decision: Bearish — Sell Rallies Below 1.1795, Target 1.1500 to 1.1470 Initially With 1.1350 to 1.1115 as the Extension
The honest read on EUR/USD here is that the pair is bearish, not a hold and not a buy on dip inside this range. The structural read on the chart aligns with the macro tape with unusual cleanliness. Price is making lower highs and lower lows under a descending trendline that has held since the early-May rejection at 1.1795. The RSI below 48 and MACD in negative territory corroborate the absence of upside momentum. The DXY at 99.28 is trading inside its own ascending channel with bullish engulfing structure and confirming volume, and the dollar bid is being delivered by Fed hike pricing rather than safe-haven demand, which is the more durable form of dollar strength. Above-consensus U.S. CPI, hawkish Waller commentary, the swearing-in of Kevin Warsh as Fed Chair, the 97.4% probability of a June hold against 2.6% for a cut, and the migration of the forward strip to price 2027 hikes are all pulling in the same direction. On the European side, eurozone PMIs are deteriorating, German fiscal optimism is fading, ECB hike expectations have been pared from 85 to 65 basis points, energy import dependence is exposing the bloc to the $104 Brent regime, and the two-year real yield differential is widening in the dollar's favor. Layered on top of that, the Iran conflict is not resolving, oil is sticky, and the seasonal positioning into the U.S. and U.K. long weekend favors de-risking that historically translates into euro selling against the dollar. The tactical position is to sell rallies into the 1.1660 to 1.1700 zone with stops above 1.1795 and initial targets at 1.1500 to 1.1470, with the willingness to add on a confirmed break of that floor and ride the move toward 1.1350 and then 1.1115 as the deeper structural objective. The bearish case stays intact for as long as 1.1795 caps every bounce. The first sign that the structure is shifting will be a daily close above the descending trendline near 1.1660 combined with DXY losing 98.90 on the downside — until then, the path of least resistance remains lower, the dollar holds the upper hand, and the euro is the funding currency on virtually every cross-asset relative-value book that has been getting paid through May. That is the trade as the calendar walks into the long weekend with EUR/USD pinned at 1.1604, the trendline holding, the rates market leaning hawkish, and every macro variable still tilted in the dollar's favor.