





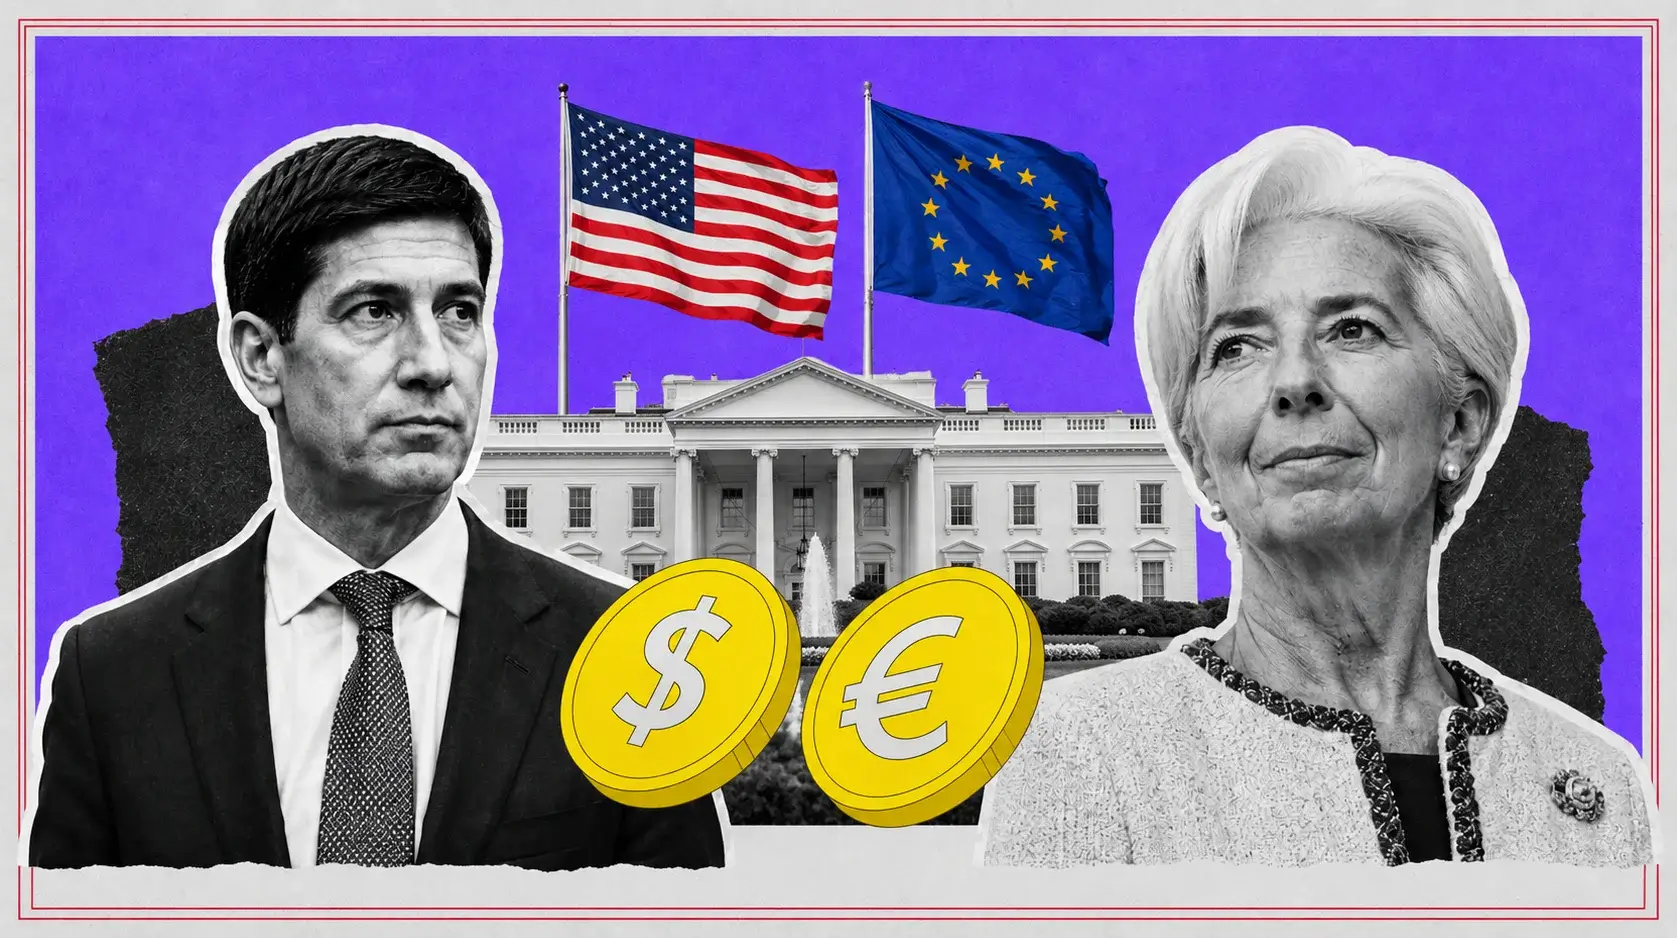
EUR/USD Stalls at 1.1522 as Two Soft US Inflation Prints Fail to Break 1.1550
Eurozone inflation rose to 2.9% in July while US core fell to 2.5%, and the euro gained nothing from the divergence | That's TradingNEWS
Key Points
- EUR/USD trades at 1.1522, 4.1% below the 2026 high of 1.2023 and 1.6% above the June low of 1.1354.
- July US PPI was unchanged at 0.0% versus 0.2% expected, yet the euro failed to hold its 1.1563 high.
- Eurozone July HICP rose to 2.9% with energy at 10.0%, and markets price a near-full ECB hike in September.
EUR/USD reached a two-day high of 1.1563 on Wednesday following the July Consumer Price Index release, then reversed to close at 1.1522, down 0.17%. Thursday brought a flat European session with the pair holding modestly above 1.1500 and quotes ranging between 1.1500 and 1.1550 into the 8:30 a.m. Eastern producer price release. Tuesday's session closed at 1.15403, down 0.03%, after clearing the 1.1516 to 1.1535 resistance band.
That reversal is the single most important price action of the week. U.S. headline inflation eased to 3.4% from 3.5% and core CPI cooled to 2.5% — the slowest annual core print since March 2021 — and the euro could not hold a 1.1563 high. September Fed hold odds jumped to 60% from 40% on the release. The dollar should have been sold. Instead the dollar index rebounded to the 100.00 area and traded near a two-week high.
The pair sits 4.1% below its 2026 high of 1.2023 and 1.6% above its twelve-month low of 1.1354 recorded on June 24. That places EUR/USD in the lower third of the range that has contained it since March, with a 0.08% gain over seven days and 1.20% over thirty.
The recovery from 1.1354 has covered roughly 165 pips in seven weeks, which is not a trend. It is a correction inside a medium-term downtrend, and the driver has been dollar weakness following the July employment report rather than any repricing of the euro itself. That distinction governs everything that follows: the euro leg has contributed almost nothing to the move despite a run of better-than-expected eurozone data and an ECB approaching a second rate hike.
The dollar index sits at 99.87 to 100.03, down 0.14% on the session, having weakened 1.04% over the past month while remaining 1.65% higher over twelve months. It has now spent nine consecutive sessions inside a 99.50 to 100.00 band. The euro comprises 57.6% of that basket, which means EUR/USD and DXY are close to the same trade expressed twice.
Safe-haven demand tied to the Iran conflict and its economic consequences supported the dollar through Wednesday despite the softer inflation print — the clearest signal available that the geopolitical bid is currently overriding the rate channel.
PPI at 0.0% Cut the Dollar's Yield Case and the Euro Still Could Not Clear 1.1550
The July Producer Price Index for final demand was unchanged at 0.0% in the Bureau of Labor Statistics release, against a 0.2% consensus. The annual rate fell to 4.7% from 5.5%, below the 4.9% expected, with June revised to a 0.1% decline from the 0.3% drop originally reported.
The composition matters enormously for FX because several PPI components feed directly into core PCE, the Federal Reserve's preferred gauge, due later this month. Final demand goods fell 0.7% on a 3.1% drop in energy, with gasoline down 5.7% and crude petroleum at the unprocessed stage collapsing 11.9%. Final demand foods fell 0.9%.
But final demand less foods, energy and trade services accelerated to 0.4% from 0.1% in June — a four-fold jump — and holds a 4.7% annual rate. Services less trade, transportation and warehousing rose 0.6%. Portfolio management prices advanced 6.5%. Stage 4 intermediate demand rose 0.6% and sits 6.7% above year-ago levels. That is the series most directly relevant to the September FOMC, and it moved in the hawkish direction.
For EUR/USD the setup coming into the print was mechanical. A hotter reading was bullish DXY and bearish the euro. A softer reading was expected to weaken the dollar and support the majors. A mixed print risked a false breakout around 100.00 on the index. What arrived was the mixed case in its purest form: a headline that clears the way for a Fed pause and a core that keeps the hiking debate alive into September 16.
The euro's inability to convert two consecutive soft U.S. inflation prints into a break above 1.1550 is the tell. Markets remain reluctant to unwind Fed hawkishness aggressively while the U.S.–Iran stalemate drags on, and higher oil prices would ordinarily favor the dollar outright. That channel has been partially offset by softer U.S. labor and inflation data trimming Fed expectations and pressuring yields — but only partially.
The immediate decision zone on the dollar index runs 100.00 to 100.10. A confirmed close above 100.10 targets 100.40 and then 100.70, particularly if producer inflation or jobless claims support higher yields. A sustained break below 99.70 exposes 99.40 and would give EUR/USD the room it has been unable to find on its own.
The Dollar Index Has Spent Nine Sessions Inside 99.50–100.00
The dollar index trades at 100.03 with a nine-session compression range between 99.50 and 100.00 defining the entire structure. First resistance above sits at 100.06, with the rising trendline at 99.42 forming the structural floor beneath. Price has climbed above the 100-day exponential moving average at 99.91, while the 50-day EMA at 100.29 continues to cap advances.
Relative strength on the index reads near 44 — recovering from weaker territory but still below the 50 midline. That combination, price above the slower average and below the faster one with momentum unconfirmed, describes a market that has stopped falling without beginning to rise.
The nine-session range is unusually tight for a currency basket carrying this much event risk. Within that window the market has absorbed a payrolls contraction of 23,000, a CPI print easing to 3.4%, a PPI print at 0.0%, an unresolved Strait of Hormuz, and a Federal Reserve openly split three ways. None of it produced a break. Vendors disagree on whether Wednesday's close was 100.01 or 99.98 — either side of the range ceiling — which means no break can be claimed in either direction.
The compression reflects two offsetting forces of nearly identical magnitude. On the bearish side, the labor market is deteriorating with July payrolls negative and continuing claims rising 24,000 to 1,801,000, while headline inflation has cooled for two consecutive months and September hold odds have moved to 60%. On the bullish side, the ten-year yields 4.67% to 4.69%, the thirty-year sits above 5%, October hike odds exceed 53%, December sits at 73%, and safe-haven demand from the Middle East conflict persists.
The historical context adds weight to the current level. The dollar index entered 2026 under pressure near long-term support after a 2025 decline that took it toward 17-year channel support near 96, driven by expectations for aggressive Fed easing. Those expectations inverted completely when the Hormuz blockade drove energy prices higher and forced the Fed into a hiking debate. The index rallied more than 3.9% off February lows and reached a 13-month high in June before settling into the current band.
For EUR/USD, the practical read is that the pair cannot trend until the index resolves 99.42 or 100.29.
Two Central Banks Hiking at Once: 3.50–3.75% Against 2.25%
The defining feature of this cycle is that the rate-divergence trade has stopped working, because both central banks are tightening simultaneously.
The federal funds target range sits at 3.50% to 3.75% after five consecutive holds, most recently at the July 28–29 FOMC meeting, which passed 9–3 with three members dissenting in favor of a hike — the first three-way, same-direction dissent since September 2016.
The European Central Bank raised all three key rates by 25 basis points on June 11, effective June 17, taking the deposit facility to 2.25%, the main refinancing rate to 2.40% and the marginal lending facility to 2.65%. That was the ECB's first increase since 2023, delivered explicitly because the Middle East war was generating inflation pressures. The Governing Council statement noted the decision was robust across a range of scenarios mapping how the energy shock might evolve. The July 23 meeting delivered a hold at all three rates.
The nominal differential is roughly 137 basis points using the midpoint of the Fed's range against the ECB deposit rate. That gap has narrowed from where it stood before June, and it narrows further if the ECB hikes in September while the Fed holds. The bear case for EUR/USD explicitly requires the dollar to re-establish a yield advantage above 150 basis points, which needs the Fed to hike while the ECB stands still.
June staff projections underpinning the ECB's tightening are stark. Headline inflation is expected to average 3.0% in 2026, 2.3% in 2027 and 2.0% in 2028. Excluding energy and food, the baseline shows 2.5% in both 2026 and 2027 and 2.2% in 2028. GDP growth was cut to 0.8% for 2026, reflecting the war's impact on energy costs, supply chains and household confidence.
That is the textbook stagflation dilemma, and it is worse in Europe than in the United States. The eurozone imports its energy. The tools required to fight the resulting inflation are the same tools that further suppress 0.8% growth. President Lagarde has characterized the June move as a response to a genuine inflation problem rather than an insurance hike, declined to offer forward guidance, and indicated the 2% target returns only by late 2027 and only if policy becomes more restrictive.
Eurozone Inflation Is Rising While US Inflation Falls — and the Euro Has Not Benefited
The inflation trajectories in the two blocs have fully diverged, and the direction of that divergence should be euro-positive. It has not been.
Eurostat's flash estimate put euro area annual inflation at 2.9% in July, up from 2.8% in June and in line with expectations. Core inflation excluding energy, food, alcohol and tobacco rose to 2.5% from 2.4%. Energy carried the highest annual rate at 10.0%, accelerating from 8.5% in June, as hostilities between the U.S. and Iran resumed. Services inflation rose to 3.3% from 3.2%. Non-energy industrial goods ticked up to 0.9% from 0.7%. Food, alcohol and tobacco eased to 1.2% from 1.5%. The monthly rate was 0.2%.
The path through 2026 has been relentlessly upward: 1.7% in January, 1.9% in February, 2.6% in March, 3.0% in April, 3.2% in May, 2.8% in June, and 2.9% in July. Market-based inflation expectations measured through one-year euro area swaps sit near 2.4%, above the ECB's target.
Compare that to the United States, where headline CPI has fallen from 3.5% to 3.4% and core has fallen from 2.6% to 2.5%. Producer prices went to 0.0% monthly and 4.7% annually from 5.5%. Euro area industrial producer prices fell 0.3% in June and rose 4.6% year over year, down from 5.9%.
Rising eurozone core inflation against falling U.S. core inflation is textbook euro-positive divergence. The pair has responded by rejecting 1.1563 and returning below 1.1550.
The explanation sits in the quality of the inflation rather than the level. Eurozone inflation at 2.9% is being driven by 10.0% energy, which is a terms-of-trade shock for a net energy importer. Higher import prices for a bloc growing at 0.8% is a tax on real income, not a signal of demand strength. The ECB must respond to it because the mandate requires it, but tightening into an energy-driven cost shock with negative growth momentum is not a currency-positive combination — it is a policy error the market is pricing as likely.
U.S. inflation, by contrast, is falling because domestic energy is deflating while the underlying core services complex accelerates. That is a stronger economy with a supply-side windfall.
Q2 GDP at 0.4% Was the Strongest Since Early 2025 and Bought the Euro Nothing
The eurozone growth picture has genuinely improved, which makes the euro's failure to respond more informative.
Seasonally adjusted GDP increased 0.4% quarter over quarter in the euro area in the second quarter of 2026 and 0.5% across the EU, according to Eurostat's preliminary flash estimate — the strongest pace since early 2025. That follows a 0.2% contraction in the first quarter, against expectations for 0.1% growth. Second estimates released this week are expected to confirm the figure.
Unemployment held at 6.3% in June, stable against both May and June 2025, with the EU rate at 6.0%. The general government deficit ratio improved slightly to 3.1% of GDP in the first quarter from 3.2% in the fourth quarter of 2025, though gross debt rose to 88.9% of GDP from 87.7%.
Recent economic resilience has prompted analysts to become more optimistic about growth, with the near-term path projected to moderate before gradually gaining momentum. Business confidence has improved. Manufacturing activity has stabilized.
Against that, the high-frequency data has been weak. German retail sales fell 0.2% in June after a 2.1% advance, and the eurozone figure came in at minus 0.3% after a 0.4% gain in May. Household real income per capita was flat in the first quarter after rising 0.2% in the fourth quarter of 2025.
A run of better-than-expected eurozone data has failed to lift the euro. That failure is the central diagnostic of the current market. When a currency stops responding to positive domestic data, the driver has moved entirely to the other leg of the pair — and the other leg is a dollar that will not weaken while the Fed keeps a hike on the table and the Strait of Hormuz remains contested.
There is only so much the euro leg can accomplish in pushing the pair convincingly toward 1.16. That constraint has held for six weeks and shows no sign of loosening before September.
The September Split: 60% Fed Hold Against a Near-Full ECB Hike
The September policy calendar is where this pair resolves, and the two meetings currently point in opposite directions.
Fed pricing shifted materially on Wednesday's CPI. Hold odds for the September 16 meeting jumped to 60% from 40% before the release, with vendor estimates for a hike ranging from roughly one-third to 40%. October odds exceed 53%. December sits at 73%. Consensus economist forecasts still show no hike this year and half a point of cuts in 2027, which means positioning and forecasting have decoupled entirely. July FOMC minutes publish August 19 and will show whether the three dissents had unrecorded support.
ECB pricing has moved the other way. Market pricing for next month's Governing Council meeting is approaching a full 25 basis point hike. That expectation firmed when oil re-accelerated following renewed U.S.–Iran strikes, outweighing the more dovish tone ECB officials struck at the early-July Sintra forum. Lagarde has warned that surging oil prices could shape the September decision.
If both outcomes land — Fed holds, ECB hikes — the differential compresses from roughly 137 basis points to roughly 112. That is the single cleanest bullish catalyst available for EUR/USD, and it is the scenario that would take the pair toward 1.1639 and then 1.1680.
The risk is that the pair has already priced it. EUR/USD at 1.1522 with a near-full ECB hike discounted and Fed hold odds at 60% means the bullish case is largely in the price. The asymmetry runs the other way: a September Fed hike, at roughly 40% probability, is not priced at all, and neither is an ECB hold if euro area energy inflation rolls over on falling crude.
The second scenario deserves more attention than it receives. Brent has shed 2% to $87.04 and WTI 2% to $81.32, with OPEC lowering its 2026 demand growth forecast and the International Energy Agency projecting demand falling 1.6 million barrels per day this year. Euro area energy inflation at 10.0% is entirely a function of those prices. Sustained crude weakness through August would take the August HICP flash sharply lower and remove the ECB's justification for hiking in September — collapsing the bullish euro case from the inside.
Read More
-
Yen Stalls at 160 Despite a 3% JGB and Tokyo Core CPI at 2.0% — Intervention Sits at 164, Friday's Payrolls Decide
02.09.2026 · TradingNEWS ArchiveEnergy
-
QQQ ETF ($706.22) Slides 7.4% Below Its High as the Market Reprices the AI Capex Bill — $686.57 Target if $700 Breaks
22.10.2026 · TradingNEWS ArchiveStocks
-
XRPI ($7.00) and XRPR ($10.74) Slide Toward 52-Week Lows as Spot XRP ETF Flows Stall at $708,510
22.10.2026 · TradingNEWS ArchiveCrypto
-
NG ($2.775) Decoupled From Europe’s €88 Gas Crisis as LNG Feedgas Hits 18.9 Bcf/d — $3.30 Upside on Cold Weather
22.10.2026 · TradingNEWS ArchiveCommodities
-
Dollar-Yen (157.35) Loses 157.65 as the Yen Rallies on Haven Demand — 155 Target if 156 Breaks
22.10.2026 · TradingNEWS ArchiveForex
Energy Is the Transmission Channel: Brent at $87, Hormuz Unresolved
Every variable in this pair traces back to a single input, and that input is the price of oil.
The mechanism is asymmetric because the two economies sit on opposite sides of the energy trade. The United States is a net exporter with domestic production; higher crude lifts headline inflation but also lifts national income and the terms of trade. The euro area imports nearly all of it; higher crude lifts inflation while directly subtracting from real income and growth. The same oil price is stagflationary for one bloc and inflationary-but-neutral for the other.
That is why euro area energy inflation printed 10.0% in July while U.S. CPI energy fell 1.5% and PPI energy dropped 3.1% in the same month. The divergence is not measurement noise — it reflects lagged European contract pass-through against immediate U.S. spot pass-through, and it means the ECB is responding to an inflation impulse the Fed has already seen peak.
The geopolitical state remains unresolved in a way that keeps two-way risk elevated. Talks on reopening the Strait of Hormuz have produced no clear breakthrough. Iran's foreign minister has indicated an agreement with Oman on a shipping route is close while cautioning it would not immediately restore flows. The U.S. administration maintains it retains total control, a claim private shipping data disputes. Attacks on vessels in the Red Sea and Gulf of Oman have continued.
For EUR/USD the two resolutions produce opposite trades. A negotiated reopening collapses crude, removes the safe-haven dollar bid, accelerates euro area disinflation, and reduces the ECB's September hiking justification — net effect ambiguous, with the dollar-negative channel likely dominating in the short run. An escalation spikes crude, reinforces the safe-haven bid, pushes euro area energy inflation above 10.0%, and hits eurozone growth directly — unambiguously euro-negative.
That asymmetry is the reason the pair cannot break 1.1550 despite two soft U.S. inflation prints and a near-full ECB hike priced. The tail risk on the euro side is materially larger than the tail risk on the dollar side, and options positioning reflects it.
Technical Structure: 1.1510 Channel Top, 1.1466 Moving Averages, 1.1639 Ceiling
The daily chart carries a mildly bullish bias with price grinding above a broken downtrend line at 1.1514 and the top of a descending parallel channel at 1.1510. The simple moving average cluster sits around 1.1466 below price, indicating underlying demand. Relative strength at 56 reads constructive without being overextended following the recovery off the lower channel boundary at 1.1336.
Initial support sits in the 1.1514 to 1.1510 area where the reclaimed trendline and channel top converge — the first genuine test of whether the July breakout is structural. Below that, 1.1496 to 1.1488 marks the immediate intraday support zone, followed by the moving average cluster at 1.1466 and the July breakout zone at 1.1469 to 1.1483.
The critical level is 1.1355 to 1.1365, defined by the 38.2% retracement of the 2025 advance and the April high-week close, with the median line of the broader 2022 uptrend converging at the same threshold. A weekly close below that region would be required to fuel the next major leg of the downtrend that began in January. Subsequent support rests at the 2026 high close of 1.1228 and then 1.1110 to 1.1164.
On the upside, a recovery above 1.1550 targets 1.1600. Beyond that, the first target zone runs 1.1576 to 1.1601, with the more significant band at 1.1639 to 1.1649 defined by the 61.8% retracement of the April decline and the 52-week moving average. Strength beyond that slope would indicate a more significant low was registered in June. Further resistance sits at 1.1660 to 1.1668, with 1.1680 as the level that would confirm a genuine reversal rather than a correction.
The intraday structure suggests short-term downside pressure toward 1.1496 to 1.1488 before any renewed attempt higher, with first target at 1.1535 and second near 1.1580 on a bounce from that support.
The honest read: the move above 1.1516 matters technically and means less fundamentally than the chart suggests. It was a correction inside a medium-term downtrend, not a reversal of it, and it was driven by dollar weakness following the employment report rather than euro strength.
The 1.1355 Line: 38.2% Retracement and the Entire Bear Case
Everything bearish about EUR/USD converges on one number, and it sits 165 pips below spot.
The 1.1355 to 1.1365 zone marks the 38.2% Fibonacci retracement of the 2025 advance, the April high-week close, and the median line of the 2022 uptrend channel. The twelve-month low of 1.1354 printed there on June 24. The lower boundary of the current descending channel sits at 1.1336. A separate reading places the critical support at 1.1400, identified as the 23.6% retracement of the 2022 to 2026 rally.
That confluence has held once. Whether it holds again determines whether the January downtrend resumes or whether June marked a durable low.
The bear scenario has a clear specification and roughly 25% probability. The Iran ceasefire collapses fully, oil re-spikes above $100, and the Fed delivers one or two actual hikes before year-end that the ECB cannot match given 0.8% growth. EUR/USD breaks 1.1400, then 1.1355, and extends toward 1.10 or lower as the dollar re-establishes a yield advantage above 150 basis points. December projections in that scenario cluster between 1.0998 and 1.1446 with an average near 1.1222.
The base case carries roughly 50% probability: both central banks hold or move in small increments and the pair oscillates between 1.13 and 1.21 with no sustained trend absent a clear inflation surprise in either jurisdiction.
The bull case, also near 25%, requires U.S. inflation to cool faster than expected, taking the projected Fed hike off the table while the ECB delivers a second 25 basis point hike in September. Renewed divergence — ECB tightening, Fed on hold — is the configuration that sends the pair toward 1.22 to 1.25.
Consensus projections have drifted lower. Quarterly consensus paths point to 1.1493 in late 2026, 1.1715 in early 2027 and 1.1843 in late 2027. Statistical models put December 2026 near 1.1411 with a 1.0998 to 1.1446 band. The range-bound view of 1.13 to 1.21 for the remainder of 2026 currently captures near-term reality better than the 1.22 to 1.25 consensus targets that were set before both central banks began tightening simultaneously.
Positioning and Cross-Market: RSI at 56 Against RSI at 44 on the Dollar
The momentum readings on the two sides of the same trade describe a market with no conviction anywhere.
EUR/USD relative strength sits near 56 — constructive, above the midline, not overextended. The dollar index reads near 44 — recovering, below the midline, unconfirmed. Both indicators are in the neutral band. Neither offers a mean-reversion edge. A pair where both legs read neutral simultaneously is a pair waiting for an external catalyst rather than one building an internal move.
The absence of extreme positioning is itself the story. After the pair fell from 1.2023 to 1.1354 across the first half of 2026, speculative shorts were rewarded and then largely covered into the June low. The recovery to 1.1563 has occurred without rebuilding meaningful long exposure, which is why each advance stalls quickly and each decline finds buyers.
The consequence cuts both ways. There is no crowded long to liquidate, which limits downside acceleration. There is no crowded short to squeeze, which limits upside acceleration. The result is the compression visible on both the pair and the index: nine sessions inside 50 pips on DXY, and a 210-pip band on EUR/USD stretching back to July.
Cross-market correlations have shifted in ways that reduce the dollar's traditional support. Gold closed Wednesday at $4,424.44, up 1.24%, at a ten-week high, and silver reached $67.06. Precious metals rallying while the dollar index holds near 100 is unusual and signals that the safe-haven bid is being expressed in metals rather than currency. Equities are at records with the S&P 500 at 7,748.50, which removes the risk-off dollar bid entirely.
German ten-year yields have been swinging around 3.1% against the U.S. ten-year at 4.67% to 4.69%, leaving a spread near 157 basis points. The two-year U.S. yield at 4.18% against the ECB's 2.25% deposit rate frames the short-end differential that drives spot. Neither spread has compressed enough to justify a sustained euro advance.
What the Crosses Say: Sterling at 1.3550, USD/JPY at 159.35, Japan PPI at 7.2%
The G10 complex offers a cleaner read on dollar direction than EUR/USD itself, because the euro cross carries idiosyncratic ECB risk the others do not.
Sterling has been the strongest major this week on genuinely good domestic data. UK monthly GDP for June unexpectedly grew 0.3% against a forecast for a 0.1% contraction, while second-quarter GDP held at 0.4% quarter over quarter and 1.2% annually. GBP/USD faces immediate resistance at 1.3550 with first support at 1.3450. Sterling outperforming the euro on the same dollar backdrop confirms the euro's underperformance is euro-specific rather than a broad dollar story.
USD/JPY sits near 159.35 with a two-way risk profile that has become the market's most crowded uncertainty. Japanese July producer price inflation slowed to 7.2% year over year against 7.4% expected and 7.3% previously, with the monthly rate at just 0.1% against a 0.6% consensus. Wholesale inflation running above 7% strengthens the case for a Bank of Japan increase even as it decelerates, and intervention risk remains live. The 159.50 to 160.00 zone is where chasing becomes dangerous, with 160.56 marking overlap resistance that aligns with the 61.8% Fibonacci retracement.
The yen matters for EUR/USD indirectly. A BOJ hike or intervention episode that drives USD/JPY sharply lower would pressure the dollar index broadly, and given the euro's 57.6% weight, that mechanically lifts EUR/USD without requiring any euro-specific catalyst. It is the most plausible path to 1.1600 that does not depend on the September ECB meeting.
The composite read across crosses: sterling firm on data, yen volatile on policy expectations, euro pinned by energy exposure and growth. That ranking has held for six weeks and identifies the euro as the weakest expression of any dollar-negative view.
Currency-basket mechanics matter for interpretation. Much of what appears to be a EUR/USD move is a dollar move, which is why the index resolves first and the pair follows.
Scenarios and Targets: 1.1336 Floor, 1.1600 Base, 1.1680 on a Break
The base case, carrying the highest probability, is continued range trade between 1.1466 and 1.1600 into the September central bank meetings. This requires the dollar index to hold its 99.50 to 100.00 band, oil to stay in the $80s, and neither central bank to surprise before mid-September. Under those conditions EUR/USD holds the 1.1510 channel top, tests 1.1550 repeatedly, and reaches 1.1576 to 1.1601 on any dollar-negative headline. Target: 1.1600.
The bullish case requires the September split to materialize — Fed holds on September 16, ECB delivers 25 basis points — compressing the differential from 137 basis points to 112. A DXY break below 99.70 and then 99.42 is the confirming signal. That opens 1.1639 to 1.1649 at the 61.8% retracement and 52-week moving average, then 1.1680. A weekly close above 1.1649 would suggest June's 1.1354 marked a significant low and open the path toward 1.18 to 1.19 over the medium term. Target: 1.1680.
The bearish case begins with a loss of 1.1510 and 1.1488. That exposes the moving average cluster at 1.1466 and the July breakout zone at 1.1469 to 1.1483. Below those, 1.1400 and then the 1.1355 to 1.1365 confluence come into play. A weekly close beneath 1.1355 targets 1.1228 and then 1.1110 to 1.1164. Triggers: a September Fed hike at roughly 40% probability, an ECB hold on collapsing energy inflation, or a Hormuz escalation. Target: 1.1355, with 1.1228 as the extension objective.
The wildcard sits on the euro side and is underappreciated. Euro area inflation at 2.9% is being carried by 10.0% energy. Brent at $87.04 and falling, with OPEC and the IEA both cutting demand forecasts, means the August HICP flash released at the end of this month could print materially below 2.9%. An ECB that skips September because energy inflation rolled over would remove the only clean bullish catalyst the euro has, with the pair sitting at 1.1522 having already priced the hike.
Longer-dated modeling puts the 2026 range at 1.12 to 1.17 with an average near 1.15, and the December band at 1.0998 to 1.1446. The 200-day moving average is projected near 1.16 by mid-September with the 50-day near 1.15.
Verdict: A Pair Priced for a Split That May Not Arrive, With the Risk Below the Market
EUR/USD at 1.1522 has recovered 1.6% from the June low of 1.1354 and sits 4.1% below the 2026 high of 1.2023. Those two numbers frame a pair that stopped falling in late June and has not started rising since.
The most informative event of the week was not the price. It was the non-reaction. U.S. headline CPI eased to 3.4%, core cooled to 2.5% — the slowest since March 2021 — September Fed hold odds jumped from 40% to 60%, and EUR/USD tapped 1.1563 and closed at 1.1522, down 0.17%. July PPI then printed 0.0% against 0.2% expected with the annual rate falling to 4.7% from 5.5%, and the pair held flat above 1.1500. Two consecutive dollar-negative surprises produced nothing.
The reason is that the euro leg is broken. Second-quarter GDP at 0.4% was the strongest since early 2025. July HICP rose to 2.9% with core at 2.5%. Unemployment held at 6.3%. Market pricing for the September ECB meeting approaches a full 25 basis point hike. Every one of those is euro-positive, and a run of better-than-expected eurozone data has failed to lift the currency. When positive domestic data stops moving a currency, the trade belongs entirely to the other leg.
The other leg will not move because the dollar carries a 137 basis point yield advantage, a ten-year at 4.67%, a thirty-year above 5%, October hike odds above 53%, December at 73%, and a safe-haven bid from an unresolved Strait of Hormuz that has held through every soft inflation print.
The structural problem is worse than the tactical one. Euro area inflation at 2.9% is 10.0% energy in a bloc that imports all of it, growing at 0.8%, with debt at 88.9% of GDP. That is a terms-of-trade tax, not demand strength, and the ECB is being forced to tighten into it. Tightening into an imported cost shock with negative growth momentum is not currency-positive — it is the configuration that produces 1.10, not 1.20.
The asymmetry is the conclusion. The bullish case — Fed holds, ECB hikes — is largely priced at 1.1522. The two unpriced outcomes both cut the other way: a September Fed hike at roughly 40%, and an ECB skip if Brent at $87 and falling drags August HICP below 2.9%.
Base case 1.1600 with the range intact. Bull case 1.1680 on a confirmed DXY break below 99.42. Bear case 1.1355, the 38.2% retracement and June low, with 1.1228 beyond it. The line that matters is 1.1510, where the reclaimed downtrend and channel top converge, and the decision dates are September 16 and the ECB meeting that precedes it.





