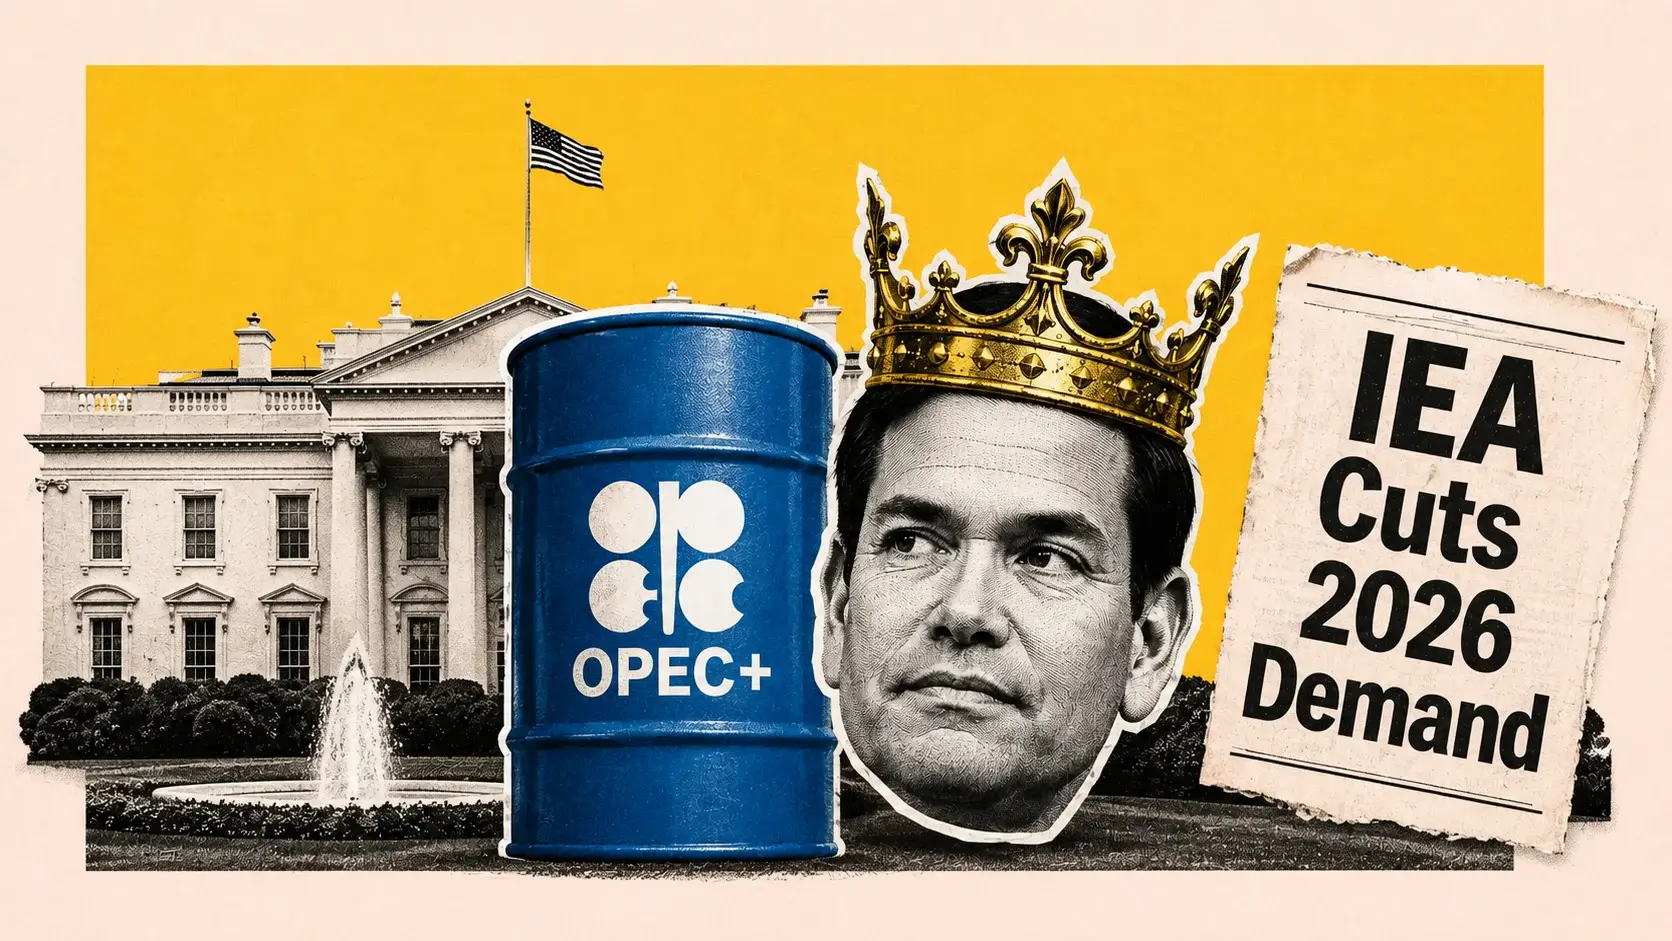
Oil Slides to $82 WTI as IEA Cuts 2026 Demand by 1.6M Barrels a Day
Brent fell to $87 after both major agencies downgraded demand on the continued Hormuz closure | That's TradingNEWS
Key Points
- WTI trades at $82.11 and Brent at $87.92 after the IEA cut 2026 demand by 1.6 million barrels per day.
- US commercial crude built 17.4 million barrels to 424.4 million, still 2% below the five-year average.
- The Strategic Petroleum Reserve fell 6.1 million barrels to 298.7 million, the lowest level since 1983.
West Texas Intermediate fell to $82.11 per barrel on Thursday, August 13, down 1.39% from the previous session, while Brent crude dropped to $87.92, down 1.19%. Both benchmarks extended losses through the European morning, with quotes reaching $81.32 for WTI and $87.04 for Brent — declines of roughly 2% on the day.
The overnight path was orderly. Brent eased from a Wednesday intraday high above $89 to trade below $89 at $88.56 in the Asian session, a 0.5% decline, while WTI traded 0.60% lower at $82.77. Selling accelerated into the European open and again ahead of the U.S. producer price release.
Over the past month WTI has risen 3.49% and Brent 3.76%. Year over year the gains are far larger: WTI up 28.38% and Brent up 31.53%. Those twelve-month figures capture the entire distortion of 2026 — a market that has been repriced by war rather than by fundamentals.
Wednesday's session was the more instructive one. Brent fluctuated around $89 as traders weighed conflicting signals on a potential U.S.-Iran agreement, with President Trump stating the United States has total control over the Strait of Hormuz while negotiations over the waterway remain deadlocked. That confrontational framing raised doubts about an immediate deal and kept a floor under the market despite bearish inventory data.
Thursday flipped the balance. Both OPEC and the International Energy Agency slashed their 2026 demand forecasts on Wednesday, and the market spent the following session pricing that rather than the geopolitical overhang. The IEA now expects global oil demand to contract by 1.6 million barrels per day this year, a 510,000 barrel per day larger decline than its July estimate, which had assumed Hormuz flows would gradually recover.
Natural gas trades near $2.65, and the U.S. dollar index sits at 99.87 to 100.03 after nine consecutive sessions inside a 99.50 to 100.00 band. Neither currency nor rate dynamics are driving crude at the moment. This is a pure supply-and-demand tape overlaid with a binary geopolitical variable, and for the first time in six months the demand side is winning.
The IEA Cut 2026 Demand by 1.6 Million Barrels and OPEC Followed
The August monthly reports from both major forecasting bodies landed on the same day and pointed in the same direction, which is unusual and carries more weight than either would alone.
The IEA's August report projects global oil demand falling by 1.6 million barrels per day across 2026. The July report had assumed gradual improvement in Hormuz transits and consequently a milder contraction; removing that assumption widened the projected decline by 510,000 barrels per day. Separately, the agency flags that the global oil market faces a shortfall of 1.8 million barrels per day during the current quarter as the conflict continues — a deficit and a demand collapse simultaneously.
That combination is the defining feature of the 2026 oil market and the reason forecasts diverge so violently. Supply is being destroyed faster than demand, producing a physical deficit, while demand destruction is severe enough that any supply normalization would immediately flip the balance to surplus.
OPEC has cut its 2026 demand growth forecast in three consecutive monthly reports. The July revision trimmed the number by 20%, with growth now projected near 970,000 barrels per day against an earlier 1.17 million. Contributors included a 60,000 barrel per day reduction to Indian demand growth and a projected 40,000 barrel per day decline in Middle East consumption. Middle East demand in March — the first full month of the war — ran roughly 500,000 barrels per day below the prior year.
The group's 2027 forecast moved the other way, raised 12% to 1.94 million barrels per day on stronger Chinese and Indian projections. A body expecting a soft 2026 and a firm 2027 is telling the market that it views the current weakness as price-induced destruction rather than structural loss.
The underlying demand data is worse than the headline growth revisions suggest. World crude demand fell from 81.26 million barrels per day in the second quarter of 2025 to 76.39 million in the second quarter of 2026 — a 4.87 million barrel per day drop, roughly 6%. China and Russia together accounted for a 2.31 million barrel per day decline in refinery crude input, about 47% of the world decrease.
A 17.4 Million Barrel Build Was the Largest Since Early 2023 — and Oil Barely Moved
The Weekly Petroleum Status Report released Wednesday covering the week ending August 7 delivered a build that should have broken the market and did not.
Commercial crude oil inventories excluding the Strategic Petroleum Reserve increased by 17.4 million barrels to 424.4 million barrels, the largest weekly build since early 2023. Total commercial petroleum inventories rose 15.7 million barrels. The industry estimate released the prior evening had already flagged a 9.07 million barrel increase against an expected draw of roughly 0.5 million, with Cushing stocks up 1.57 million.
Brent responded by trading around $89, roughly unchanged.
The explanation sits in the import line. Crude oil imports averaged 7.3 million barrels per day during the week, an increase of 1.14 million barrels per day from the prior week. Over the past four weeks imports averaged about 6.3 million barrels per day, just 0.1% higher than the same period last year. A single week of arrivals 1.14 million barrels per day above the run rate accounts for roughly 8 million barrels of the build on its own — a cargo timing artifact rather than a demand signal.
Refinery activity argues the same way. Crude oil refinery inputs averaged 17.2 million barrels per day, up 26,000 barrels per day, with refineries operating at 96.2% of operable capacity. Utilization near 96% is close to the practical maximum and indicates refiners are running as hard as they can. That is not the behavior of a system with excess crude and no demand for products.
At 424.4 million barrels, crude inventories remain approximately 2% below the five-year average for this time of year despite the largest build in three years. The stock level has normalized from a deficit rather than moved into surplus.
The market read it correctly. A near-record build that leaves inventories below the seasonal average, driven by an import surge into refineries running at 96.2%, is not bearish. It is a restocking event inside a structurally tight system, and traders priced it as such.
Products Tell the Opposite Story: Distillate 12% Below the Five-Year Average
The refined product picture is where the genuine tightness lives, and it moved in the opposite direction from crude.
Total motor gasoline inventories fell by 1.0 million barrels during the week and sit 6% below the five-year average, with both finished gasoline and blending component stocks declining. Distillate fuel inventories decreased by 0.1 million barrels and stand roughly 12% below the five-year average. Propane and propylene inventories rose 1.9 million barrels and sit 31% above the five-year average.
Distillate at 12% below the seasonal norm is the number that matters. Diesel and heating oil function as the leading indicator for industrial activity and freight demand, and a structural deficit in that market eventually pulls crude processing rates higher regardless of where headline crude storage sits. Distillate production rose to 5.3 million barrels per day during the week and inventories still declined marginally.
Demand data confirms the split. Distillate fuel product supplied averaged 3.7 million barrels per day over the last four weeks, up 1.9% from the same period last year. Jet fuel product supplied increased 3.8%. Motor gasoline product supplied averaged 9.0 million barrels per day, down 0.5%. Total products supplied averaged 20.7 million barrels per day, down 2.1% year over year.
The composition is a stagflationary demand profile: industrial and freight consumption holding or growing, discretionary consumer consumption contracting. Gasoline production actually decreased to 9.6 million barrels per day during the week, which is a refiner responding rationally to weak gasoline cracks and strong distillate cracks by shifting yield.
For price, the distillate deficit is the strongest bullish argument in the physical data. Crude can build 17.4 million barrels in a week and still leave a market where the products consumers and industry actually buy are 6% and 12% below normal seasonal cover. That gap has to close through higher refinery runs, which pulls crude out of the tanks that just filled.
The SPR at 298.7 Million Barrels Is the Lowest Since 1983
Buried beneath the commercial inventory headline is a figure with more strategic weight than any weekly build.
Another 6.1 million barrels came out of the Strategic Petroleum Reserve during the week, bringing the reserve to roughly 298.7 million barrels — its lowest level since 1983. That drawdown is a policy choice being used to suppress prices during the Hormuz disruption, and it has a finite endpoint.
The arithmetic is straightforward. At 6.1 million barrels per week, the reserve depletes at roughly 26 million barrels per month. Even allowing for an irreducible operational minimum well above zero, the policy tool has quarters rather than years of remaining capacity at the current pace.
The market implication is asymmetric and underpriced. Every barrel released from the SPR is a barrel of supply that will eventually need to be repurchased, converting present price suppression into future demand. More immediately, the release is masking the true tightness of the commercial balance. Strip 6.1 million barrels of SPR supply out of the week and the 17.4 million barrel commercial build shrinks materially.
Global inventory data reinforces the point. The EIA estimates global oil inventories fell by an average of 4.2 million barrels per day during the second quarter of 2026 and forecasts a further decline averaging 3.8 million barrels per day in the third quarter. OECD commercial oil stocks fell to 48.6 million barrels below the 2021–2025 average as of May. The implied stock draw based on OPEC supply and demand estimates for the first half of 2026 is 837 million barrels.
That is the reconciliation between a bearish U.S. weekly print and a bullish global balance. The United States is restocking because imports arrived and the SPR is being drained; the rest of the world is drawing down at nearly 4 million barrels per day.
A market working through 837 million barrels of implied global inventory in six months while the largest strategic reserve on earth sits at a 43-year low does not have a supply cushion. It has a timing problem.
PPI Energy Fell 3.1% and Crude Petroleum 11.9% — the Disinflation Is Oil
Thursday's Producer Price Index release quantified exactly how much of the U.S. inflation improvement is a function of the oil market, and the answer is nearly all of it.
Final demand was unchanged at 0.0% against a 0.2% consensus, with the annual rate falling to 4.7% from 5.5%. Final demand goods fell 0.7%, and a 3.1% decline in final demand energy was the major factor. Gasoline prices fell 5.7% and accounted for more than half the entire goods decrease. Diesel fuel, jet fuel and residual fuels all declined.
Deeper in the supply chain the moves are larger. Processed energy goods for intermediate demand fell 3.1%, with diesel fuel down 6.7% accounting for over half that decline. Unprocessed energy materials dropped 7.4%, and crude petroleum fell 11.9% — the single largest component move in the entire report.
Wednesday's Consumer Price Index showed the same pattern, with headline easing to 3.4% from 3.5% and gasoline down 2.9%, while core held at 2.5%.
The dependency runs both ways and creates a feedback loop the market has not fully internalized. Falling crude produces U.S. disinflation, which cuts September Fed hike odds to roughly 40% from near 50%, which weakens the dollar and eases financial conditions, which supports demand for oil. Rising crude reverses every step.
The March through May sequence demonstrates the mechanism at full force. Producer energy prices rose 10.5% in March, 7.2% in April and 8.2% in May as Brent averaged $103 in March and touched nearly $128 on April 2. That impulse pushed March CPI to 3.3% and forced the Federal Reserve from a cutting bias into an active hiking debate, culminating in the 9–3 vote at the July meeting with three dissents favoring a hike.
Core producer prices excluding food, energy and trade services accelerated to 0.4% in July from 0.1% in June, which means the underlying inflation pressure is still building. The headline improvement is borrowed entirely from crude, and crude is one Hormuz headline from taking it back.
The 2026 Price Path: $70 in February, $128 in April, $69 in July, $88 Now
No modern oil market has traded this range in six months, and the sequence is worth reconstructing because it defines the volatility regime traders must position for.
Brent entered late February around $70 per barrel on rising U.S.-Iran tensions, having shed roughly 20% across 2025 on oversupply concerns. On February 28, U.S. and Israeli strikes on Iran triggered the effective closure of the Strait of Hormuz. Within days Brent futures approached $120 — a 50% rise from the start of the year in a matter of weeks.
March delivered both directions. Iranian attacks on infrastructure and tankers pushed Brent above $114 early in the month. On March 11, reports that the U.S. was considering military action to seize control of the Strait sent WTI down 8.67% to $86.55 and Brent down 9.26% to $89.80 in a single overnight session as traders unwound longs anticipating a supply surge. Brent spot averaged $103 for the month, $32 above February.
April 2 marked the peak, with Brent daily prices climbing to nearly $128. The IEA's March report characterized the Hormuz closure as the largest supply disruption in the history of the global oil market. Global supply fell a further 1.8 million barrels per day in April to 95.1 million, bringing total losses since February to 12.8 million barrels per day, with Gulf output 14.4 million barrels per day below pre-war levels.
Mid-June brought the collapse. Prices fell under $70 as supply and demand rebalanced following a partial reopening of the Strait. Brent spot reached as low as $69 on July 2.
Late July reversed it again. Renewed attacks on tankers transiting Hormuz reduced shipments, a new blockade threat emerged against Saudi exports through the Bab el-Mandeb Strait, and a July 25 strike hit Yanbu. Brent recovered from $69 to the high $80s over roughly four weeks.
The lesson embedded in that path is that positioning has been the dominant driver, not fundamentals. Both the March 11 crash and the June collapse were triggered by expectations of supply normalization that never fully materialized, and both were fully reversed within weeks.
Hormuz: 20 Million Barrels a Day, Conflicting Signals, No Resolution
Approximately 20% of global oil supply — around 20 million barrels per day — normally transits the Strait of Hormuz. Its effective closure is the largest single supply disruption the oil market has ever recorded, and its resolution is the only variable that matters for the next $20 of price movement in either direction.
The current signals are irreconcilable. Pakistan's defense minister has stated that Washington and Tehran are close to some sort of arrangement regarding the Strait, with reports indicating Iran-Oman talks have reached an advanced stage. Iran's foreign minister has said an agreement with Oman to establish a shipping route is very close while cautioning it would not immediately restore flows. President Trump has stated the United States retains total control over the Strait, a claim private shipping data disputes by showing traffic well below normal levels.
The policy posture has shifted from active military campaign toward economic pressure, which cuts both ways: it lowers the probability of further supply destruction while also removing the pathway to forcible reopening that produced the March 11 collapse.
Physical constraints persist regardless of diplomacy. Alternative pipelines operated by Saudi Arabia and the UAE are restricted to lighter crude grades, leaving heavier supplies from those two countries plus Iraq and Kuwait effectively locked in. Attacks on vessels in the Red Sea and Gulf of Oman have continued.
The EIA's working assumption, set out in the August Short-Term Energy Outlook, is that severe constraints on Hormuz transits persist through August, that most regional crude production returns to near pre-conflict averages in early 2027, and that ongoing disruptions of roughly 0.6 million barrels per day continue through the end of next year.
That assumption is the single largest input into every published price forecast. If reopening arrives in September rather than 2027, the several million barrels per day of OPEC ceiling that currently reads as theoretical becomes real capacity within weeks, delivered into a market where the group has already cut its demand forecast three times. That asymmetry points down, and it is the reason forecasters see Brent falling through 2027 despite a 1.8 million barrel per day current-quarter deficit.
The EIA Raised Brent to $85 in Q3 and Sees $78 by Q4
The August Short-Term Energy Outlook, released August 11 with the forecast completed August 6, delivered the sharpest upward revision of the year and a declining path beyond it.
Brent crude spot prices are now forecast to average around $85 per barrel in the third quarter of 2026, $11 per barrel higher than the July projection. The revision reflects increased estimates of Middle East shut-in production due to continued severe constraints on Hormuz transits, which the agency assumes persist through August.
The forward path descends from there. Once traffic through the Strait gradually increases and shut-in production restarts, prices are forecast to fall to an average of $78 per barrel in the fourth quarter of 2026. Most shut-in production is assessed as largely restored during the first quarter of 2027, at which point global inventories begin building again and prices decline toward an average of $69 per barrel. Full-year 2027 forecasts sit at $76.09 for Brent and $72.43 for WTI. The 2026 WTI average was raised to $80.88 from $76.26.
At $87.92, Brent trades roughly 3.4% above the third-quarter forecast and 12.7% above the fourth-quarter number. WTI at $82.11 sits 1.5% above its raised full-year average.
The forecast is internally consistent and entirely dependent on one assumption. Global inventories falling 4.2 million barrels per day in the second quarter and a projected 3.8 million per day in the third keep prices elevated until flows normalize and stocks rebuild. That is the mechanism, and it holds only if the reopening timeline holds.
Independent bank forecasts span a range that reflects the same uncertainty rather than genuine disagreement about fundamentals. Brent year-end projections run from $60 to $95. Before the war, models had crude at or below $60 in the fourth quarter on a record supply surplus with strong non-OPEC+ output growth and rising OPEC+ targets expected to outpace demand for two years.
That pre-war surplus has not disappeared. It has been suppressed by 12.8 million barrels per day of supply loss. Every barrel of that loss is recoverable, and the demand it was meant to serve has since contracted by 1.6 million barrels per day.
Read More
-
Yen Stalls at 160 Despite a 3% JGB and Tokyo Core CPI at 2.0% — Intervention Sits at 164, Friday's Payrolls Decide
02.09.2026 · TradingNEWS ArchiveEnergy
-
MELI Stock Gap to $1,843 High as Ibovespa Surges 8.76% and Rate-Cut Bets Lift a $16.4B Credit Book — $2,270 Upside Case
05.10.2026 · TradingNEWS ArchiveStocks
-
XRP-USD ($1.52) Coils Under a $1.55 Ceiling as Whales Add 1.6B Tokens and RLUSD Tops $2.4B — $1.60 Breakout in Focus
05.10.2026 · TradingNEWS ArchiveCrypto
-
Brent Crude Stays Above $100 and WTI Slides Toward $88 as Gulf Exports Top Pre-War Levels While Hormuz Remains Shut
05.10.2026 · TradingNEWS ArchiveCommodities
-
S&P 500, Nasdaq and Dow Futures Dip as 5.28% Yields Test Friday's Rally; PTC Soars 36%, INTC Falls 3.9%
05.10.2026 · TradingNEWS ArchiveMarkets
-
Pound Sterling at 1.3228 Pinned Near a 3-Month Low as the Dollar Index Hits 102.53
05.10.2026 · TradingNEWS ArchiveForex
OPEC Without the UAE: 6.77 Million Barrels of Spare Capacity and a Broken Quota System
The most consequential structural change to the oil market in 2026 was not the war. It was the departure of OPEC's third-largest producer.
On April 28 the United Arab Emirates announced it would end its 59-year membership in OPEC and OPEC+, effective May 1. Abu Dhabi joined in 1967, four years before the UAE was formally established, making it one of the longest-serving members. The energy minister characterized the withdrawal as a policy decision following a careful review of current and future production policies, and confirmed the UAE did not consult Saudi Arabia or any other member beforehand.
The economic logic had existed for years. The UAE has invested approximately $150 billion in expanding capacity through its state producer, reaching roughly 4.85 million barrels per day against a 5 million target for 2027, while operating under a quota of 3.5 million. It produced about 3.4 million barrels per day, roughly 3% of global crude supply, before the war forced Gulf states to reduce shipments. In 2021 it blocked an OPEC+ agreement for weeks pushing for a higher baseline.
This is the largest defection in the cartel's 66-year history, exceeding Angola's 2024 departure, Ecuador's in 2020 and Qatar's in 2019.
Spare capacity within the remaining group has become difficult to measure. OPEC spare capacity was estimated near 6,771 thousand barrels per day in June 2026, roughly 4,009 thousand barrels per day below the estimate two months earlier. Output from the four producers subject to quotas where most spare capacity resides — Saudi Arabia, the UAE, Iraq and Kuwait — fell 9,540 thousand barrels per day between February and April before recovering 3,317 thousand over the following two months. Saudi capacity is assessed near 12.2 million barrels per day.
The distinction between capacity that exists on paper and capacity that can be delivered through a constrained waterway is the entire question. A cartel with 6.77 million barrels per day of nominal spare capacity that cannot physically ship it has no pricing power in either direction — and once the constraint lifts, it has an enormous overhang and one fewer member willing to absorb quota discipline.
The 188,000 Barrel Increments and the 7.51 Million Barrel Shortfall
The remaining OPEC+ core has continued restoring paper capacity in monthly increments that bear little relationship to actual output.
The group of eight has been raising crude production targets by 188,000 barrels per day per month, a pattern unchanged since May. Members are collectively 7.51 million barrels per day below target, which means the quota increases restore theoretical entitlement rather than delivering barrels. Compensation obligations for prior overproduction have already had their end-2026 deadline extended once, and a group whose members sit 7.51 million barrels per day beneath their allocations has no practical mechanism to enforce make-up volumes.
The commercial behavior is more informative than the quota announcements. Saudi Arabia cut its August Arab Light official selling price to Asia by the largest margin in more than two decades, set on July 6 — the day after a quota decision. Traders attributed the cut to expectations of Hormuz normalization and oversupply, and it was priced roughly two weeks before the Bab el-Mandeb disruption and the July 25 Yanbu strike. Those are two separate stories that should not be read as one.
A producer cutting its benchmark Asian price by the widest margin in twenty years is competing for market share, not defending price. That posture is consistent with a group that expects a soft 2026 and a firmer 2027 and wants volume positioning restored before the constraint lifts.
Reported Saudi output has been the subject of its own dispute. OPEC secretariat data put June production at 9.356 million barrels per day, up 173,000 on the month, while external trackers reported substantially higher figures. The report included an asterisked Saudi submission labeled as supply to market against wellhead production near 9.752 million barrels per day, with the secretariat requesting external trackers adopt the inventory-adjusted metric.
When the group's own production data requires a footnote to reconcile two measures nearly 400,000 barrels per day apart, quota compliance ceases to be a tradeable variable.
Technical Structure: $79.10 Support, $83.54 Target, $89 Ceiling on Brent
The chart structure is a short-term correction inside an uptrend, with well-defined levels on both benchmarks.
WTI is trading in a correction within a short-term uptrend and is declining toward the support zone at $79.50 to $79.10. That zone is the first genuine test. A bounce from it targets $81.33 initially and $83.54 as the second objective. A break below extends the correction toward the support band at $77.48 to $76.88, which marks the trend boundary. A separate reference places the pivot at $80.02, coinciding with the 50% Fibonacci retracement of the recent advance.
At $82.11, WTI sits roughly 3.7% above the primary support zone and 1.7% below the $83.54 upside target. The band containing it is narrow and the resolution should be quick.
Brent's structure mirrors it one tier higher. The $89 level has capped the market repeatedly through the past week, with Wednesday's intraday high above $89 rejected and the benchmark closing below it. Immediate support sits near $87, with the more significant zone at $85 where the third-quarter forecast average now functions as a psychological anchor. Below that, $80 is the round number and $78 the fourth-quarter projected average.
Upside resistance on Brent runs $89, then $92, with $100 requiring a genuine escalation rather than a technical break. The July 2 low at $69 and the April 2 high near $128 bracket a range so wide that conventional retracement analysis carries limited information.
The volatility regime is the more useful technical observation. This market has produced two single-session moves above 8% in six months, both driven by headlines rather than data, and both fully reversed within weeks. Positioning into either direction ahead of a Hormuz announcement carries gap risk that stop orders do not protect against.
The practical decision levels: WTI holding $79.10 keeps the uptrend intact and targets $83.54. Losing $76.88 breaks the trend structure and opens $74. Brent clearing $89 on a daily close targets $92; losing $85 opens $80.
Scenarios and Targets: $76.88 Floor, $85 Base, $100 on Escalation
The base case, carrying the highest probability, is continued range trade with a downward bias through the third quarter. This assumes Hormuz constraints persist through August without further escalation, demand downgrades continue to be absorbed, and the SPR release continues. Brent averages near the $85 third-quarter forecast and works toward $78 into the fourth quarter as shut-in production begins restarting. WTI holds $79.10 support and trades $80 to $85. Target: Brent $85, WTI $81.
The bearish case requires the diplomatic track to deliver. A negotiated reopening — with Iran-Oman talks described as advanced and both sides signaling proximity to an arrangement — would release several million barrels per day of currently theoretical capacity into a market where OPEC has cut demand forecasts three consecutive times and the IEA projects a 1.6 million barrel per day contraction. The pre-war surplus reasserts itself. Brent breaks $85, then $80, then $78, with the 2027 forecast path toward $76 and eventually $69 pulled forward. WTI breaks $76.88 and targets $72.43. Target: Brent $78, WTI $73.
The bullish case requires escalation. Renewed strikes on Gulf infrastructure, a formalized Bab el-Mandeb blockade against Saudi exports, or a breakdown in the Iran-Oman channel would remove the reopening premium currently embedded in price. With OECD stocks 48.6 million barrels below the five-year average, distillate 12% below seasonal norms, the SPR at a 43-year low of 298.7 million barrels, and a current-quarter deficit of 1.8 million barrels per day, the physical market has no cushion for another supply loss. Brent clears $89, then $92, and a repeat of the April spike takes it toward $114 and the $128 high. Target: Brent $100 initially, WTI $95.
The variable that decides between them is not economic. It is whether the arrangement that Iranian and Pakistani officials describe as close actually materializes, and whether it restores flows rather than merely establishing a route.
Verdict: A Deficit Market Trading Like a Surplus Market Because the Surplus Is Only Paused
WTI at $82.11 and Brent at $87.92 sit up 28% and 32% year over year in a market the IEA says faces a 1.8 million barrel per day shortfall this quarter, with global inventories drawing 4.2 million barrels per day in the second quarter and a projected 3.8 million in the third, OECD stocks 48.6 million barrels below the five-year average, and the U.S. Strategic Petroleum Reserve at 298.7 million barrels — the lowest since 1983.
That should be a $100 market. It is not, and the reason is the entire trade.
The market is pricing the reopening. Every forecast — the EIA's $85 third quarter falling to $78 in the fourth and $69 during 2027, the bank range of $60 to $95, the OPEC+ decision to keep restoring 188,000 barrels per day of paper quota — assumes Hormuz normalizes and 12.8 million barrels per day of lost supply comes back into a market where demand has contracted 1.6 million barrels per day and OPEC has cut its growth forecast three times running. A cartel whose members sit 7.51 million barrels per day below target, whose largest defector took 4.85 million barrels of capacity out the door on May 1, and whose de facto leader just cut its Asian benchmark price by the widest margin in two decades, is not positioned to defend price when that supply returns.
Wednesday's data made the same point twice. A 17.4 million barrel commercial crude build — the largest since early 2023 — barely moved the tape, because it came from a 1.14 million barrel per day import surge into refineries running at 96.2% utilization while gasoline sits 6% and distillate 12% below five-year averages and 6.1 million barrels came out of the SPR in the same week. Crude inventories at 424.4 million barrels remain 2% below the seasonal norm after the biggest build in three years.
July PPI quantified the feedback loop. Final demand energy fell 3.1%, gasoline 5.7%, and crude petroleum 11.9%, taking headline producer inflation to 0.0% and the annual rate to 4.7% from 5.5%. That disinflation cut September Fed hike odds toward 40%. It is entirely borrowed from crude, and it reverses on one headline.
The asymmetry has flipped since April. Then, the risk was escalation into a market with no supply cushion. Now, with Iran-Oman talks described as advanced and the U.S. posture shifted from military campaign to economic pressure, the larger unpriced move is a reopening that converts a phantom ceiling into real barrels within weeks.
Base case Brent $85 and WTI $81 through the third quarter. Bear case Brent $78 and WTI $73 on a negotiated reopening. Bull case Brent $100 and WTI $95 on escalation. The level that matters on WTI is $79.10, and the level on Brent is $85 — below those, the surplus thesis takes control.