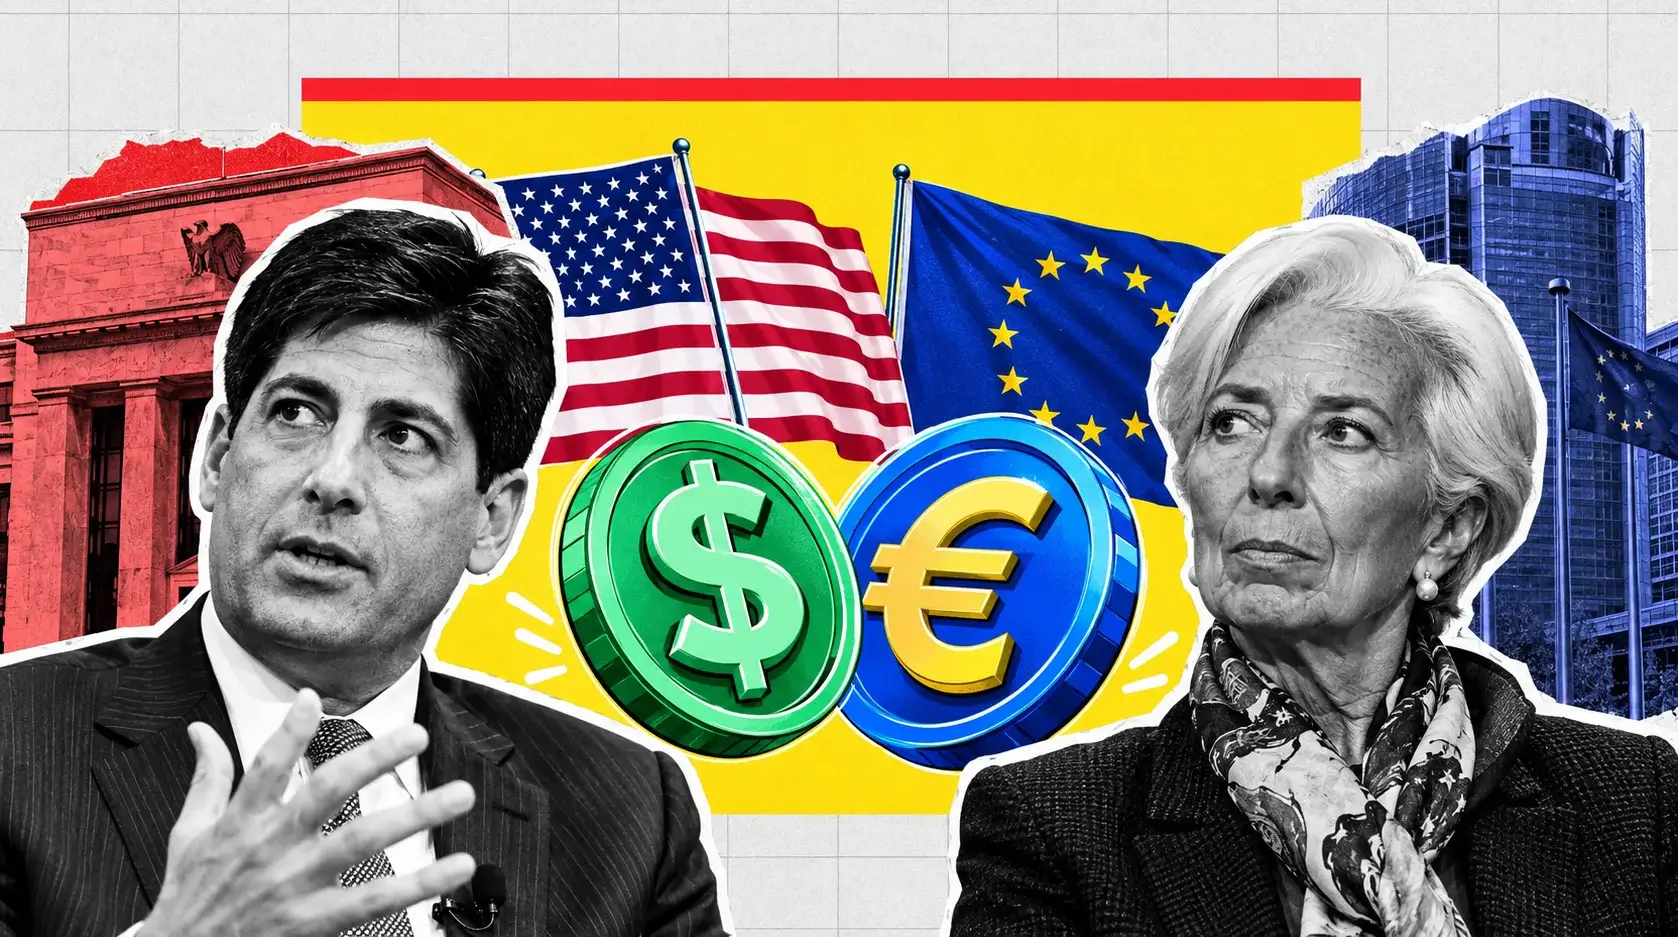
Euro Holds 1.1611 as the ECB Readies 2.50% and Fed Hike Odds Reach 60% — 1.1680 Is the Line for 1.1800
All 65 surveyed economists expect Thursday's 25-basis-point ECB increase | That's TradingNEWS
Key Points
- EUR/USD fell 0.10% to 1.1611, rejecting 1.1640 and holding the 1.1600 to 1.1610 shelf.
- The ECB is expected to lift the deposit rate to 2.50% and the refi rate to 2.65% Thursday.
- The Fed-ECB policy differential sits at 137.5 basis points with September hike odds near 60%.
EUR/USD traded at 1.1611 on Tuesday, down 0.10% from the previous session, after holding 1.1625 through the early European hours and recovering to 1.1626 by the New York afternoon. The pair has strengthened 0.59% over the past month and remains 0.78% lower across twelve months. Monday closed 0.12% higher. Two sessions, two moves inside 15 pips.
That compression is not indecision. It is the market correctly pricing a week in which both sides of the pair face the same event risk in the same direction.
The European Central Bank decides Thursday at 12:15 GMT. US Consumer Price Index data lands Friday at 08:30 Eastern. The Federal Open Market Committee meets the following Tuesday and Wednesday, September 15–16. Inside 96 hours, EUR/USD gets a euro-side tightening decision and a dollar-side inflation print that determines whether the Fed matches it.
The deposit facility sits at 2.25%. The federal funds target range is 3.50% to 3.75%. At the midpoint, the policy differential runs 137.5 basis points in the dollar's favour, and that single number explains more about this pair's behaviour than any chart pattern.
Thursday's expected 25-basis-point ECB increase narrows the gap to 112.5 basis points. A Fed hike on September 16 restores it to 137.5. The euro's entire upside case depends on those two decisions failing to cancel each other out, and right now the market is pricing them to cancel almost exactly.
The wider backdrop should be euro-negative and is not. Brent crude climbed 2.3% to $99.22, a six-week high, after Houthi militants struck Saudi energy infrastructure and the US hit three Iranian tankers over the weekend. European natural gas prices reached their highest level since late 2022. The eurozone imports the overwhelming majority of its energy. An oil and gas shock of this magnitude ought to be a straightforward terms-of-trade hit to the single currency.
It is not moving the pair because the same shock is feeding inflation on both continents, and both central banks are responding the same way. Symmetry has replaced divergence, and a currency pair without divergence does not trend.
The US 10-year yield at 4.80% and the 30-year at 5.27% cap any euro rally. Thursday decides whether that cap holds.
The Session: A 1.1640 Rejection and the 1.1600 Shelf
The intraday structure was a failed push and a defended floor. EUR/USD bounced off ascending support near 1.1570, pushed up to 1.1640, and stalled directly beneath channel resistance without generating any follow-through. From there it consolidated in a tight band around the 1.1610 pivot, the same pivot that has anchored price action since the decline from the 1.1720 highs.
The 1.1625 to 1.1640 zone is now immediate resistance. As long as the pair trades below 1.1640, recovery attempts keep meeting supply. Above it, a confirmed hourly break through 1.1645 opens 1.1680 to 1.1700.
Immediate support runs 1.1600 to 1.1610, which is where price spent most of Tuesday attempting to stabilise. A confirmed break below that zone exposes 1.1570 to 1.1580, and beyond that 1.1540 to 1.1550.
The multi-timeframe picture is split, which is exactly what a pre-event market looks like. The daily chart keeps the broader recovery from the July lows intact, with the pair trading above both its 20-day average and its 100-day average — underlying demand on dips, capped beneath the upper volatility band. The four-hour has shifted into consolidation between roughly 1.1570 and 1.1640. The hourly and 15-minute currently favour sellers after the rejection from recent highs.
Momentum on the daily has weakened since the rejection from the August high near 1.1680. That rejection is the reference point for the entire current structure: it established the ceiling of the range and started the sequence of lower intraday highs that produced Tuesday's 1.1640 failure.
Last week's lows near 1.1580 are the near-term floor. The pair has now defended pivotal support for a second consecutive week without generating a rally, which is the signature of a market waiting for information rather than one accumulating a position.
Volatility readings sit near the low end of the twelve-month distribution. Tuesday's range measured roughly 30 pips against an average that has run well above that during data weeks. Compression into a binary catalyst historically resolves through expansion, and the expansion arrives Thursday.
Thursday at 12:15 GMT: A Hike Nobody Disputes
The ECB decision itself carries almost no surprise risk, which is unusual and important.
The central bank is expected to lift the deposit facility rate to 2.50% from 2.25%, with the main refinancing rate moving to 2.65%. Every one of the 65 economists surveyed between August 31 and September expects that increase. Money markets fully price it. Policy announcements and the accompanying press conference are published at ecb.europa.eu.
Unanimity in a forecast survey is rare and it removes the decision as a trading event. A 25-basis-point increase that is 100% priced produces zero movement in EUR/USD when it lands. The euro has already absorbed it.
What has not been absorbed is the path afterwards, and the survey and the market disagree sharply on that.
Among surveyed economists, 91% expect the deposit rate to finish 2026 at 2.50% — meaning Thursday is the last hike of the cycle. A further 78% expect it to remain at 2.50% through the middle of 2027. That is a clear consensus for one-and-done.
Interest-rate markets have taken the opposite view. Traders are pricing roughly a 90% probability of a second increase before the end of the year, and assign close to certainty that the deposit rate reaches 3% by June 2027.
That gap between an economist consensus of "finished at 2.50%" and market pricing of "3% within nine months" is the actual EUR/USD trade this week. One of those two views is wrong, and Thursday's guidance is what starts to resolve it.
If the market is right, the differential against the dollar compresses further over the coming year and the euro has structural room toward 1.1800 and beyond. If the survey is right, Thursday marks the peak of the ECB cycle while the Fed is still deciding whether to tighten, and the differential reopens in the dollar's favour.
The decision is scheduled alongside updated staff macroeconomic projections, which will carry the inflation and growth numbers that justify whichever path is signalled.
The Real Trade Is the Guidance, Not the Twenty-Five Basis Points
With the increase fully priced, everything depends on the press conference and the projections.
The specific question is whether the ECB treats September's move as the end of the tightening cycle or leaves the door open to more. The framing of that answer moves EUR/USD by more than the rate change itself.
Three outcomes are worth mapping.
A hawkish hold-the-door-open message — language emphasising that inflation at 3.3% remains too far above target and that energy costs create upside risk — validates market pricing for a December follow-up. That narrows the expected differential path against the dollar and puts 1.1680 and then 1.1700 in play immediately. Above 1.1700, resistance thins out considerably.
A neutral message that treats 2.50% as an appropriate terminal level without ruling anything out leaves the pair exactly where it is. The range holds, the market waits for Friday's US inflation print, and EUR/USD spends another session between 1.1570 and 1.1640.
An explicitly dovish framing — signalling that the tightening cycle has concluded — would be a genuine surprise given the energy backdrop, and would take the euro through 1.1580 toward 1.1540 with the December hike pricing unwinding rapidly.
Upgraded growth projections are already in circulation. Eurozone growth forecasts for 2026 have been raised by 0.3 percentage points to 0.8%, and 2027 forecasts by 0.1 percentage points to 1.2%. Those are modest absolute numbers but the direction of revision matters, because a central bank raising its growth outlook while inflation sits at 3.3% has limited grounds for declaring the cycle finished.
The historical pattern with this institution is caution in the face of geopolitical uncertainty. Erring toward tightening while a US-Iran conflict keeps oil elevated is the path of least regret for a committee whose mandate is price stability and nothing else.
The scheduling helps the euro marginally. The ECB speaks Thursday, before US CPI on Friday. Whatever the euro gains from a hawkish message, it holds for a full trading session before the dollar gets its own catalyst.
Eurozone Inflation at 3.3% and Gas at a Four-Year High
The euro-side inflation picture is what makes Thursday's hike straightforward and December's a live question.
Eurozone inflation stands at 3.3%, well above the 2% target and rising rather than falling. The driver is energy. European natural gas prices have climbed to their highest level since late 2022, and Brent at $99.22 feeds directly into transport, heating and industrial input costs across a bloc that imports the overwhelming majority of its energy.
That combination — inflation at 3.3% and a fresh energy shock landing on top of it — is why the eurozone unemployment rate dropping to a multi-year low in July did not trigger a dovish reaction. A tight labour market plus an energy shock plus inflation 130 basis points above target is a tightening case that writes itself.
The complication is growth. At 0.8% for 2026 even after an upgrade, the eurozone is not expanding fast enough to absorb higher rates comfortably. That is the tension the central bank has to navigate, and it is why the economist consensus expects a stop at 2.50% while markets expect 3%.
The energy channel also creates an asymmetry that works against the euro over a longer horizon. Higher oil prices are a terms-of-trade shock for a net importer. Every dollar of increase in Brent transfers real income from the eurozone to producing economies, and the currency of a net importer should weaken on that basis alone.
That mechanism has not asserted itself yet because the inflation-and-rates channel is currently dominant. If the ECB signals it has stopped tightening while oil stays near $100, the terms-of-trade channel takes over and the euro loses its support.
Harmonised inflation data for the bloc is published by the statistical office at ec.europa.eu/eurostat, with the next flash estimate following the meeting.
Front-end euro yields should stay relatively anchored while the ECB holds, with longer-dated yields continuing to respond to energy price developments. That shape favours a flatter curve and limits how much yield support the euro can generate at the short end.
162,000 US Payrolls and a 60% September Hike
The dollar side of the pair got its catalyst four days before the euro side.
August nonfarm payrolls rose 162,000, against a market forecast of roughly 56,000 — a beat of nearly three times. July was revised upward to a 23,000 gain. The unemployment rate held steady at 4.1%. Annual wage growth eased to 3.1%, a deceleration smaller than markets had positioned for. Detail is published by the Bureau of Labor Statistics at bls.gov.
The euro weakened back below $1.16 on the release. Money markets moved the probability of a September Fed hike to roughly 60% from about 50% before the data. Treasury yields rose across the curve, with the 2-year note reaching its highest level since January 2025.
That repricing did not begin with payrolls. Fed Chair Kevin Warsh, who took office in May 2026 for a four-year term running to 2030, delivered a hawkish message at Jackson Hole on August 28 stating that underlying inflation needs to move toward the target clearly and at sufficient speed. Hike odds climbed from 35.4% the day before that speech to about 57.5% on the day and reached 60.4% by August 31. Payrolls confirmed the direction rather than establishing it.
Three committee members are now voting to tighten. The meeting calendar and statements are published at federalreserve.gov.
For EUR/USD specifically, this creates the mirror image of the euro-side setup. The ECB hike is fully priced and the Fed hike is 60% priced. That 40% of unpriced probability is where the dollar's remaining upside sits, and it is entirely dependent on Friday's inflation print.
Every dollar forecast written this summer rested on the assumption of a softening US labour market. The August report removed that foundation in a single release, which is why the euro's recovery from the July lows stalled precisely at 1.1680 rather than extending toward 1.1730.
The pair's correlation profile confirms the mechanism. EUR/USD shows a strong negative relationship with outright US two-year yields — incredibly strong over the short term and durable over longer windows.
The 137.5 Basis Point Gap and What Thursday Does to It
Reduce the pair to its arithmetic. The Fed's target range is 3.50% to 3.75%, a midpoint of 3.625%. The ECB deposit facility sits at 2.25%. The differential is 137.5 basis points in the dollar's favour.
That single number is the most important input for EUR/USD, and the four scenarios across this week and next define the trading range.
Scenario one: ECB hikes Thursday, Fed hikes September 16. The differential returns to 137.5 basis points. Nothing changes structurally, and EUR/USD stays inside 1.1570 to 1.1700. This is the modal outcome at roughly 60% Fed probability.
Scenario two: ECB hikes, Fed holds. The differential compresses to 112.5 basis points — a 25-basis-point improvement for the euro, and the first genuine narrowing of the gap this cycle. That is the setup that carries the pair through 1.1700 toward 1.1730 and potentially 1.1790.
Scenario three: ECB hikes and signals more, Fed hikes but signals a pause. The differential holds at 137.5 in level terms but the forward path narrows sharply, since markets already price the ECB toward 3% by June 2027. This is the most euro-positive combination available and the one that would justify targets in the 1.1800 area.
Scenario four: ECB hikes and calls it the end of the cycle, Fed hikes and stays open. The forward differential widens. That takes the pair back through 1.1580 and toward 1.1515.
A fair-value estimate anchored purely on the two-year German-US yield spread currently sits around 1.1650, modestly above the spot rate. That is a narrow measure rather than a broad price target, but it indicates the pair is trading slightly cheap to its own rate relationship — roughly 40 pips of catch-up if spreads hold where they are.
The Bank of Japan is also expected to raise rates this month, making three major central banks tightening simultaneously. That synchronisation compresses relative-value opportunities across the entire G10 complex and is a further reason FX volatility has collapsed into this week.
Two-Year Spreads Are the Only Correlation That Matters
EUR/USD is a front-end rates play from a day-to-day directional perspective. That is not a stylised description — it is measurable, and the measurement is unusually clean right now.
The pair shows a strong positive relationship with the German-US two-year yield spread and a strong negative relationship with outright US two-year yields. Those two correlations dominate every other input, including risk sentiment, equity direction and commodity prices.
The practical consequence is that anything capable of shifting the policy outlook for either central bank moves the pair, and anything that cannot is noise. Tuesday demonstrated it precisely. US equities sold off with the Dow shedding 570.78 points to 52,843.47 and the S&P 500 (SPX) slipping 0.35% to 7,691.55. Brent ran to a six-week high. Canada's retaliatory tariffs on American goods took effect. Gold fell 0.38% to $4,395.51 and Bitcoin lost 0.81% to $78,542.62.
EUR/USD moved 15 pips.
None of those developments changed the expected path of either policy rate, so none of them moved the pair. That is a market with an extremely narrow transmission function, and it is why the range has held for two weeks.
The correlation also explains the shape of the coming move. When a pair is driven by front-end spreads and both catalysts are dated, price does not drift toward its destination. It gaps. Between the current level and the next significant horizontal reference above sits open territory with no meaningful structure, which means a dollar-negative print delivers a fast move rather than a grinding one.
The same asymmetry applies below. Support at 1.1570 to 1.1580 is well-defined and has been tested repeatedly. Beneath it, the next durable reference is considerably lower.
Positioning reflects this. Dollar longs held firm into Jackson Hole while euro, yen and commodity currency positioning diverged ahead of the US data. That divergence has not resolved, which leaves the market vulnerable to a squeeze in either direction depending on which catalyst lands first with force.
Friday's CPI Completes the Week's Symmetry
US Consumer Price Index data lands Friday, September 11 at 08:30 Eastern, roughly twenty hours after the ECB speaks. Producer price data arrives Thursday alongside the European decision.
The sequencing gives the euro one advantage and one hazard. Whatever it gains from a hawkish ECB message, it holds through Thursday's session before the dollar gets its own number. But a hot US print on Friday can erase a full day of euro gains inside a single hour, because the move would be driven by front-end rates rather than by sentiment.
A cool US print is the cleanest euro-positive outcome available. It would cut September hike odds from 60% back toward the 40s, drop US two-year yields, and widen the German-US spread in the euro's favour. Combined with a Thursday hike already delivered, that combination takes EUR/USD through 1.1645, then 1.1680, and into the 145 pips of relatively open territory above.
A hot print effectively locks the September 16 hike. Two-year yields push higher, the differential stays at 137.5 basis points with a hawkish forward path attached, and the pair breaks 1.1580 toward 1.1515.
An in-line print produces the least useful outcome — continued range trading with the decision deferred to the meeting itself, and another week of 30-pip sessions.
The August reading carries one structural limitation worth naming. It will not capture this week's energy move at all. Brent's run toward $100 lands in the September data, published after the FOMC meets. Friday's number is a partially stale read on a picture that has been deteriorating in real time since crude cleared $95.
That timing works against the dollar in the very short term and for it over the following month. A benign August print buys the Fed room to hold on September 16, but the September print will arrive with the energy shock fully embedded, keeping December live regardless of what happens next week.
Read More
-
Yen Stalls at 160 Despite a 3% JGB and Tokyo Core CPI at 2.0% — Intervention Sits at 164, Friday's Payrolls Decide
02.09.2026 · TradingNEWS ArchiveEnergy
-
GLD ETF Sheds Value With Bullion as North American Funds Stay $7.7B in the Red
10.09.2026 · TradingNEWS ArchiveStocks
-
XRP ETF Flows: 7 Funds Split $1.682B With the Complex at Just 1.68% of Market Cap
10.09.2026 · TradingNEWS ArchiveCrypto
-
NG Breaks $2.90 With Production at 113 Bcf/d and LNG Feedgas Capped at 18.3 Bcf/d
10.09.2026 · TradingNEWS ArchiveCommodities
-
USD/JPY Holds Below the 157.23 Average as 2 Central Banks Tighten in 48 Hours
10.09.2026 · TradingNEWS ArchiveForex
The Dollar Index at 99 Between 98.5 and 100.5
The broader dollar picture frames the pair's range. The US Dollar Index closed Monday down 0.25% at 98.91 and has been oscillating near 99.0 to 99.2 in recent sessions after Friday's post-payrolls rebound carried it to 99.3 from a two-week low.
The 52-week range runs roughly 95.6 to 101.8. Resistance sits at 100.5 with support at 98.5. On the four-hour chart the index has been consolidating between its 50-period average at 99.886 and its 200-period average at 98.998 since the Jackson Hole rebound, with relative strength at 60.89 against its own moving average of 65.57 — momentum cooled without the recovery breaking.
The euro carries the largest weight in the index by a wide margin, which makes DXY and EUR/USD close to a single trade expressed two ways. A DXY move to 100.5 corresponds roughly to EUR/USD at 1.1500. A move to 98.5 corresponds roughly to 1.1700.
The dollar has also been drawing safe-haven flow as the US and Iran exchange strikes on vessels. That flow used to split between the dollar and gold. In the current cycle it is going almost entirely to the dollar, because the dollar pays 3.50% to 3.75% and gold pays nothing.
That dynamic is euro-negative in any escalation scenario, and it is a risk the technical picture does not capture. A significant deterioration in the Gulf produces dollar buying regardless of relative policy positioning, and the euro is the natural funding currency for that flow.
Working the other way, the dollar's recent pullback below 99.00 reflects positioning ahead of Thursday's producer price data and Friday's CPI rather than any change in the policy outlook. Traders have reduced exposure into the events rather than pressing.
The index is sensitive to any surprise in core inflation measures or to revisions in growth and labour data. Both are on the calendar this week.
The 1.1570 to 1.1680 Range and What Actually Breaks It
Consolidate the map. EUR/USD is trading in a band that has contained it for two weeks, and the boundaries are unusually well-defined.
The floor is 1.1570 to 1.1580, which corresponds to last week's lows and to ascending trendline support on the hourly. That zone has been defended twice. A sustained move below 1.1570 weakens the broader recovery from the July lows and strengthens the case for a deeper corrective leg.
The ceiling is 1.1680, the August high and the level whose break shifts the structure from corrective to constructive. Between the current 1.1611 and that ceiling sit two intermediate barriers: 1.1640, which rejected Tuesday's push, and 1.1645, whose hourly break opens the path to the 1.1680 to 1.1700 range.
The pivot zone at 1.1580 to 1.1610 carries additional significance on the daily. The pullback from the 1.1700 rejection represents a standard retest of a broken descending channel boundary. Holding above that retest keeps the bullish continuation structure intact. Losing it turns the entire August recovery into a failed breakout.
Wider context matters here. The pair has been consolidating within a 1.1590 to 1.1730 band since early August, with a short-term descending trendline still intact overhead. Tuesday's action sits in the lower half of that larger band.
Momentum indicators read neutral rather than directional. The MACD has been flat near the zero line, the stochastic has stabilised below the 80 threshold, and relative strength hovers slightly above 50. There is no oversold signature, no overbought extreme and no divergence anywhere in the data.
That is the correct configuration for a market whose next move is determined by scheduled information rather than by flow. Indicators cannot anticipate a central bank press conference.
The trading implication is direct. Positioning inside a 110-pip range ahead of two binary events offers a poor risk profile in either direction. The move that matters begins Thursday at 12:15 GMT.
Above 1.1700: 1.1730, 1.1790 and the Multi-Year High
Map the upside properly, because the levels thin out quickly once the ceiling breaks.
The first barrier is 1.1645 on an hourly closing basis. Above it, 1.1680 to 1.1700 is the zone where the August rejection occurred and where the medium-term sequence of lower highs would be broken. Clearing 1.1680 on a daily close is the single most important technical development available to euro bulls, because it changes the structure from a correction inside a downtrend to a genuine recovery.
Above 1.1700, the next reference is 1.1730 — the level that has capped the pair repeatedly since early August and the top of the wider consolidation band. A sustained move above it would pave the way for a retest of 1.1790, followed by the multi-year high at 1.1830 and then the psychological thresholds at 1.1900 and 1.2000.
The spacing matters. From 1.1611 to 1.1680 is 69 pips. From 1.1680 to 1.1730 is 50 pips. From 1.1730 to 1.1790 is 60 pips. Those are tight increments for a pair with EUR/USD's liquidity profile, which means a genuine catalyst can cover the entire sequence inside two sessions.
A fair-value estimate on the two-year German-US spread sits near 1.1650, which suggests the first 40 pips of any rally are catch-up to existing rate relationships rather than a new repricing. Beyond 1.1650, the move requires spreads to actually improve rather than just for spot to converge on where they already are.
The combination that delivers the full sequence is specific: a hawkish ECB message Thursday that validates market pricing for a December follow-up, plus a cool US CPI Friday that pushes September hike odds below 50%. Both are plausible. Neither is priced.
The daily structure supports the case conditionally. The pair trades above its 20-day and 100-day averages with underlying demand visible on dips. Holding the 1.1580 to 1.1610 retest keeps a continuation toward 1.1800 technically viable.
What blocks it is the 137.5 basis point differential, which does not narrow on a single ECB hike alone.
Below 1.1570: 1.1515, 1.1370 and the Structural Floor
The downside map is longer and thinner, which is the asymmetry that matters most for anyone positioned long.
Immediate support at 1.1600 to 1.1610 is where the pair spent Tuesday stabilising. A confirmed break exposes 1.1570 to 1.1580, the twice-defended zone corresponding to last week's lows and hourly ascending trendline support.
Below 1.1570, the next area is 1.1540 to 1.1550, which would come into play if selling accelerates. Then the structure gets sparse. A decisive break below 1.1590 support and the long-term ascending trendline shifts focus toward the 100-day simple moving average at 1.1515.
Beneath that, the longer-term ascending line sits near 1.1370, with 1.1350 as the extension if the macro downtrend resumes. A daily close back below 1.1500 would invalidate the entire August breakout and threaten that deeper move.
The distances: 1.1611 to 1.1570 is 41 pips. To 1.1515 is 96 pips. To 1.1370 is 241 pips, or 2.1%. The gap between 1.1515 and 1.1370 contains no significant horizontal reference, which means a break of the 100-day average produces acceleration rather than a controlled decline.
That is the risk profile in a sentence. Upside from here runs 69 pips to a well-defended ceiling. Downside runs 96 pips to the last major average and then opens into empty space.
The scenario that produces it is a dovish ECB framing Thursday combined with a hot US print Friday — the ECB declaring the cycle finished at 2.50% while the Fed's September hike gets locked in. That would confirm the widest forward differential of the year and remove the euro's only source of support.
The 1.14 handle carries additional weight because it was the level the pair defended after retreating from the 2026 high. A break there would confirm that this year's central bank convergence has resolved in the dollar's favour.
Against that, the euro retains one structural cushion: the market's near-certainty that the deposit rate reaches 3% by June 2027. As long as that pricing holds, sustained breaks below 1.1500 require a genuine dovish shift rather than just a strong dollar.
Verdict: Two Hikes, One Range, and Thursday Breaks the Symmetry
EUR/USD at 1.1611 is not stuck because the market lacks conviction. It is stuck because both central banks are tightening into the same energy shock in the same week, and symmetry produces no trend. The ECB lifts the deposit rate to 2.50% and the refi rate to 2.65% on Thursday at 12:15 GMT with all 65 surveyed economists in agreement and money markets fully priced, which means the decision itself moves nothing. The trade sits entirely in the guidance, where an economist consensus of 91% expecting 2.50% to be the terminal rate collides with market pricing of roughly 90% odds on a second hike this year and near-certainty of 3% by June 2027. Resolve that gap toward the market and the 137.5 basis point differential against the Fed starts compressing on a forward basis for the first time this cycle; resolve it toward the survey and the euro loses its only support with Brent at $99.22 and European gas at a four-year high working against a net energy importer. Friday's US CPI completes the pair, with September hike odds at 60% after 162,000 August payrolls against a 56,000 forecast and the 10-year holding 4.80%. The forecast is range-bound until one of those two lands. Hold 1.1570 and clear 1.1645 on an hourly close and the path opens to 1.1680, then 1.1700, with 1.1730 and 1.1790 behind it — roughly 60 to 155 pips of upside, and the 1.1680 daily close is what converts this from a correction to a recovery. Lose 1.1570 and the sequence runs 1.1540, then the 100-day average at 1.1515, then open territory to 1.1370. Fair value on the two-year German-US spread sits near 1.1650, so the first 40 pips of any rally are catch-up rather than repricing. Bias is neutral inside 1.1570 to 1.1680, mildly constructive on a hawkish Thursday, and decisively bearish below 1.1500 — and there is no reason to hold a position across a central bank decision hoping for a slightly better rate when the entire decision zone spans less than 3%.