GBP/USD Price Forecast: Cable Bounces From $1.3300 5-Week Low to $1.3375 as Tasnim Sanctions Reversal Eases Dollar
UK Prime Minister Keir Starmer faces leadership challenge from Andy Burnham after Labour election defeat | That's TradingNEWS
GBP/USD (Cable) is trading at $1.3375 in the New York session Monday after a constructive bounce from the early European low of $1.3300 — the weakest print in over five weeks for the pair. The recovery toward $1.3380 represents a roughly 80-pip rally from intraday lows, triggered primarily by the Iranian news agency Tasnim's report that Washington had accepted a temporary sanctions waiver during ongoing negotiations. That single headline knocked roughly $5 off Brent crude, took the U.S. dollar bid out of the market, and gave Sterling room to breathe.
The bigger picture remains contested. GBPUSD is down 0.29% on the trailing 24-hour basis from $1.3392, down 0.43% on the month from $1.3373, but still up 3.68% on the three-month look-back from $1.3925 — the volatility has been brutal, but the longer-duration trend has been broadly sideways inside a wide consolidation. The 12-month return is barely positive at 0.35% versus $1.3478, which captures the structural reality: Cable has been range-bound for the better part of a year, and the current price action is just another oscillation inside that band.
What makes this Monday's setup interesting is the convergence of three high-impact catalysts in the next 72 hours: Wednesday's U.K. CPI print, Wednesday's FOMC minutes from the Federal Reserve, and the ongoing political turbulence around Prime Minister Keir Starmer's leadership. Any one of those events can drive a 100-200 pip move. All three landing within 48 hours of each other creates a setup where the current consolidation between $1.3300 and $1.3400 is unlikely to survive intact.
The Starmer Crisis and the Sub-Prime Era Gilt Yields
The UK political backdrop is the single most idiosyncratic driver pressing on Sterling right now. Prime Minister Keir Starmer is facing a leadership challenge from Greater Manchester Mayor Andy Burnham after the Labour Party's defeat in regional elections, with multiple ministerial resignations adding to the pressure. The analyst consensus at Jefferies has shifted to a base case of "a managed exit for Starmer," with Burnham emerging as the most likely successor.
The gilt market is pricing the leadership transition aggressively. The 10-year UK gilt yield has surged to roughly 5.19% — the highest level since the subprime crisis of 2008. That is not a typo: gilt yields have not been at these levels since the global financial crisis was actively unfolding. The move higher is up nearly 3% on the day alone. The mechanism behind the surge is straightforward — markets fear that any new leadership would pursue a looser fiscal policy, which would expand the debt-issuance pipeline and pressure UK government bond prices lower.
The House of Commons Library has just published a detailed briefing clarifying that gilts represent approximately 85% of outstanding UK government debt, and interest servicing costs respond immediately to changes in the Bank of England's benchmark rate. That direct linkage means every basis point of yield move feeds straight into the UK fiscal picture. With BoE Bank Rate at 3.75% and the central bank signaling further tightening possible, the combination of high policy rates and rising gilt yields is squeezing the fiscal envelope at exactly the moment political instability demands fiscal flexibility.
That is the structural reason GBP/USD has been under pressure even on days when the dollar weakens broadly. The market is pricing UK political risk independent of the global macro backdrop.
Why the Bond Market Is Doing the Heavy Lifting
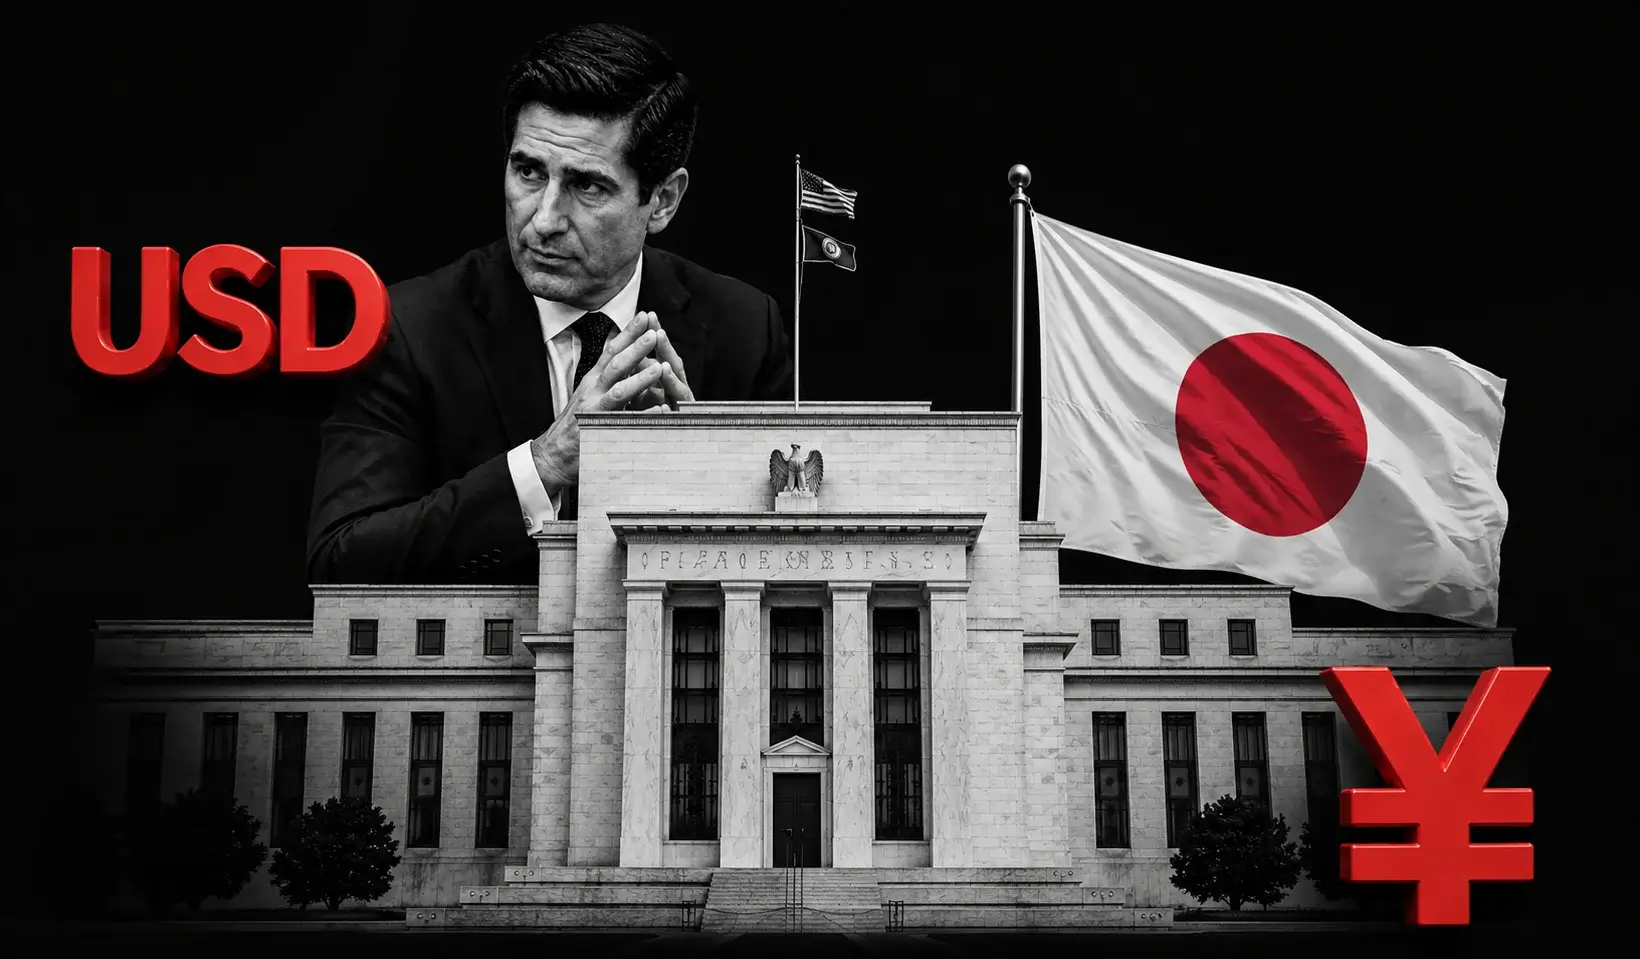
Across the Atlantic, the U.S. side of the Cable equation is dominated by the same bond market dynamic that has reshaped every G10 currency pair this month. The benchmark 10-year U.S. Treasury yield touched 4.63% intraday Monday — the highest level in more than a year — before fading. The 30-year yield is at 5.159%, also a one-year high. The hot April CPI print at 3.8% year-over-year and the explosive PPI reading at 6% — the hottest in nearly four years — have completely repriced the Fed expectations curve.
Markets are no longer questioning whether the Federal Reserve might ease. They are increasingly questioning whether the Fed has room to consider hikes through late 2026 or early 2027. The CME FedWatch tool now shows roughly 97.4% probability the FOMC holds rates at 3.50% to 3.75% at the June meeting, with hike probability for 2026 climbing toward 52%. That is a complete pivot from the late-2025 narrative of multiple cuts, and the dollar has been catching a structural bid as a result.
The cleanest expression of that dollar strength is the U.S. Dollar Index. The DXY is sitting at $99.19 after rallying through a series of green engulfing candles from the white descending trendline that had been in place since the April highs. Price has cleared the 50-period moving average at $98.80, and the Fibonacci projection from the latest May swing targets $99.33 to $99.66 as the next resistance zone. The RSI has climbed above 52 without yet reaching overbought, which suggests momentum has room to extend if catalysts cooperate. As long as the DXY stays above $98.80, the structural bid in the dollar remains intact — and Cable mechanically struggles to break above $1.3400 in that environment.
The Calendar Risk: Wednesday Defines the Week
The single most consequential calendar event for GBPUSD this week is the U.K. CPI print Wednesday. If headline U.K. inflation accelerates beyond consensus expectations — particularly if it confirms the energy-driven pass-through that has plagued European inflation prints over the past two months — markets will be forced to price in a more prolonged period of restrictive monetary policy from the Bank of England. That repricing would normally be Sterling-positive, but the gilt market is already pricing maximum fiscal risk, so an upside CPI surprise could actually trigger a brief Sterling rally before the underlying fiscal concern reasserts itself.
The FOMC minutes Wednesday provide the symmetric U.S. catalyst. Four dissenters at the most recent Fed meeting already signaled internal divisions. If the minutes reveal that the hawkish camp is gaining strength — particularly if there is meaningful discussion of how the energy-driven inflation should be handled — Treasury yields likely push higher, the dollar gets a fresh bid, and Cable faces renewed pressure toward $1.3300 and below.
Fed Governor Christopher Waller is also scheduled to speak Tuesday, which precedes both prints. His commentary has historically moved the curve meaningfully, and any hawkish framing from Waller would pre-position the market for hawkish minutes Wednesday afternoon.
Later in the week, flash PMI data for both the U.K. and U.S. provides the broader read on whether global growth is being meaningfully impaired by the elevated oil price regime. The U.K. is particularly exposed because of energy import dependency, and a weak U.K. PMI print combined with hot CPI would create the worst possible scenario for Sterling — stagflation pricing that pressures both the equity and bond complexes simultaneously.
Daily Chart Structure: The 5-Week Low at $1.3300 Defines the Bear Case
The daily timeframe on GBP/USD shows a clear sequence of lower highs since early May, with the pair printing $1.3300 as the operative downside boundary. That level represents both the round-number psychological floor and the multi-week structural support — when price reaches a major round number that has also served as horizontal support, the confluence creates a stronger defensive level than either factor on its own.
The pair is trading well beneath all the major daily moving averages. The 20-day SMA sits at $1.3526. The 50-day SMA is at $1.3436. The 200-day SMA reads $1.3403. Price below all three is the textbook signature of a fully broken trend structure. The 20-day EMA at $1.3483 has acted as resistance on every rally attempt over the past two weeks. Until Cable can close above that level on a daily basis, the medium-term bias remains negative.
The RSI on the daily timeframe reads 35 to 36.8 depending on the specific calculation period — that is approaching oversold but not yet at the panic-bottom levels typically associated with capitulation. The Stochastic RSI is in oversold territory. The MACD remains negative but the histogram has been contracting, suggesting downside momentum is fading rather than accelerating. The ADX is elevated, which signals the existing trend has strength rather than being a noise-driven move.
The key downside reference levels below $1.3300 are clearly mapped. The first major support beneath the round number is $1.3284, then $1.3252, and ultimately $1.3213 where the prior rising trend-line meets price. A clean break of $1.3213 opens the path toward $1.3100, which is the deeper structural floor that defines the bear case for the next three to six weeks.
The 4-Hour Picture: A Bullish Hammer at the $1.334 Channel Support
The 4-hour timeframe tells a slightly more constructive near-term story. GBP/USD is currently defending a white rising trendline that has been in place since the start of May. Price last tested the $1.334 Fibonacci support and has produced a sequence of higher lows inside the channel. The most recent candle action has formed a bullish hammer pattern at the channel support — that pattern is the textbook signature of buyer absorption at a key level, and it typically signals at least short-term continuation higher.
A red moving average at $1.337 is currently acting as immediate resistance. Above that, the Fibonacci projection targets $1.339 to $1.344 as the next resistance zone. The 4-hour RSI is maintaining steady momentum around 52, which is neutral with a slight bullish tilt. Volume profile analysis identifies $1.335 as the major pivot and support point — that level is now the dividing line between the near-term constructive and destructive setups.
Above $1.3400, the resistance ladder runs $1.3450, $1.3500, and then $1.3550 where the prior peak rests. Below $1.3300, the structural break activates the deeper $1.3213 to $1.3100 zone as the next leg lower.
The Tactical Trade Setup
The cleanest tactical setup emerging from the technical structure is asymmetric and well-defined. Long positioning on a bullish price action reversal at $1.3300, $1.3284, or $1.3252 — with stops 1 pip below the local swing low and a move to break-even at 25 pips of profit — captures the rounded bottom pattern that has formed at the round-number support. Short positioning on a bearish reversal at the $1.3394 to $1.3400 zone, $1.3530, or $1.3550 — with stops 1 pip above local swing highs — captures the layered resistance ahead.
The pattern of the rounded bottom above $1.3300 is the most interesting near-term technical feature. Rounded bottoms typically precede directional acceleration, and a clean break above $1.3400 with two consecutive hourly closes above the level and minimal upper wicks on the second candle would represent the kind of breakout signature that often produces meaningful follow-through. The risk is that the current structure resolves to the downside instead — a break beneath $1.3300 with conviction unlocks the deeper bear case that targets $1.3213 and $1.3100.
The UK Economy: Surprisingly Resilient Beneath the Political Chaos
Despite the political turbulence, the underlying U.K. economic data has been more resilient than the market has given it credit for. The International Monetary Fund recently upgraded its 2026 U.K. growth forecast to 1% from 0.8% previously — a modest but meaningful improvement against the backdrop of European peers struggling with stagnation. U.K. GDP expanded 0.6% quarter-on-quarter in the first quarter, accelerating from 0.2% in the prior period and matching consensus expectations. March GDP printed a 0.3% monthly increase despite the energy cost headwinds and inflation pressures.
Critically, the Q1 growth was broad-based. Services, manufacturing, and construction all contributed positively to the headline GDP print. That suggests the expansion was not solely driven by temporary factors or consumer spending distortions — the U.K. economy has genuine structural momentum despite the macro and political headwinds.
The IMF's warning attached to the upgrade is worth flagging: the U.K. remains particularly exposed to economic fallout from Middle East tensions and ongoing domestic uncertainty. That exposure is amplified by the country's reliance on imported energy. Elevated Brent crude prices and continued disruption around the Strait of Hormuz threaten to deepen inflationary pressures while simultaneously weakening consumer demand and business confidence. Against that backdrop, even constructive growth data can be overwhelmed by negative external shocks.
Read More
-
VOO ETF Rebounds to $689.80 Toward Its $699 Record as AI Chips Overpower the Iran Shock
09.07.2026 · TradingNEWS ArchiveStocks
-
XRP ETFs Lock Away 970M Tokens With $1.5B of Inflows While the Price Sleeps at $1.09 — The Coiled Spring
09.07.2026 · TradingNEWS ArchiveCrypto
-
Oil Fades to $72.65 WTI Even as the US Strikes Iran a Second Night — The Glut Answers the War Premium
09.07.2026 · TradingNEWS ArchiveCommodities
-
The Yen Sinks to a 40-Year Low Near 162.5 as the Iran Oil Shock Compounds the Widest Rate Gap in Years
09.07.2026 · TradingNEWS ArchiveForex
Sterling vs Other Major Pairs
To understand GBP/USD properly, the relative performance versus other dollar pairs matters. EUR/USD has been struggling near $1.1650, with the pair trading below the $1.174 pivot after rejecting the $1.178 area. The euro's weakness reflects similar dynamics to Sterling's — both currencies face challenging macro backdrops, energy import vulnerability, and political fragility relative to a U.S. dollar benefiting from higher yields and resilient growth.
Cable's relative performance versus the euro has been roughly in line. Both have lost ground to the dollar, but Sterling has held up slightly better than the euro on the trailing two-week basis because the BoE's relatively hawkish posture at 3.75% Bank Rate provides some yield differential support that the ECB cannot match. That said, the U.K. political risk is now meaningful enough that it is starting to overwhelm the yield differential advantage.
The USD/JPY pair has been pushing aggressively higher toward $160 on the back of the rising bond yield differential between U.S. Treasuries and JGBs. That move is the cleanest expression of the dollar's global strength right now, and it underscores why fading dollar rallies has been a losing trade across G10. As long as the DXY holds above $98.80 with the Treasury yield complex elevated, the structural bid in the dollar remains intact regardless of intraday noise.
Bull Case Invalidation: What Would Force Sterling Higher
For the constructive case on GBP/USD to convert from "tactical bounce" into a structural reversal, several conditions need to align. First, the $1.3400 resistance has to break with conviction on a daily closing basis. Two consecutive hourly closes above the level with minimal upper wicks on the second candle would represent the cleanest technical confirmation. Above $1.3400, the path opens toward $1.3450, $1.3500, and the prior swing high at $1.3550.
Second, the dollar side has to weaken. DXY needs to fail at the $99.33 resistance and reverse beneath $98.80, which would invalidate the broader U.S. dollar strength thesis and force the speculative dollar long positioning to unwind. The futures market is currently giving up on long dollar positions at the margin, but that capitulation has not yet been comprehensive.
Third, the U.K. political situation has to stabilize. If Starmer can survive the leadership challenge, or if Burnham emerges as a credible successor with a clearly articulated commitment to fiscal discipline, the gilt yield premium would compress and Sterling would catch a structural relief bid. The gilt market is pricing maximum fiscal risk right now, which means even modest political stabilization could trigger an outsized Sterling rally.
Fourth, the energy backdrop needs to cooperate. A meaningful Iran deal that reopens the Strait of Hormuz on a confirmed timeline would pull Brent back toward $90 or below, ease the imported inflation pressure on the U.K. economy, and remove one of the structural headwinds compressing Sterling.
Bear Case Invalidation: What Would Force Cable Lower
The bearish setup has its own clear invalidation triggers, and the levels are precisely mapped. A confirmed daily close beneath $1.3300 activates the rounded bottom failure scenario and likely produces fast acceleration through $1.3284 toward $1.3252 and then $1.3213. The deeper bear case targets $1.3100 if the broader $1.3213 to $1.3140 zone fails.
A second invalidation comes from the U.K. political side. If Starmer is forced out under disorderly circumstances — a leadership challenge that produces a contested succession or even a snap election — gilt yields would likely spike further, the Pound would face additional selling pressure, and GBPUSD could test the $1.3000 round-number psychological level that has not been seriously challenged since late 2024.
A third invalidation comes from the U.S. side. If Wednesday's FOMC minutes reveal a more hawkish committee than the market is currently pricing — particularly any meaningful discussion of accelerated tapering of the Fed's holdings or active consideration of rate hikes — Treasury yields likely push toward 4.75% to 5%, the dollar accelerates higher, and Cable faces the same structural pressure that has dragged EUR/USD beneath $1.18 toward $1.16.
A fourth invalidation comes from the energy side. If Brent breaks back above $115 with confirmation and the inverse-correlation dynamic between crude and risk currencies reasserts itself, Sterling faces meaningful pressure as the U.K.'s imported inflation impact gets repriced.
Positioning and Sentiment
The Commitment of Traders data and futures positioning have been net negative for Sterling over the past three weeks. Speculative positioning is moderately short, which historically creates the foundation for short-squeeze rallies on positive catalysts. The fact that the futures market is "busy giving up on long USD positions" at the margin — as Societe Generale's Kit Juckes has flagged in similar setups across the G10 complex — suggests that the dollar's structural overhang from speculative positioning is real, and that overhang provides some natural ceiling on how far Cable can decline.
UK CFTC futures data shows traders have been adding to bearish Sterling positioning through May, which aligns with the political and gilt market dynamics. That positioning structure is exactly the kind that produces sharp counter-trend rallies when surprises favor the Pound — and the Wednesday CPI print is precisely the kind of asymmetric catalyst that could produce that surprise.
The Traders Union desk's expert framing from Viktoras Karapetjanc is instructive: "Clearer macro fundamentals offer Sterling a stronger foundation, but buyers need to defend $1.3300 for optimism to persist." That captures the operative tension perfectly. The downside is well-defined and limited unless $1.3300 fails. The upside requires a meaningful catalyst to break the $1.3400 resistance complex.
Why Sterling Is Vulnerable to External Shocks
The structural reality the British Pound has to contend with is the U.K. economy's particular vulnerability to external shocks. Britain imports a disproportionate share of its energy needs, which means Brent at $110-plus translates directly into rising U.K. consumer price inflation and squeezed disposable income. The current account balance is structurally negative, which means Sterling weakness compounds the imported inflation problem by raising the local-currency cost of essential imports.
The Bank of England is in a difficult position. With UK inflation expected to average roughly 3.2% in 2026 — well above the 2% target — the central bank cannot ease policy aggressively even as economic activity softens. The signal that "additional tightening could be on the horizon depending upon conditions from inflation outlook" reflects the genuine constraint. That constraint normally would be Sterling-positive, but combined with rising gilt yields creating fiscal pressure and political uncertainty creating risk premium, the net effect on the Pound has been negative.
Compare this to the U.S. backdrop. Resilient consumer spending, strong economic activity, and a Fed that can credibly maintain a hawkish stance because the underlying economy can absorb it — all of those factors support the dollar's structural advantage. The yield differential currently favors the dollar, the growth differential favors the dollar, and the political stability differential favors the dollar. Three out of three on the fundamental scorecard means GBP/USD has a structural drag that requires unusual catalysts to overcome.
Where Cable Actually Sits Right Now
GBP/USD (Cable) at $1.3375 is sitting at a meaningful inflection point that defines whether this week resolves as a tactical bounce inside a bearish daily structure or the start of a deeper breakdown. The short-term technical setup has been brutally clear for the past two weeks — lower highs on the daily chart, price below all major moving averages, RSI in the 35 to 37 oversold-but-not-extreme zone, and the round-number support at $1.3300 acting as the operative line between consolidation and continuation lower.
The tactical setup over the next 48 hours is genuinely binary. The rounded bottom pattern that has formed above $1.3300 is constructive at the margin and points toward an attempt to reclaim $1.3400. Whether that attempt produces a clean breakout above $1.3400 with conviction, or whether the pair rejects from $1.3394 to $1.3400 and resumes the broader downtrend, will be decided by Wednesday's CPI and FOMC minutes prints. The trade setup at this moment is essentially a coiled spring waiting for catalyst confirmation.
The medium-term picture remains skewed negative. The combination of U.K. political uncertainty, gilt yields at sub-prime crisis levels, hot U.S. inflation, the 10-year Treasury yield at one-year highs, the DXY breaking above $99.00 toward $99.66 Fibonacci targets, and Brent crude at $110-plus creating imported inflation pressure on the U.K. economy all align to keep the path of least resistance lower. The structural targets at $1.3213 and $1.3100 remain in play unless the $1.3300 support holds and the catalysts cooperate.
The longer-term picture is more nuanced. GBPUSD is essentially the same price now that the euro was when it was introduced in 1999, adjusted for the trading range that has defined Sterling for the past two decades. The pair is structurally trapped between roughly $1.20 on the deep downside and $1.43 on the deep upside. The 3.68% three-month positive return and the 0.35% twelve-month positive return capture that long-duration sideways grind. Without a true regime change in either central bank or fiscal policy, the structural ceiling remains in place.
The single most important level over the next five trading sessions is $1.3300 on a daily closing basis. Hold that line, and the rounded bottom thesis stays alive, the Wednesday CPI catalyst can trigger a meaningful counter-trend rally toward $1.3400 and potentially $1.3450, and Sterling has room to breathe. Lose $1.3300, and the conversation shifts to whether $1.3213 holds, with the deeper $1.3100 to $1.3140 zone becoming the next destination if the broader support shelf fails.
The dollar side is doing more work than the Sterling side right now. The U.S. macro setup — hot inflation, rising yields, hawkish Fed expectations, resilient growth — is the dominant driver. U.K.-specific factors like the gilt yield spike and the Starmer political crisis amplify the trend but do not create it independently. Until the U.S. inflation cycle peaks and the Fed has cover to consider easing again, Cable faces a structurally negative bias that requires patience to fade.
The decisive read for the next 96 hours: Cable is bearish below $1.3400 with downside targets at $1.3300 first and $1.3213 second. A confirmed break above $1.3400 with two hourly closes flips the bias to neutral with upside potential toward $1.3450 and $1.3500. The Wednesday CPI and FOMC minutes prints are the catalysts that resolve which side wins. Trade the levels, respect the round-number support at $1.3300, and let the data tell the story.