Oil Price Forecast: Brent Crude (BZ=F) Pinned at $110 After Touching $112 as Trump's Iran Ultimatum
WTI (CL=F) trades at $105 after intraday reversal from $108 on Tasnim sanctions waiver report | That's TradingNEWS
Key Points
- Brent crude (BZ=F) trades at $110.08, up 67% YoY from $65, after touching $112 on Trump's Iran ultimatum.
- Global oil inventories down 250M barrels since Feb 28; 13M b/d Middle East production offline as Hormuz closed.
- Brent (BZ=F) support at $108 then $100; resistance $112-$125; Goldman forecasts $90 year-end vs $66 prewar.
Brent crude (BZ=F) is trading at $110.08 in the New York session Monday after touching $112 earlier in the day, with the violent reversal lower coming on the back of an Iranian news agency report that the U.S. had accepted a temporary waiver on sanctions during ongoing negotiations. The single-day decline from $112.60 yesterday morning to current levels represents a 2.23% pullback, but the bigger picture remains unambiguous: bullion crude is up 18.03% on the month versus $93.27 one month ago, and up an extraordinary 67.14% year-over-year against $65.86 on this date in 2025. That $44 absolute price increase over twelve months is the structural shift that defines the entire trading environment.
West Texas Intermediate (CL=F) has been bouncing between the $101 and $108 zones across the past five sessions, the lower end touched after the Tasnim News Agency report and the upper end reached during the run-up to Trump's "clock is ticking" Truth Social post. That intraday volatility — moves of $4 to $7 a barrel inside a single session — is the cleanest expression of how thin the marginal supply-demand balance has become and how violently the futures market is repricing every Iran headline that hits the wire.
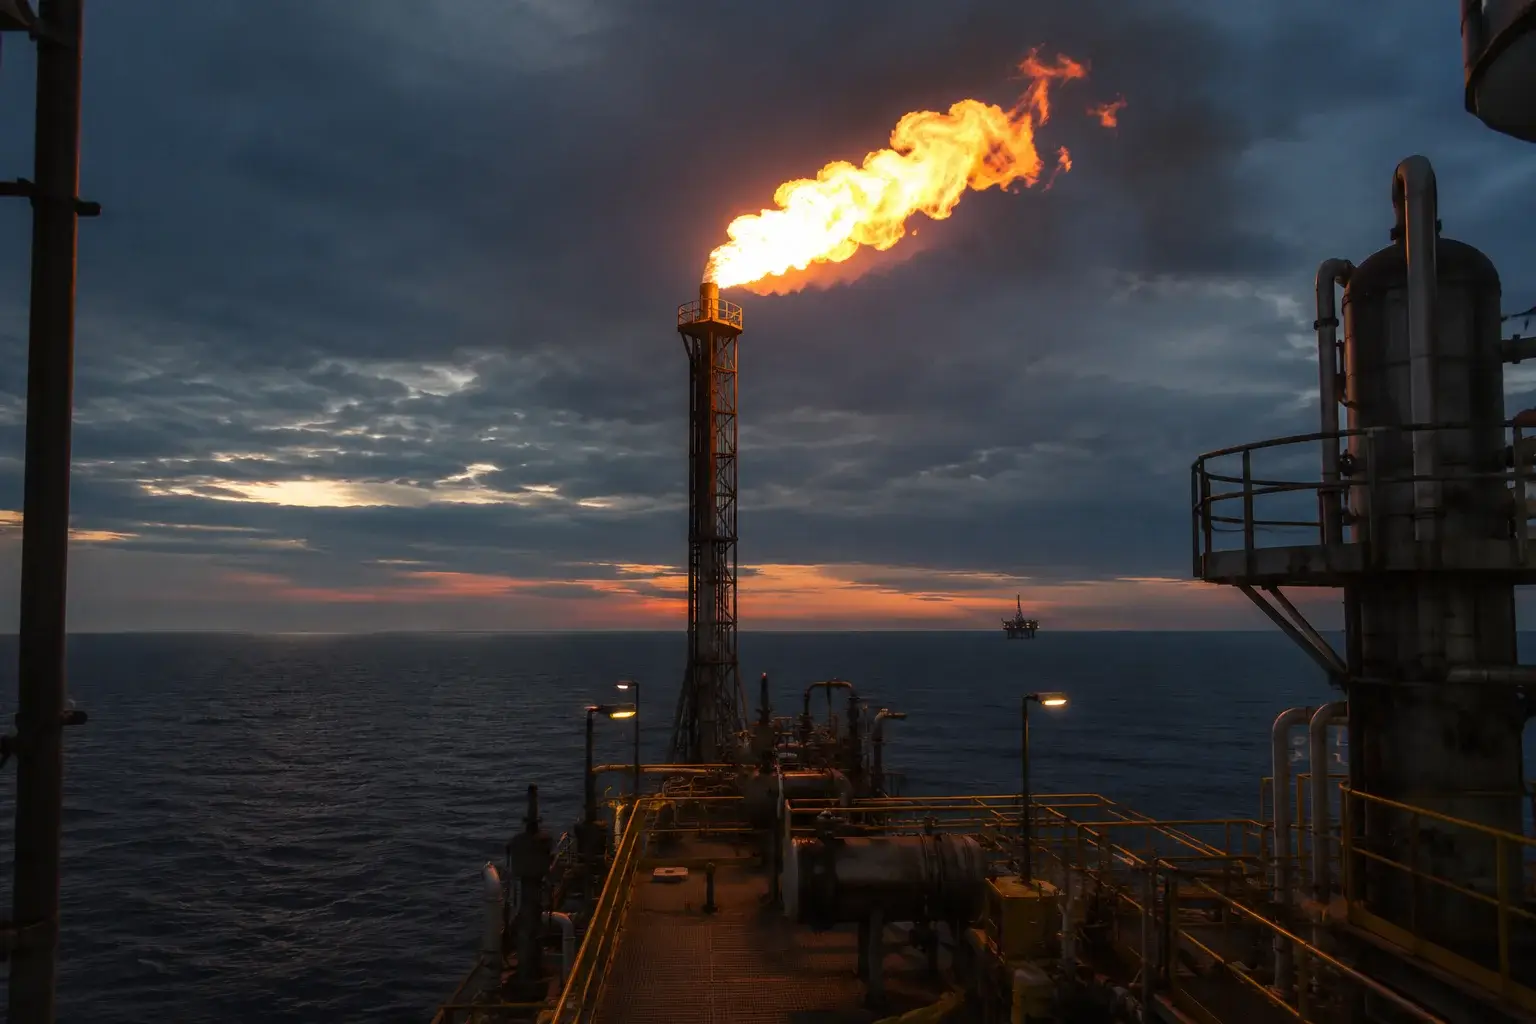
The geopolitical clock matters more than any other variable on the screen right now. The Iran war is in its eleventh week. The Strait of Hormuz remains effectively closed. Roughly 20% of global oil and LNG flows pass through that narrow shipping route in normal operating conditions. Until that waterway reopens — or until the market believes it will reopen on a definite timeline — Brent at $100-plus is the structural baseline rather than a temporary spike.
The Tasnim Reversal: Why a Single Headline Knocked $4 Off WTI
The most telling intraday event Monday was the speed with which a single wire from Tehran reversed a multi-day rally. Brent had been on a four-day uptrend pushing toward $112 on the back of Trump's escalating rhetoric, Iran's continued refusal to accept U.S. demands, and weekend headlines about the drone strike on the Barakah nuclear power plant in the United Arab Emirates. Then Iran's Tasnim News Agency reported that Washington had accepted a temporary lifting of sanctions during the negotiation period. The reaction was immediate and severe.
WTI cascaded from $107.71 toward $101.18 — a roughly 4% intraday move that wiped out the entire weekend bid in a matter of hours. Brent retraced from $111.34 to around $110. Iranian Foreign Ministry spokesperson Esmaeil Baqaei subsequently confirmed that talks remain ongoing through Pakistani mediation. Those incremental constructive signals did not produce a deal — they produced a brief unwind of the war-premium pricing that had built up across the weekend.
The price action is the signature of a market that is now trading every headline with maximum convexity. That kind of volatility regime — daily ATR readings on Brent above $3 and intraday swings exceeding $5 — punishes late entries in both directions and rewards only patient positioning at the structural levels.
Trump's Ultimatum and the Tuesday National Security Meeting
The president's "clock is ticking" Truth Social post Sunday — combined with the warning that "TIME IS OF THE ESSENCE" and Iran "better get moving, FAST, or there won't be anything left of them" — represents the most hawkish public rhetoric since the conflict began. Trump separately labeled Iran's most recent peace proposal "totally unacceptable" last week and described the ceasefire architecture as being on "massive life support." According to Axios, Trump is scheduled to hold a Tuesday meeting with his top national security advisers to discuss options for military action against Iran.
That meeting is the single most important calendar event in the energy market over the next 48 hours. If the readout from the meeting suggests escalation — direct strikes, expanded naval blockade, secondary sanctions enforcement — the oil price reaction is mechanically higher, with Brent likely punching through $112 and testing the $115 level that several analyst desks have flagged as the gateway to the $120 to $125 escalation scenario. If the readout suggests de-escalation, the Tasnim sanctions waiver becomes the operative framework and Brent likely consolidates in the $105 to $110 range while peace negotiations restart.
The Barakah Strike: Why the UAE Drone Attack Changed the Math
The drone attack on the Barakah nuclear power plant in Abu Dhabi over the weekend is the single most consequential single event of the war to date in terms of redefining risk parameters. Three drones entered the UAE from the western border. Two were intercepted. The third struck an electrical generator outside the inner perimeter of the plant, sparking a fire. There were no injuries and no radiological impact, but the strategic implications are severe.
This is the first time in the conflict that hostile forces have successfully targeted Gulf nuclear infrastructure. The UAE defense ministry called it a "dangerous escalation." Intelligence analysts believe Iranian-backed proxy groups were responsible, viewing the strike as a calculated test of U.S. and Gulf ally resolve. The targeted nature of the attack on a civilian nuclear facility crossed established geopolitical red lines and dramatically increased the probability of direct military confrontation in the energy corridor.
For the oil market, the Barakah strike is the structural reason why the war-premium pricing has stuck above $100 even on de-escalation headlines. The marginal trader now has to price in not just the closure of the Strait of Hormuz but the potential for direct attacks on Gulf production infrastructure — refineries, export terminals, nuclear facilities. That risk premium does not unwind on a single Tasnim headline. It unwinds on a comprehensive, verifiable peace agreement that includes the reopening of Hormuz and security guarantees for Gulf energy assets.
The Inventory Draw: Global Stocks Down 250 Million Barrels
The supply-side numbers underneath the headlines are the most important data points in the entire commodity complex right now. The IEA's latest Oil Market Report shows global crude and refined product inventories fell at a rate of nearly 4 million barrels per day in April alone. That single-month draw rate is equivalent to the combined daily oil consumption of the United Kingdom and Germany. Cumulatively, global oil inventories have dropped by nearly 250 million barrels since the war began in late February.
To put that 250 million barrel draw in context: it represents roughly two and a half days of global oil consumption being pulled out of strategic and commercial inventories. That is one of the largest sustained inventory draws in recorded history outside of acute supply shocks like the 1979 Iranian Revolution and the 1990 Gulf War. Continued draws at the April pace through summer would push commercial inventories in OECD countries to multi-decade lows by August, at which point the physical market would face genuine rationing conditions.
According to Kerstin Hottner, head of commodities at Vontobel, roughly 13 million barrels per day of Middle Eastern production is currently offline. That is a staggering figure — equivalent to the combined output of Russia and the United States during the 2020 supply crisis. Coordinated strategic petroleum reserve releases from major consumer governments and elevated starting inventories in Europe have prevented outright scarcity in the developed world, but Asia is already showing physical signs of stress. Vietnam, Pakistan, and Bangladesh are dealing with active physical shortages, with refineries unable to source enough cargoes to meet domestic demand. Those shortages have not yet spread to Europe or North America, but the timeline for that contagion is measured in weeks rather than months if the Strait stays closed.
Demand Destruction Has Started
Independent commodities analyst Maurizio Mazziero has flagged that early signs of demand destruction are now visible. The IEA forecast revisions show global oil demand contracting by 420 thousand barrels per day year-over-year in 2026 — 1.3 million barrels per day below the prewar forecast. The petrochemical and aviation sectors are absorbing the bulk of the demand hit. Air travel is the cleanest read, with carriers like Ryanair publicly flagging that fuel cost spikes are pressuring profitability.
Ryanair's full-year results released Monday underline the dynamic. The Irish carrier reported profit of €2.26 billion, up from €1.6 billion last year, with sales rising 11% to €15.5 billion. The company has hedged 80% of its jet fuel for the months ahead — a deliberate choice that has protected the bulk of operating margins. But the remaining 20% is being priced at spot, and management explicitly cited the Middle East conflict as causing a "spike" in those costs. Across the broader industry, IATA has warned that higher European air fares are "inevitable" given the persistence of elevated jet fuel prices.
Demand destruction creates a feedback loop that the market is only beginning to internalize. Higher prices reduce demand, which slows the inventory draw, which moderates upward price pressure, which limits further demand destruction. The question is whether the equilibrium price clears at $100, $120, or $150. Vontobel's Hottner argues that an explosive move toward $150 or higher would be accompanied by a much more severe collapse in demand and widespread global rationing — meaning the upper bound on Brent is structurally capped by the price level at which demand collapse becomes unavoidable.
Brent (BZ=F) Technical Structure: $108 Support, $112-$115 Resistance
The chart structure on Brent crude (BZ=F) has been one of the cleanest setups in the commodity complex. The pre-war trading range from $70 to $85 has been completely abandoned. Brent broke above $100 in mid-March and has held that line ever since, with the $100 level now acting as critical structural support rather than resistance. The peak of the conflict cycle so far was the brief move north of $120 — that level represents the operative ceiling unless the conflict materially escalates from current parameters.
The immediate support shelf is $108 to $110, which is roughly where the market has been pivoting throughout May. A clean daily close beneath $108 would expose the $105 level and then the $100 psychological line. Below $100, the bear case targets $95 to $90 — Goldman Sachs's year-end forecast range — but those levels likely require a comprehensive peace deal that reopens Hormuz on a confirmed timeline.
The upside structure is the more interesting part of the chart. Resistance at $112 has been tested multiple times and held. A confirmed daily close above $112 opens the path toward $115, and beyond that the $120 to $125 zone where the Vontobel and Schroders desks see Brent settling if the Hormuz blockade extends. Above $125, the market would be pricing in the escalation scenario, with eventual targets at $130 and the prior conflict-cycle high.
The momentum picture is broadly constructive for the bullish case. RSI on the daily timeframe is elevated but not yet at extreme overbought readings that historically mark exhaustion tops. The MACD remains in positive territory. The 50-day moving average is curving higher and providing dynamic support beneath price. The weekly chart shows a clear higher-highs-and-higher-lows structure in place since the March breakout — that structure invalidates only on a sustained weekly close beneath $100.
WTI (CL=F) Lags Brent: The Transatlantic Spread Story
WTI crude (CL=F) has been tracking the same broad direction as Brent but with consistent underperformance — the Brent-WTI spread has widened to roughly $5 to $7 a barrel through the conflict cycle. That widening reflects two structural factors. First, the U.S. is a net energy exporter and is less exposed to Hormuz disruption than European and Asian markets. Second, U.S. domestic production continues to fill the marginal supply gap that European refiners have to source from elsewhere.
The current WTI trading range of $101 to $108 represents the same structural shift visible in Brent — pre-war prices in the $60 to $75 range have been completely abandoned and replaced with a new equilibrium that prices the war premium into every barrel. A break of $100 in WTI on a daily closing basis would be the cleanest bearish signal in the entire complex, and it would likely require both a confirmed Iran de-escalation and a meaningful return of OPEC+ supply. Neither catalyst is currently visible.
The technical resistance for WTI sits at $108, where price was rejected last week, and then $110, which was the conflict-cycle high before this week's Brent move toward $112. Above $110, WTI has clean air on the chart back toward $115 and the prior cycle high. Below $100, the structural floor is at $95 and then $92, which corresponds roughly to Brent's $100 line in the cross.
Read More
-
SOXX Slides Toward $600 as an AI-Overbuild Scare Grips Semiconductors — Micron's Record Beat Couldn't Hold
02.07.2026 · TradingNEWS ArchiveStocks
-
XRP ETFs Keep Locking Away Supply as XRPR and XRPI Absorb Record Inflows — But the Overhang Swallows the Flows
02.07.2026 · TradingNEWS ArchiveCrypto
-
Henry Hub Slips From Its February High Toward $3.17 as Record Production Meets a Summer Heat Dome — December Futures Hold Above $4
02.07.2026 · TradingNEWS ArchiveCommodities
-
Dollar-Yen Clings to a 40-Year High Near 162.5 as the Carry Trade Overpowers Intervention Warnings
02.07.2026 · TradingNEWS ArchiveForex
The Three Scenarios That Define the Next 90 Days
The base case across institutional commodities desks is what Morningstar's framing labels the "controlled crisis" scenario. Brent stays between $100 and $120. The Strait of Hormuz remains partially disrupted. Diplomatic talks continue with intermittent progress and setbacks. Inventories keep drawing but coordinated strategic reserve releases prevent outright physical panic. ActivTrades' Ricardo Evangelista has framed this scenario as the dominant near-term path, with "diplomatic talks between the United States and Iran" remaining the main driver of intraday price movement. Vontobel's Hottner has been more specific: "As long as the Strait of Hormuz remains closed, I expect oil prices to gradually trend higher on a daily basis, potentially reaching $120 to $125 per barrel as inventories continue to decline."
The escalation scenario has Brent breaking above $125 and potentially reaching $130 to $140. This requires a direct widening of the conflict — attacks on energy infrastructure beyond Barakah, a prolonged total blockade of the Gulf, or U.S. military action against Iranian oil assets. Under that scenario, physical shortages would spread from Asia into Europe, governments would impose rationing, and demand destruction would accelerate. Hottner does not see an explosive move toward $150 because such levels would be accompanied by widespread global rationing — meaning the demand response acts as the natural upper bound.
The de-escalation scenario produces a sharp correction in price, with Brent retreating below $90 within two to three months following a credible ceasefire and full reopening of shipping lanes. Mazziero's framing is that even under that ceasefire scenario, prices would likely remain "well above prewar levels for at least six months" because restoring damaged facilities and clearing the shipping bottleneck cannot happen instantaneously. Goldman Sachs's baseline forecast falls into this third bucket, with normalization of Gulf energy exports by end-June and Brent edging down to $90 by year-end. That $90 forecast is meaningfully higher than the bank's pre-war $66 Q4 estimate, and even higher than the $71 revision from March.
The Long-Term Floor Has Shifted Higher
The most underappreciated structural takeaway is the consensus view that the war has permanently elevated the long-term floor for oil prices regardless of the immediate conflict resolution. Malcolm Melville at Schroders has been explicit: "Whatever the outcome of the conflict, we strongly believe that these events have raised the long-term floor for oil prices in all scenarios except one — the scenario in which Iran becomes a Western-oriented country — an outcome we consider unlikely."
The mechanism behind that elevated floor is multi-layered. First, the conflict has highlighted both the vulnerability of the global energy system and the lack of strategic reserves in many countries. Once the Strait reopens, governments and refiners are likely to rebuild strategic reserves aggressively to avoid future vulnerabilities — Vontobel's Hottner sees that restocking cycle as a major structural support for oil prices over the next 12 to 18 months. Second, the disruption to investment in new Middle Eastern production capacity creates a multi-year supply shortfall that will not be quickly filled even if peace returns. Third, the demand destruction visible in petrochemical and aviation sectors creates secondary effects in supply chain pricing that take time to unwind.
Pre-war Brent was trading between $70 and $85. The post-war floor is more likely to be in the $80 to $90 range, with a higher upside cap given how easily geopolitical shocks now transmit to prices. That is the structural reset that Goldman Sachs's $90 year-end forecast captures — prices come down from current levels but stay meaningfully elevated versus the regime that existed in 2024 and early 2025.
OPEC+ Dynamics and the Supply-Side Response
OPEC+ behavior through the conflict has been the second-most-important variable after the Strait of Hormuz status. The cartel has held production cuts in place to support prices, but compliance concerns and the obvious incentive to capture market share at $100-plus pricing have created internal tensions. Saudi Arabia and Russia have publicly maintained the discipline framework, but several smaller producers have been over-quota, accelerating the inventory draw rather than offsetting it.
The question for the back half of 2026 is whether OPEC+ formally unwinds the cuts to capitalize on elevated prices and address the genuine global supply shortage. Saudi Arabia has significant spare capacity that could be brought back online if the cartel decides to do so. Russia has continued exporting at near-full rates despite the lapsed waiver on Russian crude sales — the Trump administration's decision to let that waiver expire over the weekend was a structural negative for global supply, removing approximately 1 million barrels per day of formally tolerated Russian flow from the legitimate market.
U.S. shale production has been the silent counterweight. American producers have ramped output aggressively at $100-plus prices, with the rig count climbing throughout the second quarter. EIA data shows U.S. crude production approaching 14 million barrels per day, which is a record. That marginal supply is the reason the WTI-Brent spread has remained wide — domestic American demand is more efficiently satisfied at lower prices than European or Asian demand at the elevated international benchmark.
The Bond Market Reaction: Why Oil Is Now a Macro Asset
The transmission mechanism between oil prices and the broader macro environment has rarely been cleaner. The 10-year U.S. Treasury yield hit 4.63% intraday Monday — the highest level in more than a year — before fading back. The 30-year U.S. yield touched 5.159%. Japanese government bond yields hit multi-decade highs: the 30-year JGB reached a record 4.2%, and the 10-year JGB tagged 2.8%, the highest reading since October 1996. Eurozone yields rose at the open before fading as crude prices retreated.
The bond market is pricing the energy-driven inflation pass-through in real time. Higher crude prices feed into higher transportation costs, higher manufacturing input costs, and higher headline CPI. Higher CPI prints force central banks to maintain restrictive policy or even consider hiking. Higher policy rates compress the present value of long-duration assets across the board. Brent (BZ=F) at $110 with U.S. 10-year yields at 4.60% creates a self-reinforcing macro dynamic — until oil comes down meaningfully, yields can't come down meaningfully either.
ECB President Christine Lagarde captured the dynamic concisely when asked at the G7 finance ministers meeting in Paris whether she was worried about the global bond selloff: "I always worry, that's my job." That understated response reflects the genuine difficulty central banks face right now. They cannot ease policy with crude at $110 without risking inflation expectations becoming permanently de-anchored. They cannot tighten meaningfully without risking economic contraction. The result is a holding pattern that lets the bond market do the policy work — and the bond market has been brutally efficient about repricing yields higher.
Bull Case Invalidation: What Would Cap Crude
For the constructive case on Brent (BZ=F) to convert from "tactical $110 to $120" to "structural break toward $130-plus," several conditions need to align. First, the Strait of Hormuz needs to remain effectively closed for the medium term. A meaningful reopening would mechanically restore 5 to 7 million barrels per day of flow and trigger an immediate $10 to $15 correction.
Second, the inventory draw rate needs to remain near the April pace of nearly 4 million barrels per day. A slowdown in the draw rate — either through demand destruction, SPR releases, or supply increases — removes the structural underpinning for further price appreciation.
Third, OPEC+ needs to maintain production discipline. If Saudi Arabia decides to unwind the cuts to capitalize on elevated prices, the marginal supply hitting the market could cap further upside even with Hormuz closed.
Fourth, the geopolitical risk premium needs to stay priced. If U.S.-Iran negotiations produce a verifiable framework agreement — even one that doesn't fully resolve the conflict — the war premium would compress quickly and Brent could retrace toward $100 even without the Strait reopening immediately.
Bear Case Invalidation: What Forces Crude Even Higher
The bearish setup — a move back below $100 toward Goldman's $90 year-end target — has its own clear invalidation triggers. First, any direct attack on Gulf production facilities, refineries, or export terminals beyond the Barakah incident would push Brent through $115 and toward the $120 to $125 escalation zone. The Barakah strike has already established the precedent. Repetition would be priced violently.
Second, a U.S. military strike against Iranian targets — which Trump's Tuesday national security meeting reportedly contemplates — would mechanically push crude higher regardless of the eventual outcome. The initial reaction to a U.S. strike would likely be a $5 to $10 a barrel spike before stabilizing.
Third, a confirmation that the Russian waiver lapse has materially reduced legitimate Russian flow would tighten the supply balance further. The Trump administration's decision to let the waiver expire was a structural negative for supply, but the actual flow impact remains uncertain.
Fourth, any sustained physical shortage spreading from Asia into Europe would trigger panic buying and inventory hoarding by major consumer governments. Once that dynamic begins, prices can move very quickly higher as competing buyers chase scarce cargoes.
The Refinery Demand Picture
The downstream side of the oil complex deserves attention. Refinery utilization rates have been elevated across the developed world as operators chase the strong crack spreads created by the structural disruption. Crack spreads — the margin between crude oil costs and refined product prices — have widened meaningfully through the conflict, particularly for gasoline and jet fuel. Refiners are running at peak capacity but cannot fully offset the inventory draw because crude supply is the binding constraint, not refining capacity.
Distillate inventories — diesel and heating oil — are particularly tight given the war's seasonal timing. Asian markets have been most affected because they typically source crude from the Gulf, but the spillover effect into European distillate markets has been visible in the price differential between heating oil futures and crude. Going into summer driving season in the Northern Hemisphere, gasoline demand is expected to remain robust even with elevated prices, which provides a fundamental demand backstop for crude.
Positioning and Hedge Fund Flow
Speculative positioning in WTI and Brent futures has been net long throughout the conflict cycle, with hedge fund and CTA positioning building meaningfully since March. The Commodity Futures Trading Commission's Commitment of Traders report has shown managed money positioning at multi-month highs. That concentration creates the risk of position-driven liquidation if the market gets a meaningful peace headline — but the structural supply-demand backdrop suggests any liquidation cascade would find buyers quickly given the physical tightness.
The futures curve has been deeply backwardated, with front-month prices well above deferred contracts. That curve shape is the textbook signature of physical scarcity — buyers are willing to pay a premium for immediate delivery because they need barrels now, not in six months. As long as that backwardation persists, the structural bullish case remains intact regardless of intraday headline noise.
The Final Read: Where Crude Sits Right Now
Brent crude (BZ=F) at $110.08 is sitting at the structural midpoint of the post-war trading range. The tactical setup remains bullish while price holds above $108 — the inventory draw rate, the continued Hormuz closure, the Barakah escalation precedent, the OPEC+ discipline, the rebuilt strategic reserve demand that will follow any reopening, and the long-term floor reset across institutional commodities desks all align to support prices well above prewar levels. The first downside target on a confirmed break of $108 is $105, and beyond that the $100 psychological line that has held throughout May.
The medium-term picture is dominated by the controlled-crisis scenario. Brent likely chops between $100 and $120 through the summer months while diplomatic talks continue intermittently and inventories keep drawing. The escalation scenario — Brent above $125 — gets unlocked by direct U.S. military action against Iran or further attacks on Gulf infrastructure. The de-escalation scenario — Brent back toward $90 — requires a comprehensive peace agreement that reopens Hormuz on a confirmed timeline and is verified by physical shipping returning to normal patterns.
The strategic 12-to-18-month picture favors elevated prices regardless of which scenario plays out. Goldman Sachs's $90 year-end forecast captures the path lower from current levels even under the constructive scenario. Vontobel's restocking-cycle thesis points to a structural support that lifts prices even after the immediate disruption resolves. Schroders' framing that the long-term floor has been permanently raised aligns with the broader institutional consensus that pre-war prices in the $70 to $85 range have been replaced with a new equilibrium near $85 to $95.
WTI (CL=F) at $101 to $108 follows the same structural narrative with U.S.-specific factors moderating the upside — domestic shale production at record levels, lower exposure to Hormuz disruption, and a wider Brent-WTI spread that reflects the marginal arbitrage. The technical floor in WTI is $100. The ceiling is $112 to $115. Until one of those levels breaks decisively, the consolidation pattern dominates.
The single most important calendar event over the next 48 hours is Trump's Tuesday meeting with national security advisers. The single most important macro variable over the next two weeks is whether physical shortages spread from Vietnam, Pakistan, and Bangladesh into more developed markets. The single most important price level to watch is $108 on Brent and $100 on WTI — both define the line between the controlled-crisis baseline and the de-escalation scenario.
Rystad Energy's Claudio Galimberti has summarized the situation as starkly as anyone has dared: "We are approaching a summer of pain, I am afraid, unless Hormuz is opened." That framing is the operative consensus across institutional commodities desks. The pain is being inflicted through the price mechanism — higher fuel costs, sticky inflation, rising bond yields, compressed risk-asset valuations — and the only way out is through the Strait reopening or the war ending. Neither catalyst is visible on a confirmed timeline. Until that changes, Brent at $110 and WTI at $105 is the structural baseline that the market has to live with.