





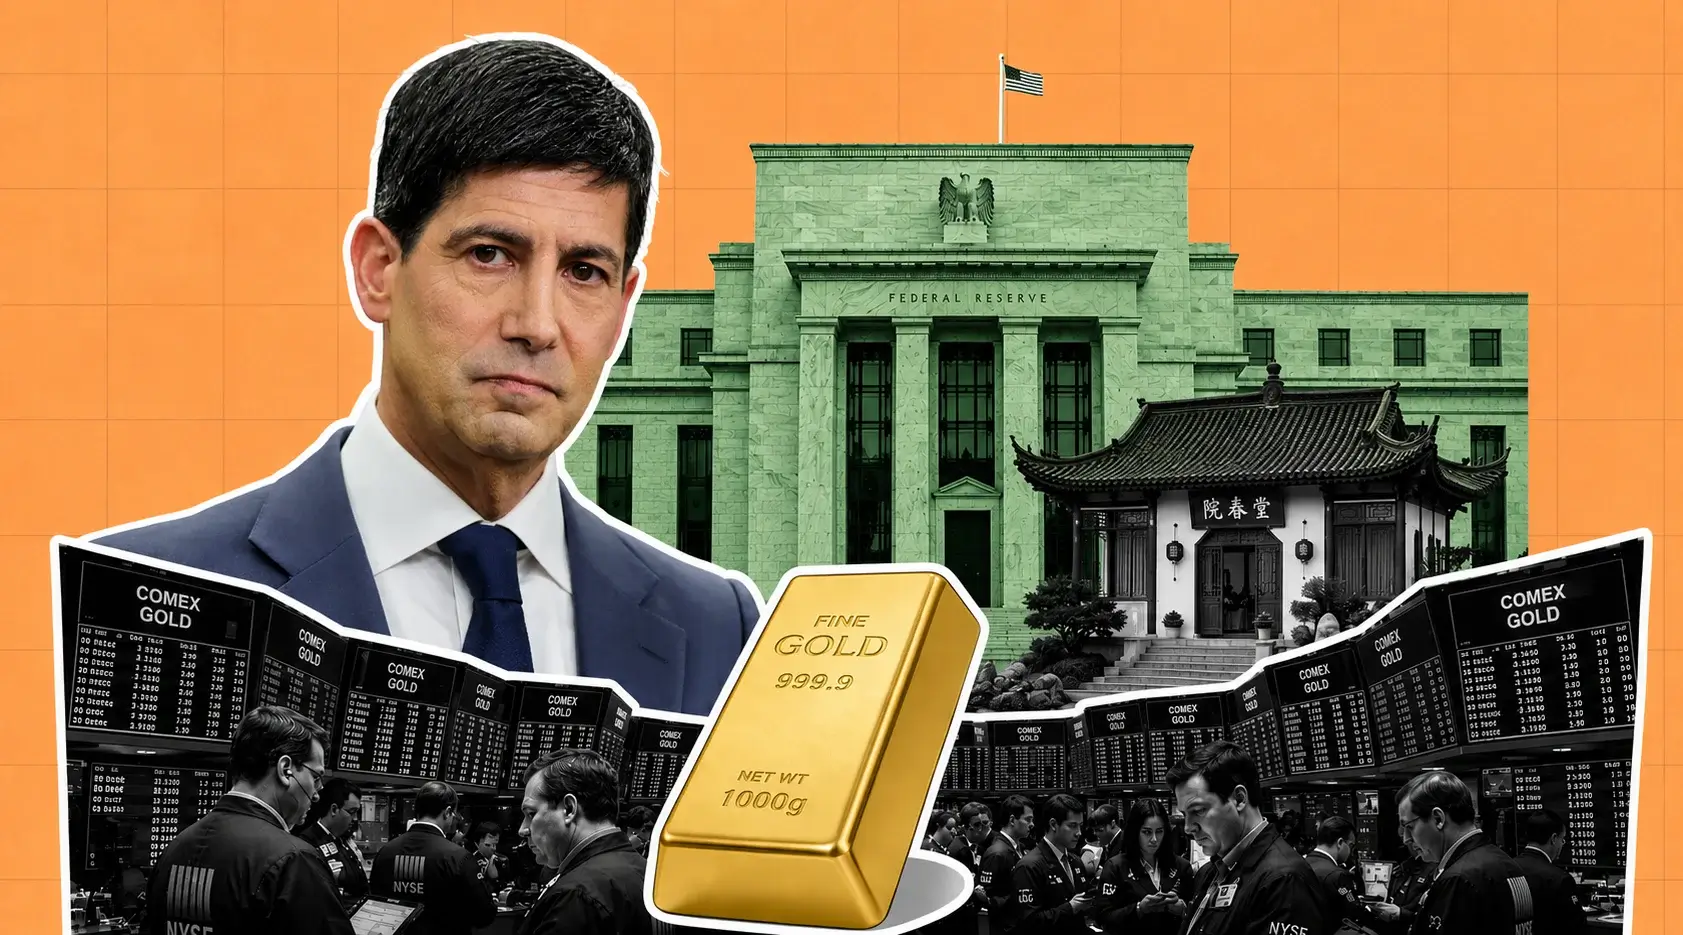
Gold Breaks $4,365 Support as Warsh Drives Hike Bets to 70% — 10.33% Upside to $4,800
Bullion gave back its entire 2026 gain in five sessions despite Brent at $96.59 and an active Persian Gulf war | That's TradingNEWS
Key Points
- Gold futures traded $4,412.20 after a $4,355 low; spot XAU/USD sits at $4,350.48, down 5.25% on the week.
- September Fed hike odds jumped from 36% to roughly 70% as the 10-year yield hit 4.814%, a six-session run.
- Gold ETFs took in 70 tonnes across July and August, but 298 tonnes of fund inventory remains underwater.
Gold futures traded $4,412.20 on Wednesday, September 2, up $15.80 or 0.36%, after an overnight session that dragged the contract down to $4,356.40 for a loss of $40.00, or 0.91%. The recovery extended through the New York morning to $4,418.00 (+$21.60, +0.49%) and then $4,424.70 (+$28.30, +0.64%). Early trading had printed $4,355 an ounce, down 0.94%. From that low to the morning high, the contract covered $69.70 — a 1.60% range before U.S. equities had been open two hours.
Spot XAU/USD tells a harsher story. The pair changed hands at $4,350.48 against a previous close of $4,449.19, a $98.71 decline representing 2.22%. The bid sat at $4,352.65 and the ask at $4,352.99. Tuesday's session closed spot near $4,325 to $4,358.74, down between 1.86% and 2.86% depending on the settlement reference, and marked the lowest level since August 19.
The performance table frames the damage precisely: down 1.74% on the day, down 5.25% on the week, up 6.70% on the month, up 0.97% year to date, up 27.16% over twelve months. Gold has given back nearly the entire calendar year in the space of three sessions.
The all-time high of $5,602.23 was set on January 29, 2026. At $4,412.20, gold trades 21.24% below that peak. The 52-week range runs $3,579.72 to $5,602.23, which places current price 23.3% above the floor and 21.2% under the ceiling — almost exactly the midpoint of a $2,022 band.
The thesis driving this forecast is uncomfortable for bulls and unavoidable: gold is not trading its own fundamentals right now. It is trading the U.S. front-end rate curve. Every structural argument for the metal — central bank accumulation, sovereign debt stress, an active Persian Gulf war, oil at $96 — is currently intact and currently irrelevant. What matters is that the 10-year Treasury yield has advanced for six consecutive sessions to 4.81%, and until that stops, the $4,365 to $4,445 band overhead is a ceiling, not a launch pad.
Six Straight Days Of Rising Yields Is The Whole Problem
The benchmark 10-year U.S. Treasury yield advanced for a sixth consecutive session on Wednesday, trading around 4.81% and hitting an intraday high of 4.814%, its highest level since late 2023. The 30-year sat at 5.27%. The 2-year climbed to 4.369% on Tuesday, its highest settlement in 19 months.
Rising yields and expectations of higher policy rates weigh directly on a non-yielding metal. That is the entire mechanism, and it is currently overpowering the support gold would normally draw from heightened inflation and escalating geopolitical risk — the two conditions the metal exists to hedge.
The global bond picture explains why the pressure has been so relentless. The 10-year Japanese government bond yield crossed 3% to hit a 30-year high after the Bank of Japan governor confirmed Tuesday the central bank will keep raising rates. The German Bund reached 3.364%, unseen since 2011. The 10-year gilt hit 5.255%, the highest since 2008, with the 30-year gilt at levels last seen in 1998. Yields in France also climbed.
That configuration removes the marginal buyer of duration globally. For thirty years, Japanese institutions exported savings into foreign sovereign debt because domestic yields were pinned near zero. At 3% on the JGB, that flow reverses. Every developed government is now issuing into a market with less price-insensitive demand than it had a month ago, and the long end is steepening rather than flattening as a result.
The comparison that isolates gold's problem: on August 19, the U.S. Treasury unexpectedly announced it would ramp up buybacks of long-dated government debt, doubling the maximum from $2 billion to $4 billion per operation. The 30-year yield, which had spiked to 5.337% — its highest since 2007 — fell 8 to 10 basis points on the news. Gold surged more than 4% that day, its biggest single-session gain in six months, and traded above $4,500.
That is the cleanest available proof of the relationship. Yields down, gold up 4%. Yields up for six straight sessions, gold down 5.25% on the week. The metal is currently a pure inverse-duration instrument, and the Treasury's daily curve is the only chart that matters.
Warsh Reset The Odds From 36% To 70% In Five Sessions
Federal Reserve Chairman Kevin Warsh delivered his first Jackson Hole keynote on Friday, August 28, and repriced gold more violently than any data release this year.
He said the Fed would "have work to do" without clearer evidence that inflation is returning to the 2% target, and that the summer's improved readings did not tell him underlying trends had meaningfully changed. The central bank's preferred inflation gauge sits at 3.7%, nearly double target.
Bullion fell more than 3% that session, its biggest one-day drop since June 10.
The repricing has compounded every session since. CME FedWatch odds of a 25-basis-point September hike moved from roughly 36% before the speech to just over 60% by Monday, to more than 65% by Tuesday, and to approximately 70% by Wednesday morning. One reading placed the probability of a move to a 3.75%-4.00% target range at 59.9%. That is a 34-point swing in the market's assessment of Fed direction inside five trading days, and gold has surrendered $237 of spot price across the same window.
The supporting cast reinforced it. Boston Fed President Susan Collins articulated a lower bar for hikes than she previously had, a shift from the June FOMC meeting when she penciled in no change through year-end. Kansas City Fed President Jeff Schmid and Cleveland Fed President Beth Hammack both doubled down on hawkish stances.
The context for how fast this flipped: two weeks before Jackson Hole, the consensus view held that the Fed would keep the target range at 3.50%-3.75% through the remainder of 2026, with any cuts deferred to 2027. A fully priced 25-basis-point hike had been pushed out to January 2027. Gold was trading above $4,500 on that assumption.
The September 15-16 FOMC meeting now carries a coin-flip-plus probability of the first hike of this cycle. For a zero-coupon asset with storage costs, that is the single most bearish input available. Keeping borrowing costs unchanged or raising them further caps upside directly, and the market has spent five sessions pricing exactly that.
The 100-Day SMA At $4,365 Is Now Overhead Resistance
The daily technical structure turned bearish in the last week of August and has not repaired.
XAU/USD holds beneath both the 100-day simple moving average around $4,365 and the 20-day Bollinger middle band near $4,445. Two overlapping dynamic barriers are capping every rally attempt, and spot at $4,350.48 sits $14.52 under the first of them and $94.52 under the second.
The Relative Strength Index reads 46.28, just below the neutral midpoint. That reading is doing something specific: it indicates waning downside momentum without signaling a convincing recovery. Gold is not oversold. There is no mechanical bounce embedded in the momentum picture, which means any recovery has to be bought rather than squeezed.
The resistance sequence from current spot runs $4,365 (100-day SMA, +0.33%), $4,445 (Bollinger middle band, +2.17%), and $4,695 (upper Bollinger band, +7.92%). Reclaiming $4,365 on a daily close is the minimum requirement to argue the correction has ended. Reclaiming $4,445 restores the intermediate uptrend. Until both go, rallies are sales.
The pivot sits at $4,315.60, $34.88 below spot — the first level where the structure meaningfully breaks. Below that, the September projection range extends to $4,136.00, a 4.93% drawdown from spot and 6.26% from the futures print.
Technical rating services currently score gold a sell on the immediate horizon, neutral on the one-week outlook, and buy on the one-month view. That split is honest: the short-term tape is broken, the medium-term structure is not.
Futures at $4,412.20 sit $61.72 above spot, a contango spread that reflects carry costs at a 3.50%-3.75% policy rate. That spread widens if the Fed hikes, which mechanically pressures the spot-futures relationship further.
The single most important line on the chart is $4,365. Gold spent August above it. It has spent September below it. That transition is what changed the trade.
A 38,000 ADP Print Should Have Rescued Gold And Did Not
Wednesday delivered the cleanest test available of whether soft labor data can still lift bullion. The result was decisive.
ADP's National Employment Report showed private-sector employment up 38,000 in August against a 47,000 consensus — the slowest month since January. July was revised up to 46,000 from 44,000. The internals were considerably weaker than the headline. Goods-producing industries lost 10,000 jobs outright, with manufacturing shedding 17,000 and natural resources and mining down 5,000, partly offset by 12,000 in construction. Service-providing industries added 48,000, but education and health services alone contributed 45,000 of that, with leisure and hospitality at 16,000. Professional and business services shed 16,000. Trade, transportation and utilities lost 5,000.
Remove health care and hospitality and the U.S. private sector shed jobs last month.
Gold futures traded $4,355 before the 8:15 a.m. ET release and $4,412.20 through the mid-morning. That $57 recovery reads as a bounce off an oversold overnight low rather than a data-driven repricing, because hike odds did not move materially and the 10-year did not retreat from 4.81%.
Wage data explains the indifference. Median base pay rose 3.2% and gross pay 4.7% year over year for all workers. Job-stayers saw base pay up 3.0% and gross pay up 4.4%. Job-changers registered 4.7% and 7.3%. Compensation growing above 4% while the Fed's preferred gauge sits at 3.7% describes a labor market that is soft on quantity and hot on price — precisely the combination that keeps a hawkish committee hawkish.
Friday's nonfarm payrolls report carries a +53,000 consensus after July's -23,000, with private payrolls expected near 45,000. Unemployment stands at 4.1%, with 1.05 job openings per unemployed person in July.
For gold, Friday is binary. A print well under 53,000 pulls hike odds back toward 40%, drops the 10-year through 4.70%, and puts $4,445 in play within days. A print at or above consensus locks the September hike and sends spot toward $4,136.
Read More
-
Yen Stalls at 160 Despite a 3% JGB and Tokyo Core CPI at 2.0% — Intervention Sits at 164, Friday's Payrolls Decide
02.09.2026 · TradingNEWS ArchiveEnergy
-
QQQ ETF ($706.22) Slides 7.4% Below Its High as the Market Reprices the AI Capex Bill — $686.57 Target if $700 Breaks
22.10.2026 · TradingNEWS ArchiveStocks
-
XRPI ($7.00) and XRPR ($10.74) Slide Toward 52-Week Lows as Spot XRP ETF Flows Stall at $708,510
22.10.2026 · TradingNEWS ArchiveCrypto
-
NG ($2.775) Decoupled From Europe’s €88 Gas Crisis as LNG Feedgas Hits 18.9 Bcf/d — $3.30 Upside on Cold Weather
22.10.2026 · TradingNEWS ArchiveCommodities
-
Dollar-Yen (157.35) Loses 157.65 as the Yen Rallies on Haven Demand — 155 Target if 156 Breaks
22.10.2026 · TradingNEWS ArchiveForex
Oil At $96 Should Be Bullish And Is Currently Bearish
The inflation transmission channel has inverted, and Wednesday illustrated it in real time.
Brent crude for November delivery gained over 2% to $96.59 a barrel intraday. West Texas Intermediate for October advanced 1.73% to $91.78. Brent traded $94.28 to $95.19 through the morning, with WTI between $89.34 and $90.51. Brent rose roughly 5% Tuesday to near $95, its highest since late July.
The catalysts are severe. U.S. forces struck Iranian Revolutionary Guard sites near Bandar Abbas and Chabahar, following weekend strikes on two rocket launchers on Iran's Larak Island in the Strait of Hormuz — the first American strikes on Iran since late July. Iran's Revolutionary Guards said two oil tankers struck naval mines attempting to transit the Strait, disabling both vessels. Tehran retaliated against Jordan, the United Arab Emirates, Kuwait and Bahrain with missiles and drones. Treasury Secretary Scott Bessent said secondary sanctions would likely be unveiled weekly, that 17 million barrels passed through Hormuz on Monday, and that Iran's bankruptcy is in the "acceleration phase." President Trump said he was not trying to force Iran to the bargaining table.
Under the textbook framework, an energy shock of this magnitude inside an active shooting war produces a bid for gold. It has produced the opposite.
Higher energy costs stoke inflation concerns, inflation concerns strengthen the case for a near-term Fed increase, and a rate increase is negative for bullion. One-year-ahead U.S. inflation expectations, measured through derivative markets, moved to 2.5% from below 2% in two weeks. That should be the debasement trade's fuel. Instead the market read it as forcing the committee's hand.
The precedent this year is consistent. When Trump vowed to intensify attacks on Iran earlier in 2026, gold slid over 2% to around $4,670, snapping a four-day winning streak, as the dollar and oil surged together. Gold has lost value repeatedly on escalation headlines because the dollar has taken the safe-haven bid instead.
Geopolitical risk is only bullish for gold when it lowers rate expectations. This particular conflict raises them, and that inversion is why $96 Brent is a headwind.
The Dollar Took The Safe-Haven Bid Instead
The currency channel is the second half of gold's problem, and it compounds the yield story rather than offsetting it.
Hawkish Fed expectations and escalating U.S.-Iran tensions have both increased demand for the dollar, creating a double headwind for a dollar-denominated metal. EUR/USD remains under bearish pressure after closing negative Tuesday and trades at its lowest level in two weeks below 1.1600. GBP/USD declined toward 1.3500 during European hours, with Middle East tensions supporting the dollar against sterling. The Dollar Index has found renewed support as front-end Treasury yields push higher, with the inverse relationship between the two strengthening.
That last point matters more than the levels. The DXY-to-yield correlation tightening means the dollar is now trading as a rate instrument rather than a risk instrument, which removes the offset gold usually gets during risk-off episodes. In a normal flight to safety, the dollar and gold rise together as capital exits equities. In this configuration, the dollar rises because rates rise, and gold falls for exactly the same reason.
The contrast with earlier phases of this conflict is instructive. On August 31, escalation lifted crude and inflation fears, yet the dollar struggled to attract follow-through buying amid soft Treasury yields — and that softness limited gold's downside. Wednesday removed that cushion entirely. Yields are firm, the dollar is firm, and gold has no support left from the currency side.
The cross-asset scoreboard on September 2 confirms the hierarchy. Gold futures gained 0.36% to 0.64% off an oversold low. Silver futures fell 1.69% to $64.26. Bitcoin fell 1.80% to $77,118.98. The Dow gained 0.56%. The dollar strengthened. Capital moved into the currency and into cash-generating equities, not into hard assets.
Two weeks ago, gold was the debasement trade and the dollar was the thing being debased. That framing produced a 4% single-day gain on August 19. Today the dollar is the beneficiary of the same fiscal stress, because a Fed that hikes into a debt problem defends the currency in the short run even as it worsens the arithmetic in the long run.
August Delivered 10% And The Treasury Handed It Over
Understanding what gold has given back requires understanding what it gained, because the entire August advance rested on a single policy action.
Gold gained roughly 10% in August after the U.S. Treasury announced plans to double liquidity-support buybacks of longer-dated bonds. Some measures put the monthly advance at 13% to 14% at the peak before the Jackson Hole reversal, with the month closing up 6.70% to 7.49% depending on the reference window.
The August 19 announcement was unexpected. The Treasury signaled it wanted to lower borrowing costs after yields hit multi-decade highs, raising the maximum buyback per operation from $2 billion to $4 billion. Gold surged more than 4% that session, its biggest gain in six months, and held above $4,500 the following day.
The interpretation the market applied is what generated the move. When a sovereign government repurchases its own long-duration debt because private buyers declined to show up at auction, the act itself communicates fiscal stress beyond what any yield print conveys. Gold markets have historically treated that pattern as a leading indicator of structural sovereign credit concerns, arriving before the concerns appear in ratings or formal policy statements. Public debt crossing the $40 trillion threshold reinforced the framing.
Sentiment followed price. The share of fund managers calling gold undervalued jumped from 6% in July to 16% in August — a near-tripling in four weeks.
The rally occurred against still-positive real yields, which is the technical signature of a market assigning growing probability to fiscal deterioration scenarios that conventional monetary models do not price in advance. That is a legitimate structural argument, and it has not been invalidated.
What has been invalidated is the timing. The debasement trade requires the Fed to be accommodative or passive while fiscal deterioration proceeds. Warsh has told the market the opposite. A committee that hikes into a $40 trillion debt load and a 5.27% 30-year yield is not accommodating the fiscal problem — it is intensifying it. Gold cannot rally on debasement while the central bank is actively defending the currency, and that contradiction is what unwound $237 of spot price in five sessions.
ETF Flows Turned Positive Right Before The Reversal
The fund flow picture is the most encouraging data in this forecast, and the timing is the problem.
Gold ETFs recorded combined inflows of 70 tonnes across July and August, reversing the 93 tonnes of outflows registered in May and June. Funds tracked across the complex added 18 tonnes in a single session — the largest one-day increase since September 2025 — and were on track for a fifth consecutive week of inflows as August closed.
The World Gold Council reported $3 billion in global gold ETF inflows during July alone, bringing total 2026 inflows to $11 billion through that month. Those are substantial numbers for a market that spent the first half of the year in redemption.
The counterweight is the overhang. Approximately 298 tonnes of ETF gold sits underwater — bought at prices above current spot. That inventory caps the near-term rally because every recovery toward breakeven creates a supply of motivated sellers who have been waiting to exit at cost. At $4,350 spot against a January peak of $5,602, a large share of 2026 inflows sit at a loss.
The behavioral pattern in this market runs one direction. Outflows arrive in concentrated bursts. Inflows arrive in a drip. Seventy tonnes accumulated over eight weeks can be surrendered in eight sessions if the yield backdrop stays hostile.
The precedent from this year is exact. When the Fed's calculus changed in March, the same Western investors who had driven gold from $3,865 in October 2025 to $5,595 in January 2026 reversed. ETF flow swung from record inflows to record outflows, and gold gave back 25% to 30% of the advance. That episode took months to build and weeks to unwind.
The current setup rhymes uncomfortably. Fresh money arrived in July and August on a rate-cut assumption. That assumption died on August 28. The 70 tonnes that came in during the debasement rally are now sitting on a losing position with a hike meeting two weeks out, and the September 1 to 2 price action is what the early stage of that reconsideration looks like.
Central Banks Are The Floor And They Do Not Chase
The structural bid beneath this market is genuine, durable, and completely indifferent to what happens on September 16.
The European Central Bank confirmed in its June 2026 International Role of the Euro report that gold has surpassed U.S. Treasuries as the world's largest reserve asset. Gold now accounts for 27% of global central bank holdings against 22% for Treasuries. That crossover was driven by two forces at once: sustained official buying that doubled central bank gold demand after 2022, and price appreciation amplifying the existing stock. Neither reverses on a quarterly timeline.
A 2026 survey of 76 reserve managers found 89% expecting global central bank gold holdings to increase over the following twelve months, with 45% expecting their own institution to add. The share holding physical gold rose to 82% from 71% a year earlier — an eleven-point increase in a single year among the most conservative allocators on earth.
Country-level data confirms the intent. China has added 60 tonnes so far this year, the highest for the equivalent period since 2023. Poland has added 82 tonnes, bringing reserves to 632 tonnes as it works toward a 700-tonne target — 68 tonnes still to buy. Reported Q2 buyers included Uzbekistan at 16 tonnes, Kazakhstan at 15 tonnes, Jordan at 6 tonnes and the Czech Republic at 6 tonnes. On the sell side, Russia was the largest Q2 seller at 22 tonnes, while Turkey — the largest Q1 seller — moderated to modest bullion sales.
The timing of official-sector accumulation is the important detail. Central banks bought a quarterly record precisely during the window when gold fell roughly 14% and Western ETF investors were liquidating. Reserve managers operate on multi-decade mandates rather than quarterly performance windows, so a price correction registers as an accumulation opportunity rather than a warning.
The limitation is equally important. Official-sector data arrives with a substantial lag and central banks do not chase price. This bid establishes a floor over years, not a catalyst over weeks. It explains why gold has not broken $3,900 and will not explain a move back through $4,695. For a September forecast, it is context, not a trade.
Demand Fell To 942 Tonnes And Nobody Is Talking About It
The most uncomfortable fact underneath this year's price action is that physical demand has been contracting while price has been oscillating in a $2,000 band.
Global gold demand in the second quarter of 2026 fell to 942 tonnes, the lowest reading since the third quarter of 2021. That is a five-year low in the total tonnage the market absorbed, recorded during a period when the metal traded between roughly $4,300 and $5,600.
The implication is direct. The price action of the past twelve months has been driven overwhelmingly by financial flows — ETF creations and redemptions, futures positioning, and macro allocation — rather than by physical consumption. Jewelry, technology and bar-and-coin demand have all been squeezed by price levels that have more than doubled from the pre-2024 baseline.
That composition makes gold considerably more volatile than its reputation suggests. A market where financial flows dominate physical demand reprices on rate expectations at the speed of a currency pair, which is exactly what the last five sessions demonstrated: a 5.25% weekly decline with no change in any underlying supply or consumption variable.
It also explains the asymmetry in this year's chart. The move from $3,865 in October 2025 to $5,595 in January 2026 — a 45% advance in roughly four months — was Western investors reallocating into the metal as rate expectations shifted. The subsequent 25% to 30% give-back was the same investors reversing when the Fed's calculus changed in March. Physical demand did neither. It simply declined throughout.
The corrective this offers is worth stating plainly. Gold price movements get attributed to ETF inflows, central bank demand and geopolitical risk premiums. Those forces are real and measurable, but they sit downstream of a more fundamental driver: the changing perceived quality of the sovereign obligations gold competes with as a store of value.
Right now the market perceives those obligations as improving in quality, because the Fed is signaling it will defend the currency. That perception is why 942 tonnes of demand, an active war, and $96 oil have produced a five-day decline.
Silver Got Hit Harder And The Ratio Says Industrial Stress
The precious metals complex did not fall uniformly, and the divergence carries a macro message.
Silver futures traded $64.26 an ounce on Wednesday, down 1.69% in early action. Tuesday's session was worse: the silver proxy closed at $64.13, down 3.73%, against gold's 2.86% decline. Silver has underperformed gold on both of the last two sessions.
The gold-silver ratio at $4,412.20 futures against $64.26 sits at 68.66. Using spot gold at $4,350.48, the ratio reads 67.70. Either figure represents a market where silver has been losing ground to gold on the margin.
The mechanism is the industrial component. Silver carries roughly half its demand profile in manufacturing — electronics, solar, brazing and photography. Gold carries almost none. When ADP prints a 17,000-job manufacturing loss and a 5,000-job decline in natural resources and mining, silver absorbs that read-across and gold does not. A widening ratio in a falling market signals that the decline is being driven by growth concerns layered on top of the rate story, not by rate expectations alone.
For Latin American producers, the slide matters most through silver rather than gold, given regional mine composition.
The broader complex context is that this is a rate-driven selloff, not a commodity-driven one. Copper, energy and agricultural inputs have been firm — Brent at $96, CF Industries up 4.28%, Bunge Global up 4.16%. Precious metals are the outlier within commodities this week, which isolates the cause to the opportunity-cost channel rather than to any general risk-asset liquidation.
If Friday's payrolls come in weak enough to pull hike odds down, silver's higher beta means it recovers faster than gold from these levels. If payrolls come in firm, silver's industrial exposure means it falls faster. The ratio at 68.66 is neither stretched nor compressed by historical standards, which leaves it as a confirmation indicator rather than a trade on its own.
The January Precedent Is The Bull Case And The Bear Case
Gold has already run this exact cycle once inside twelve months, and both sides of the trade should study it.
The debasement trade first fired hard after last year's Jackson Hole meeting. Gold ran from $3,865 in October 2025 to $5,595 in January 2026 — a 45% advance in roughly four months, driven by Western investors reallocating into the metal as rate expectations shifted. The all-time high of $5,602.23 printed on January 29, 2026.
Then the Fed's calculus changed in March. The same buyers reversed. ETF flow swung from record inflows to record outflows. Gold gave back 25% to 30% of the advance, and the metal spent the following five months grinding through a range that eventually took it to a $3,579.72 low.
The lesson runs both ways. A currency-driven rally can run for months and deliver 45%. It can also unwind in weeks when the currency stops cooperating.
August 2026 was attempt number two. The Treasury buyback on August 19 played the role October 2025's Jackson Hole played — a policy signal that fiscal stress was forcing official intervention. Gold gained roughly 10% for the month, ETFs took in 70 tonnes across July and August, fund managers calling the metal undervalued rose from 6% to 16%, and price reached above $4,500.
Attempt number two lasted nine days before Warsh reversed it.
The structural difference between the two episodes is what determines the forecast. In October 2025, the Fed was easing or expected to ease, so the debasement trade and monetary policy pointed the same direction. In September 2026, they point opposite directions: fiscal deterioration argues for gold, while a hiking Fed argues against it. That conflict is why the August rally could not sustain and why $4,695 was never approached.
Resolution requires one side to break. Either the Fed hikes and the fiscal picture deteriorates faster, eventually forcing the debasement trade to win, or the Fed holds and gold gets its catalyst back immediately. The first path takes quarters. The second takes one payrolls print.
Gold Price Forecast: The Levels And Targets Into September 16
Gold futures trade $4,412.20 with spot XAU/USD at $4,350.48, down 1.74% on the day, 5.25% on the week, up 6.70% on the month, up 0.97% year to date and 27.16% over twelve months. The metal sits 21.24% below its $5,602.23 all-time high of January 29, 2026, and 23.3% above the $3,579.72 low of the 52-week range.
The near-term bias is bearish. The 10-year has advanced six consecutive sessions to 4.814%, the 30-year sits at 5.27%, September hike odds have moved from 36% to approximately 70% in five trading days, spot trades below both the 100-day SMA at $4,365 and the 20-day Bollinger middle band at $4,445, RSI reads 46.28 with no oversold signal, technical ratings score a sell on the immediate horizon, the dollar is bid with EUR/USD under 1.1600 and GBP/USD near 1.3500, and roughly 298 tonnes of ETF gold sits underwater as an overhead supply.
Downside targets in sequence from spot: $4,315.60 pivot (-0.80%), then $4,136.00 (-4.93%), which represents the low end of the September projection range. Beneath that, the October 2025 base at $3,865 sits 11.16% lower and the 52-week floor at $3,579.72 lies 17.72% below.
Upside targets require the yield curve to cooperate: $4,365 (100-day SMA, +0.33%), $4,445 (Bollinger middle band, +2.17%), $4,695 (upper Bollinger band, +7.92%), $4,800 as the near-term institutional target (+10.33%), $5,000 on a six-to-twelve-month horizon (+14.93%), and $5,051 as the aggressive month-end projection (+16.10%). The conservative month-end estimate sits at $4,443.91, effectively the Bollinger middle band. Year-end projections span $4,795.00 to $5,897.03.
The base case into the September 15-16 FOMC is a range between $4,136 and $4,445, with the burden of proof on the bulls. Friday's payrolls decide direction. A print materially below +53,000 pulls hike odds under 50%, drops the 10-year through 4.70%, and puts $4,445 in reach within a week with $4,695 available on a dovish FOMC. A print at or above consensus, with Brent near $96 feeding inflation expectations, confirms the hike and drives spot toward $4,136.
Hold $4,315.60 and this remains a correction inside a structural bull market floored by 27% central bank reserve allocation and 89% of reserve managers planning to add. Lose it, and the next real support is 11% lower.





