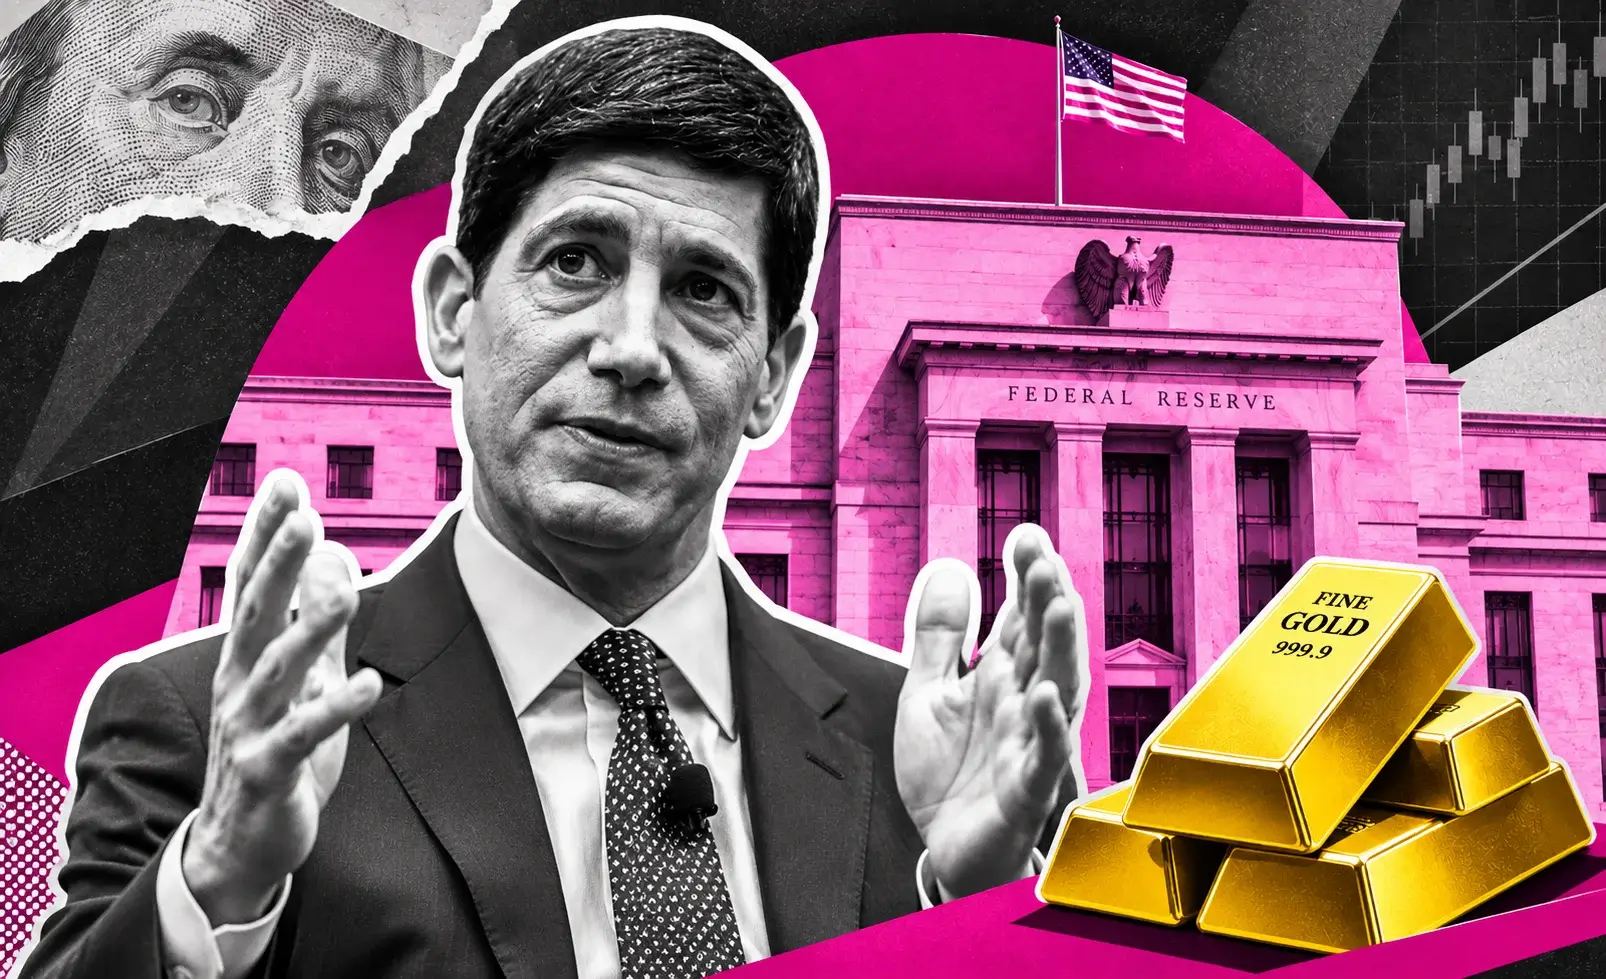
Gold Climbs to $4,121 as Haven Demand Returns — $4,400 Upside Hinges on Clearing the $4,227 Moving-Average Wall
Bullion added a second leg to its post-election rally while the Nasdaq fell 4.3% into correction and bitcoin slid 4.97% | That's TradingNEWS
Key Points
- Spot gold rose 1.48% to $4,121.74, its highest level since October 22 and 5.8% above the October 30 low.
- The dollar index slid to 101.30, its weakest level since September 30, cutting the cost of bullion for foreign buyers.
- Central banks bought 321 tonnes of gold in the third quarter, a 42% increase from the same period a year earlier.
Gold added a second leg to its post-election rally on Thursday, November 5. Spot XAU/USD traded at $4,121.74 an ounce late in the U.S. morning, up $60.22, or 1.48%, on the day. December COMEX futures stood at $4,123.60, up 1.24%, after printing $4,144.20 overnight. The spot high came in near $4,148 during the Asian session, with an overnight low of $4,057.50, putting Thursday’s range at $90.50 before New York lunch.
That high marks the strongest price since October 22. It follows a 3.4% surge on Wednesday that took gold from below $4,000 to $4,073, the metal’s biggest one-day gain since August 19. Two sessions in, bullion has added roughly $225, or 5.8%, from the $3,897 it fetched on October 30, and $250 from the year-to-date low of $3,870 printed last week.
In other currencies the move is smaller but still clean. Gold in euros traded at €3,665, up 1.3%, as the single currency firmed against a weaker dollar. In India, the 999-purity benchmark rose ₹2,888, or 2.05%, to ₹1,43,950 per 10 grams in the morning fixing, with domestic futures pushing above ₹1.45 lakh ahead of the festival buying season.
Context keeps the rally in perspective. Gold is still down 4.4% for 2026, and it trades 26.5% below its record of $5,608.35. On a 12-month view it is up 3.6%. The metal hit a 12-month low on October 30, and the past week is a rebound from a deep washout, not a fresh run at the highs.
The thesis for this forecast is direct. Gold has reclaimed its hedge role in two days because three of its four main drivers flipped at once: the dollar fell, Treasury yields dropped, and equities cracked. The fourth driver, Federal Reserve policy, has not moved. Fed funds futures still price between a 79% and 82% chance of a December rate hike, and that is the ceiling holding gold under the $4,187 to $4,227 resistance band where the 50-day and 100-day moving averages sit. Friday’s October payrolls report decides whether gold breaks through that wall toward $4,400 or slips back to defend $4,000. Until that print, the path of least resistance is higher, but the runway is short.
From $3,870 to $4,148: How Gold Turned in Five Sessions
The rally has a clear starting point. Gold hit its year-to-date low of $3,870 last week as a stronger dollar, rising Treasury yields and steady hawkish Fed signals drained demand. The metal fell 4.1% in a single week in late October with no help from the dollar, and silver closed below its 2026 lows. Junior miners dropped more than twice as fast as bullion. That was capitulation-style selling, and the October 30 print became a 12-month low.
The first bounce came on Monday, November 2. Spot gold rose 1.9% to $3,948 and silver gained 3.2% to $50.63 after Friday’s rout. Miners led, with the VanEck Gold Miners ETF (GDX) up 2.67% to $79.15, Newmont up 2.33% to $109.09, Agnico Eagle up 3.04% to $170.41 and Barrick up 5.55% to $40.14. When miners outrun the metal off a low, it often signals that the market is starting to price in higher bullion ahead of the move itself.
Tuesday’s session was cautious. Gold opened Election Day at $3,962.72, up 0.41%, and stayed under the $3,970 resistance zone as the September JOLTS report showed job openings rising to 7.523 million from 7.190 million. That firm labor data pushed December hike odds to about 80% and kept the non-yielding metal pinned.
Wednesday changed everything. Democrats won control of both chambers of Congress, the dollar slid, the 10-year Treasury yield fell 7.4 basis points to 4.888%, and crude collapsed more than 8%. Gold ripped 3.3% to 3.4% and closed back above $4,000. The SPDR Gold Shares (GLD) jumped 3.68% to $372.49, the iShares Silver Trust (SLV) gained 5.17% to $47.16, and platinum funds rose 5.6%. Silver led gold that day, climbing to near $52.
Thursday’s follow-through came overnight. Spot gold added 1.9% to $4,134.83 by early London trading and then pushed on to $4,148. Through the European morning the metal consolidated above $4,100, turning Wednesday’s breakout level into the floor. Once U.S. equities cracked after the open, gold held its gains while stocks, crypto and chips all fell.
The sequence matters for the forecast. A rally that starts with miners leading, picks up momentum on a macro shift, and then holds while risk assets sell off has a sturdier base than a one-day spike. The structure says buyers are stepping in on weakness rather than chasing strength.
The Dollar Slide: DXY Breaks Lower and Hands Gold Its Fuel
The single biggest driver of gold’s two-day run is the dollar. The U.S. dollar index closed Wednesday at 101.48, down 0.4%, and traded at 101.30 on Thursday morning. Wednesday’s close was the weakest since September 30. A weaker greenback makes dollar-priced bullion cheaper for buyers holding euros, yen, rupees and yuan, and it lifts demand from the world’s largest physical gold markets.
The political shock explains the dollar move. A Democratic Congress means divided government starting in January, which caps the odds of new tariff escalation and large fiscal packages. Both had been dollar-supportive themes. Markets also read the result as reducing the risk of further escalation in the US-Israeli war with Iran, since Congress can now constrain military options. That pushed oil lower, which cuts the inflation path that had been pushing the Fed toward hikes and supporting the dollar.
The Senate result adds a second layer. Democratic control blocks efforts to reshape the Federal Reserve Board, since any new governor now needs Democratic approval. That removes a source of uncertainty around central-bank independence under Chair Kevin Warsh. In theory, a more independent Fed is dollar-positive. In practice, the market spent Wednesday and Thursday focused on the growth and fiscal implications, both of which point to a softer dollar.
Cross-currency moves confirm the shift. The euro firmed enough that gold in euro terms rose only 1.3% against a 1.6% gain in dollar terms. USD/JPY drifted lower to 158.25 after hawkish Bank of Japan minutes. Sterling found support after the Bank of England raised rates by a quarter point to 4% on Thursday, its first hike since 2023. When the dollar weakens against multiple majors at once, gold tends to rise in dollar terms regardless of what happens in any single cross.
The risk to this driver is Friday. A hot payrolls print would firm December hike bets and send the dollar back toward 102. That would likely knock $50 to $100 off gold in a session, based on how the metal traded through the late-October dollar rally.
For now, the dollar is cooperating. A DXY reading below 101.30 opens room for gold to test $4,187. A rebound above 101.80 would put $4,100 back in play as the line buyers need to hold.
Treasury Yields Fall Twice: Real Rates Ease and Cut Gold’s Carry Cost
Gold pays no interest, so its biggest competitor is the yield investors can earn on safe government bonds. That competitor got weaker for a second straight day. The 10-year Treasury yield fell more than 6 basis points to 4.831% on Thursday, after dropping 7.4 basis points to 4.888% on Wednesday. The 2-year yield, which tracks Fed expectations most closely, fell more than 8 basis points to 4.50% after a 5-basis-point slide to 4.581% the day before. The 30-year yield declined more than 3 basis points to 5.249%.
That is a 13-basis-point drop in the 2-year and a 14-basis-point drop in the 10-year in two sessions. The 10-year had been trading near 4.95% on Tuesday and is now comfortably back below the 5% threshold that weighed on gold through October.
The opportunity cost of holding gold has fallen with it. With the Fed funds target range at 3.75% to 4.00% after a 25-basis-point hike that took effect September 17, cash and short-term bonds pay a meaningful return. Every basis point lower in front-end yields reduces the carry an investor gives up by owning bullion. The European comparison is similar: the ECB sits at 2.50% after September hikes, and euro-area AAA 10-year yields stand at 3.35%.
Thursday’s yield drop had a different driver than Wednesday’s. Wednesday was about the election and oil. Thursday was flight to safety. As the Nasdaq Composite fell 4.3% into correction territory and the semiconductor index collapsed 11%, investors moved into Treasuries. Haven demand for bonds and haven demand for gold arrived together, which is the textbook setup for bullion.
Real yields, which strip out inflation expectations, are the measure gold trades against most closely. With September CPI running at 3.7% year over year and producer prices at 6.3%, nominal 10-year yields at 4.831% imply a real yield in the low single digits. Any further drop in nominal yields that is not matched by falling inflation expectations pushes real rates lower and supports gold.
Supply is the counterweight. The Treasury borrowed a record $839 billion in a single week. Heavy issuance tends to push yields higher over time as the market absorbs new paper, which could cap the bond rally even if the Fed softens.
The forecast takeaway is simple. As long as the 10-year stays below 4.90% and the 2-year below 4.60%, gold has room to extend. A snap back above 4.95% in the 10-year on a hot jobs report would take that room away fast.
The Fed Disconnect: Bonds Rally, but December Hike Odds Barely Move
Here is the tension at the heart of this forecast. The bond market has rallied hard for two days, but fed funds futures still price between a 79% and 82% chance that the Federal Reserve raises rates by a quarter point at its December 9 meeting. Hike odds sat at 77% before the election, rose to 82% on Wednesday, and settled near 79% on Thursday morning. Before Tuesday’s JOLTS report, they stood near 74%.
The Fed held its benchmark at 3.75% to 4.00% on October 28, but two officials dissented in favor of a hike, including Governor Lisa Cook and Cleveland Fed President Beth Hammack. The statement was read as signaling a hawkish bias, keeping December live. The committee has raised rates once already this cycle, in September, and has not laid out a clear roadmap for how far it intends to go.
Inflation explains the hawkish lean. September CPI rose to 3.7% year over year from 3.4% in August. Producer prices rose 6.3%. Services prices remain sticky: the October ISM services prices-paid component stayed at 73.0 even as the headline index slipped to 54.5. Growth is not giving the Fed a reason to back off either. Real GDP grew at a 3.4% annualized pace in the third quarter, according to the Bureau of Economic Analysis advance estimate. S&P 500 earnings are up nearly 40% from a year ago.
That is why gold’s rally has a ceiling. A non-yielding asset can rally on a weaker dollar and lower long-term yields, but it struggles to break out while the central bank is still pointing at higher short-term rates. The gap between a 4.50% 2-year yield and a Fed hike priced at four-in-five odds is the same gap holding gold below its key moving averages.
Oil is the swing factor for the Fed. Wednesday’s 8% collapse in crude cut the inflation path that had been pushing policymakers toward a hike. If WTI stays below $90 and Brent below $100, the case for December weakens. Thursday’s bounce to $89.73 WTI and $97.36 Brent, up 1.83% and 2.9% respectively, shows that path is not settled.
Overseas central banks add pressure. The Bank of England’s 8-1 vote to raise to 4% on Thursday, with one member wanting a larger move, shows tightening bias is spreading. Governor Andrew Bailey said the hike should not be seen as the first in a long sequence but warned it was unlikely to be the last unless the Middle East conflict is resolved.
For gold, the Fed disconnect is the main reason to keep upside targets measured. Until hike odds fall below 60%, a clean break above $4,227 is unlikely to hold.
Friday’s Payrolls: The Single Print That Sets the Next $150
The October jobs report arrives Friday, November 6, at 8:30 a.m. ET, and it is the event that decides gold’s next move. Consensus estimates sit between 59,000 and 65,000 new jobs, with unemployment holding at 4.2%. September’s report showed just 29,000 jobs added, with July and August revised down by a combined 60,000. Unemployment edged up to 4.2% from 4.1%.
The early indicators lean toward a firmer number. ADP counted 86,000 private jobs in October, ahead of the 69,000 to 75,000 expected, with base pay up 3.2% year over year. Challenger layoff announcements fell to 43,994 in October, down 71% from a year earlier and the lowest monthly total since 2023. Weekly jobless claims were expected near 196,000 after 194,000 the prior week, and continuing claims stood at 1.701 million. The labor market remains in low-hire, low-fire mode, which keeps unemployment stable even as payroll growth runs below historical norms.
Gold’s reaction function is straightforward. A hot report, with payrolls above 100,000, unemployment below 4.2% or wage growth firming, would reinforce December hike bets, push 2-year yields back toward 4.60% and lift the dollar. In that scenario gold likely gives back $60 to $100 and retests $4,050 to $4,085. A print well above consensus could send the metal back toward $4,000, the line that marks whether the post-election rally was a real turn or a two-day spike.
A soft report, with payrolls below 40,000 or unemployment rising to 4.3%, would cut hike odds, extend the bond rally and push the dollar lower. Gold would likely clear $4,148 quickly and test the $4,187 to $4,227 resistance band. A sharp miss could take hike odds below 60% and open the door to $4,300.
A report near consensus would keep gold range-bound between $4,085 and $4,187 into next Tuesday’s October CPI release. That report is expected at 3.7% year over year and 0.2% month over month. A hot CPI could undo any payroll-driven rally, while a soft print could extend it.
Positioning favors upside surprises from soft data. Gold has already priced a weaker dollar and lower yields. It has not priced a cut in Fed hike odds. That asymmetry means a weak print could move gold more than a strong print, which tilts the risk-reward toward the bullish side even with hike odds near 80%.
Equities Crack, Gold Holds: The Safe-Haven Bid Returns
Thursday delivered the cleanest test of gold’s hedge role in weeks, and bullion passed. While the S&P 500 fell 3.14% to 7,447.43, the Nasdaq Composite dropped 4.30% into correction and the PHLX Semiconductor Index collapsed 11% in its worst day since March 2020, spot gold held its 1.48% gain. The CBOE Volatility Index jumped as high as 23.46, a 41.6% spike from Wednesday’s 16.61 close.
That divergence is what gold holders want to see. Through much of October, gold traded alongside risk assets as rising yields and a strong dollar hit everything at once. Thursday broke that pattern. Investors sold technology and AI infrastructure stocks on fears that Democratic wins in Texas, Ohio and Georgia will slow data-center construction, and they moved cash into Treasuries and gold.
The contrast with bitcoin is stark. BTC-USD fell 4.97% to $76,306 as the chip rout spilled into crypto and wiped out $595.54 million in leveraged long positions. On the same day gold rose to a two-week high. One ounce of gold now buys more bitcoin than at any point this year. The digital-gold argument failed its test; physical gold did not.
The safe-haven bid has structural support. When the VIX spikes above 20, volatility-targeting funds cut equity exposure mechanically. Some of that cash goes into short-term bonds and some into gold, particularly through ETFs that allocators can buy in the same trade. GLD’s 3.68% gain on Wednesday and steady trading on Thursday reflect that rotation.
The political driver of the equity selloff also helps gold. Data-center moratoriums, AI regulation and congressional hearings are slow-moving risks that will hang over growth stocks for months. Gold tends to perform best when equity uncertainty is persistent rather than acute, because allocators build hedge positions over weeks rather than days.
The limit on this driver is that equity selloffs can also force gold selling. In sharp liquidation events, investors sell what they can to meet margin calls, and gold is liquid. That happened in March 2020 and in April 2025. Thursday did not show that pattern, but if the Nasdaq falls another 5% to 10%, gold could see temporary liquidation pressure even as its longer-term haven role strengthens.
For the forecast, the equity rout adds support near $4,100. It does not on its own push gold through $4,227, which needs the Fed to cooperate.
Oil, Iran and the Inflation Path: Why Cheaper Crude Cuts Both Ways
Oil’s role in the gold story is more complicated than it looks. On Wednesday, both WTI and Brent fell more than 8% to settle at their lowest since August 31 as markets bet the election reduces the risk of further escalation in the US-Israeli war with Iran. Brent extended losses overnight to $93.82 and WTI to $86.92 before bouncing on Thursday to $97.36 and $89.73.
Cheaper oil helps gold in one way and hurts it in another. The helpful channel runs through the Fed. Energy prices have fed directly into the 3.7% CPI print and the 6.3% producer price reading. Lower crude cuts the inflation path that has been pushing the Fed toward a December hike, which lowers expected short-term rates and reduces gold’s opportunity cost. That was a big part of why gold ripped 3.4% on Wednesday as oil collapsed.
The harmful channel runs through geopolitics. Gold has carried a war premium since the Iran conflict began. A path toward resolution reduces the demand for crisis hedges. If peace talks advance, some of the haven bid that has supported bullion near $4,000 even through hawkish Fed signals could fade.
The political signals are mixed. Vice President JD Vance posted that the war was the reason his party lost the midterms, suggesting a push for resolution. Sources close to Gulf governments said a weakened president facing a Democratic Congress has more incentive to seek a deal and that a full-scale assault on Iran looks less likely. But uncertainty over whether the administration actually pursues negotiations capped the oil selloff and allowed crude to recover on Thursday.
Oil also matters to gold miners directly. Energy is one of the largest operating costs in mining, and diesel prices feed straight into all-in sustaining costs. When oil rises, miners get hit twice: through higher costs and through the rate channel that weighs on gold. That double effect explains why junior miners fell 9.6% in a late-October week when gold fell 4.1%. Cheaper oil reverses that pressure and widens margins.
The net effect for the forecast leans positive. A sustained drop in oil below $90 Brent would likely cut Fed hike odds more than it would reduce gold’s geopolitical premium, because the war risk has been priced for months while the Fed path is still live. Gold’s best scenario is lower oil without a peace deal. Its worst is higher oil with a peace deal.
Central Banks and Physical Demand: 321 Tonnes in a Quarter Builds the Floor
The official sector remains the most reliable buyer in the gold market. Central banks bought 321 tonnes in the third quarter, up 42% from a year earlier, according to official-sector demand data published Tuesday. That pace keeps 2026 on track as another heavy year of reserve accumulation, extending a trend that began after Western sanctions froze Russian reserves in 2022.
Central-bank buying changes how gold trades. Reserve managers are price-insensitive over short horizons and tend to add on weakness rather than chase strength. That creates a floor under the market that speculative and ETF flows cannot easily break. The October 30 low of $3,870 held in part because official buyers were active as prices fell below $4,000.
Physical demand in Asia is the second pillar. In India, the 999-purity benchmark rose 2.05% to ₹1,43,950 per 10 grams on Thursday, and domestic futures pushed above ₹1.45 lakh. Physical silver prices in India jumped for the first time in 10 days, with the per-kilogram rate climbing ₹10,000 to ₹2,10,000 ahead of the Dhanteras festival, traditionally one of the strongest weeks of the year for jewelry and coin purchases. A weaker dollar makes gold cheaper in rupee terms, and festival timing adds seasonal demand on top.
Coin and bar premiums in Europe point to steady retail interest. A one-ounce Krugerrand sells for €3,794 with a 3.5% premium over spot, while the buy-back price sits at €3,545. The 6.6% spread is normal for a market where retail buyers are active but not panicking.
Institutional flows have also shifted. Gold equities have drawn growing allocations throughout 2026 as bullion held above $4,000 for much of the year, with geopolitical uncertainty and central-bank purchasing cited as the main supports. Australian gold miners surged on Thursday, with the S&P/ASX 300 Metals and Mining index gaining 7.9% to 7,930.90 and several producers posting double-digit percentage gains.
The physical and official bid will not drive gold through resistance on its own. Those buyers add on dips, not breakouts. But they make the downside shallower. A test of $4,000 on a hot payrolls print would likely meet central-bank and Asian physical buying, whichis why the forecast treats $4,000 as a strong floor and $3,870 as a deep one.
Read More
-
Yen Stalls at 160 Despite a 3% JGB and Tokyo Core CPI at 2.0% — Intervention Sits at 164, Friday's Payrolls Decide
02.09.2026 · TradingNEWS ArchiveEnergy
-
Toyota Gaps to $218 as Hybrids, a Weak Yen and an $89B Return Plan Spark a Historic Rally — Buy Above $200
05.11.2026 · TradingNEWS ArchiveStocks
-
Ethereum Slides to $2,272 as Leveraged Longs Unwind — $2,170 Support vs $2,500 Moving-Average Wall
05.11.2026 · TradingNEWS ArchiveCrypto
-
Brent Bounces to $97 and WTI to $89.73 as Physical Tightness Fights the Peace Trade — $93 Floor vs $105 Target
05.11.2026 · TradingNEWS ArchiveCommodities
-
Nasdaq Enters Correction at 24,630, S&P 500 Sinks to 7,447, Dow Sheds 2.4% as NVDA Drops 8%
05.11.2026 · TradingNEWS ArchiveMarkets
-
Pound Steadies at 1.3465 as First BoE Hike Since 2023 Meets a Firmer Dollar — 1.3503 Double Top in Focus
05.11.2026 · TradingNEWS ArchiveForex
Silver and Platinum Lag: The Gold-Silver Ratio Widens to 78.2
Silver joined Thursday’s rally but trailed gold. Spot silver traded at $52.78, up 0.98%, after printing as high as $53.50 overnight. That follows a 5% surge on Wednesday to $52.16 when silver outpaced gold. Silver is still down 25.65% for 2026 and 14% over the past month. It sits far below its record of $121.64, while remaining 9.9% higher than a year ago.
The gold-silver ratio tells the story. The ratio stood at 78.20 on Thursday, up from 77.80 on Wednesday, meaning it takes 78.2 ounces of silver to buy one ounce of gold. When the ratio rises during a precious-metals rally, it signals that investors are buying gold as a hedge rather than chasing the higher-beta metal for speculative gains. That fits Thursday’s tape: haven demand drove gold, while silver’s industrial side was dragged by the selloff in semiconductors, which are a major source of silver demand through electronics and solar.
Silver’s line in the sand is $49.07, the low from October 30. A close below that would suggest Wednesday’s surge was a short squeeze rather than a turn. Above, the next test sits at $54, which traders priced as a better-than-even near-term touch.
Platinum and palladium followed the precious-metals bid. Spot platinum traded at $1,530.60, up $23.10, and palladium at $1,046.99, up $19.94. Both metals have heavy automotive exposure and tend to move with industrial sentiment, which held up better than tech sentiment on Thursday.
The ratio matters for gold’s forecast because it signals the type of rally underway. A gold rally led by silver, with the ratio falling, tends to reflect broad speculative flows and can reverse quickly. A gold rally with the ratio rising reflects haven and reserve demand, which is slower but more durable. Thursday’s widening ratio supports the view that gold’s move has a sturdier base than silver’s.
There is also a contrarian read. At 78.2, the ratio is elevated relative to its long-run average. If Friday’s payrolls come in soft and risk appetite returns, silver could catch up quickly, with the ratio dropping toward 75. That would not hurt gold, but it would mean silver offers more upside than gold in a broad precious-metals rally.
Gold Miners and ETFs: GLD Jumps 3.68% as Producers Ride Operating Leverage
Gold equities and exchange-traded funds give a read on how investors are positioning around the metal. The SPDR Gold Shares (GLD) closed Wednesday at $372.49, up 3.68%, in line with spot gold’s surge. Silver and platinum funds outperformed, with SLV up 5.17% to $47.16 and PPLT up 5.6% to $13.54. Those moves show broad-based buying across the precious-metals complex on the day the dollar broke.
Miners carry operating leverage, which is why they move faster than the metal in both directions. When gold rises, a producer’s costs stay largely fixed, so margins and earnings grow faster than the gold price. In late October that leverage worked in reverse: the junior miners ETF (GDXJ) fell 9.6% in a week when gold fell 4.1%, and Newmont slid even after reporting record third-quarter adjusted net income. From an October 12 close of $112.92, the GDXJ fell 12% to $99.35.
The recovery started early. On Monday, November 2, GDX gained 2.67% to $79.15 as miners led gold off its lows. Barrick rose 5.55% to $40.14, Agnico Eagle 3.04% to $170.41 and Newmont 2.33% to $109.09. When miners lead the metal higher off a bottom, it often marks a durable turn, because equity investors are pricing in higher future gold prices before the spot market fully reflects them.
Australian trading on Thursday showed how sharp the leverage can be. Newmont’s Australian-listed shares surged 13.02% to A$174.39, and Evolution Mining jumped 14.21% to A$13.26, as local gold prices benefited from both a higher dollar price and currency moves.
Newmont remains the bellwether. The world’s largest gold miner expects to sell 5.3 million ounces from its continuing mines in 2026 after divesting six higher-cost, smaller operations following the Newcrest acquisition. It also produces copper, silver, zinc and lead as byproducts, which gives it some exposure to industrial metals. At gold above $4,100, Newmont’s margins sit near record levels.
For the forecast, miners are a leading indicator. If GDX and Newmont keep outperforming bullion through Friday’s payrolls, it signals investors expect gold to break $4,200. If miners lag on a gold rally, it would suggest the move lacks conviction. The cheaper oil backdrop adds to the miners’ case by cutting energy costs.
The Technical Map: Resistance Stacks From $4,135 to $4,227
Gold’s daily chart shows a recovery inside a larger descending channel. The metal remains below its medium- and long-term moving averages, which keeps the broader bias capped even after a 5.8% rally in five sessions. The 50-day and 100-day simple moving averages sit near $4,200, and that cluster is the most important resistance on the chart.
Resistance stacks in layers. Immediate resistance sits at $4,135, a level gold briefly cleared overnight before consolidating. Above that, $4,148 marks Thursday’s session high. The $4,187 to $4,227 band is the main wall, where the moving averages meet the upper boundary of the descending channel. A daily close above $4,227 would break the channel and confirm a higher high. $4,204 is an intermediate target within that band.
Support is equally clear. The first floor sits at $4,104 to $4,100, the breakout level that gold reclaimed early Thursday and has held through the U.S. session. Below that, $4,085 is the next intraday support. The 21-day simple moving average offers support beneath, and $4,000 is the psychological and structural line that separates a durable recovery from a failed bounce. Below $4,000, the $3,970 resistance-turned-support zone and then the $3,870 year-to-date low come into play.
Momentum has improved. Bullish momentum on the daily chart is building as gold moves further from last week’s low, and the metal has posted two consecutive strong closes. The relative strength index has climbed out of oversold territory without yet reaching overbought, which leaves room for further gains.
The descending channel defines the trend. Since its record of $5,608.35, gold has made a series of lower highs and lower lows. The October 22 high, which Thursday’s session matched, is the most recent lower high. Breaking above it on a closing basis and then clearing $4,227 would be the first higher high in the sequence and would shift the trend from bearish to neutral.
The compression between $4,100 support and $4,227 resistance is only $127 wide, or 3% of the gold price. That is a narrow range for a metal that moved 3.4% in a single session on Wednesday. Friday’s payrolls report is the likely catalyst to resolve it.
Forecast Scenarios: $4,400 on a Breakout, $4,000 on a Hawkish Surprise
The bullish scenario starts with a daily close above $4,148, Thursday’s session high. That would confirm the post-election rally has momentum beyond Wednesday’s surge. From there, gold needs to clear the $4,187 to $4,227 resistance band where the 50-day and 100-day moving averages converge. A close above $4,227 breaks the descending channel and opens a path to $4,300 and then $4,400. The $4,400 target represents a 6.7% gain from the current $4,121.74 spot price.
The catalysts for that path are clear. A soft payrolls print on Friday below 40,000 would cut December hike odds and extend the bond rally. A soft October CPI on Tuesday, November 10, below the 3.7% consensus would reinforce it. A further dollar slide below 101 on the DXY would add fuel. Continued equity stress, with the VIX holding above 20, would keep the haven bid alive. Any two of those four would likely carry gold through $4,227.
The base case is consolidation. A payrolls print near the 59,000 to 65,000 consensus would keep hike odds near 80% and leave gold trading in a $4,085 to $4,187 range through next week’s CPI. That range respects both the breakout floor and the moving-average ceiling. Gold would build a base above $4,100, setting up a breakout attempt later in November.
The bearish scenario follows a hot jobs report. Payrolls above 100,000, unemployment below 4.2% or firm wage growth would push hike odds toward 90%, lift 2-year yields back above 4.60% and strengthen the dollar. Gold would likely drop $60 to $100 in a session and retest $4,050 to $4,085. A sustained close below $4,000 would mark the post-election rally as a failed bounce and target $3,970 and then the $3,870 year-to-date low.
Probabilities lean bullish but not decisively. The early labor indicators point to a firmer payrolls number, which argues against the most aggressive upside scenario. But gold has already shown it can rally on a weaker dollar and haven demand even with hike odds near 80%, and the floor from central-bank and physical buying makes the downside shallower than the upside.
The risk-reward favors buying dips toward $4,100 with a stop below $4,000 and a first target at $4,227. A confirmed break above $4,227 raises the target to $4,400.
Gold Price Forecast Verdict: Bullish Bias Under a Fed Ceiling, $4,227 Unlocks $4,400
Gold’s Thursday session was bullish, and the forecast for the next two weeks leans the same way. Spot XAU/USD at $4,121.74 is up 1.48% on the day and 5.8% from the October 30 low, holding a two-week high while equities, crypto and chip stocks sold off. December futures at $4,123.60 confirm the move.
Three of gold’s four main drivers have turned supportive in two days. The dollar index fell to 101.30, its weakest level since late September. The 10-year Treasury yield dropped to 4.831% and the 2-year to 4.50%, cutting the carry cost of holding bullion. The Nasdaq’s 4.3% drop into correction and the VIX spike to 23.46 restored the haven bid. Central banks bought 321 tonnes in the third quarter, up 42%, and Indian festival demand adds a seasonal tailwind.
The fourth driver has not moved. Fed funds futures still price between a 79% and 82% chance of a December hike, and that ceiling explains why gold has stalled just below the $4,187 to $4,227 resistance band where the 50-day and 100-day moving averages converge. Until hike odds fall, a decisive breakout is unlikely.
Friday’s October payrolls report decides the next move. A soft print below 40,000 jobs would likely push gold through $4,227 and toward $4,400, a 6.7% gain. A print near the 59,000 to 65,000 consensus keeps gold in a $4,085 to $4,187 range into next Tuesday’s CPI. A hot print above 100,000 sends gold back to test $4,050 and possibly $4,000.
Base case for the next 10 trading days: bullish bias within a $4,085 to $4,227 range, with a breakout above $4,227 targeting $4,400 and a breakdown below $4,000 targeting $3,870. Support at $4,100 is the line buyers need to hold. Gold has reclaimed its role as the market’s hedge, and the only thing standing between it and $4,400 is a Fed that has not yet blinked.