





Gold Defends The $4,606 Shelf After Failing At $4,696
Gold has run 16% from near $4,000 this month but sits 17.9% below its January 29 record | That's TradingNEWS
Key Points
- Spot gold trades below $4,600 after a 1.38% drop to $4,593.74; December futures hold $4,648.90.
- Central banks bought a record 288.9 tonnes in Q2 2026, up 62% year over year, plus 244 tonnes in Q1.
- September hold odds slipped to 60% from 64%, with hike probability near 38% into Friday's Warsh speech.
Gold is doing the one thing that matters least on a chart and most on a calendar: nothing, in front of a speech.
Spot XAU/USD trades slightly below $4,600 after erasing early Asian-session gains, virtually unchanged on the day. December futures opened at $4,650 per troy ounce, down 0.1% against Wednesday's close, and traded $4,648.90 as of 7:59 a.m. ET. The metal settled Wednesday at $4,593.74 on the spot benchmark, down 1.38% on the session — the first time in three sessions it closed below $4,600.
The performance table underneath that flat print is where the story sits. Against one week ago, the opening futures price is up 3.2%. Against one month ago, up 13.7%. Against one year ago, up 36.9%. Spot has run 12.89% over the past month and 37.15% over twelve months.
Then the two numbers that complicate all of it. Year to date, gold is up 6.73%. Over six months, it is down 10.89%. And the all-time high of $5,602.225, set on January 29, 2026, sits $1,008 above the current price — a 17.9% gap that has not closed in seven months.
That is the entire framework for this market. Gold is running a violent August recovery inside a much larger drawdown from a January peak that came with year-over-year growth of 95.6% at the time. The metal that doubled into January has spent the year since giving nearly a fifth of it back, and August has been the first month to seriously reverse the pattern.
Tuesday's session produced the high water mark of that reversal: $4,696.20, a more-than-three-month peak, before the rally lost momentum and price eased to $4,620. Wednesday's inflation data pushed it down another 1.38%. This morning's bid faded again.
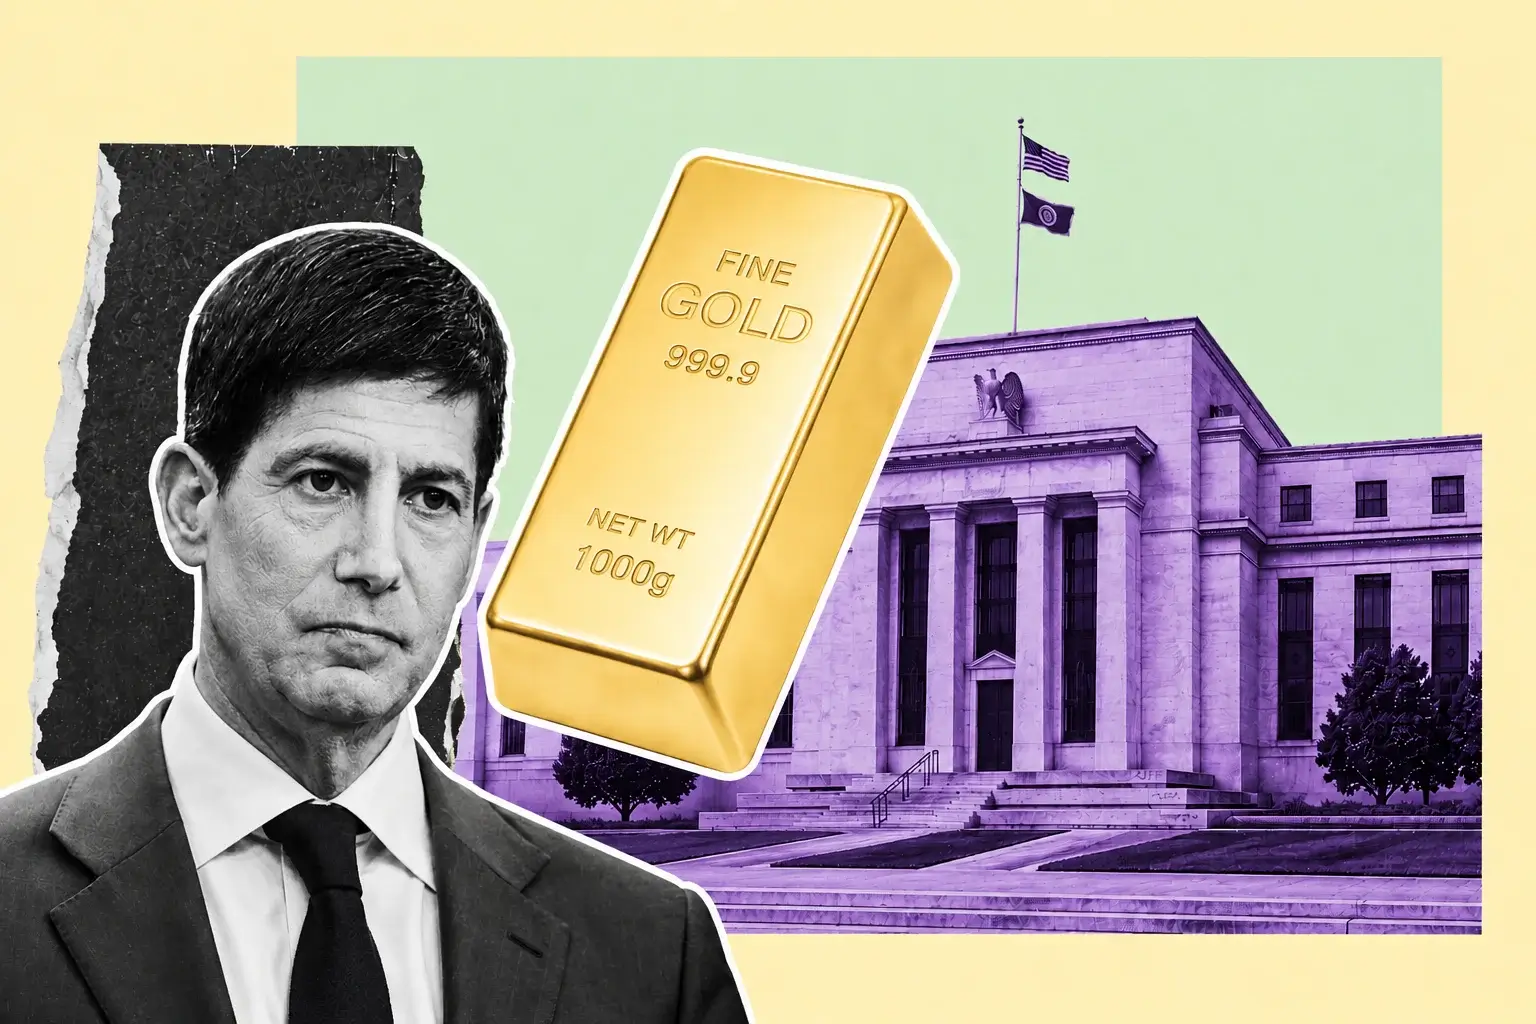
Traders are not placing directional bets ahead of Friday. Fed Chair Kevin Warsh delivers his first Jackson Hole address as chair, and the dollar path that emerges from it determines whether the non-yielding metal gets the impetus it needs to attack $4,696.20 or gives back the month.
Initial jobless claims land at 8:30 a.m. ET first.
Tuesday's $4,696.20 Print And Wednesday's 1.38% Reversal
The three-session sequence into today explains exactly where the market is stuck.
Tuesday: gold pushed to $4,696.20 intraday, its highest level since May 14, on a combination of a soft dollar and continued digestion of the Treasury's buyback expansion. The move failed. Price rolled over to $4,620 by the close as buyers refused to pay up ahead of Wednesday's PCE release and Friday's Jackson Hole speech.
Wednesday: gold eased below $4,650 in early trade, then came under heavier pressure through the session after the inflation print landed. It traded $4,620.38 in the New York morning, down 0.83% on the day, and closed at $4,593.74 — a 1.38% decline from the previous session. The intraday low probed the $4,600s repeatedly without conviction in either direction.
Thursday: bullish action in the early Asian hours, then a reversal that erased the entire daily gain. XAU/USD sits virtually unchanged, slightly below $4,600, while December futures hold $4,648.90.
The structure of that failure at $4,696.20 matters. Gold gained more than 16% from the start of August, running from near $4,000 to the Tuesday high — its best monthly gain since January and the sharpest reversal of the year. A move of that magnitude into a resistance test, followed by two down sessions and a failed overnight bid, is a market that has run out of momentum buyers and is waiting for a catalyst rather than distributing.
The one-hour technical structure supports that read. Price holds above both the 100-period simple moving average at $4,606.20 and the 200-period at $4,502.80, which means dips are still finding support inside the broader uptrend even after price broke its ascending trendline. The relative strength index near 41.00 shows upside momentum draining without flipping to outright weakness.
Positioning has a specific constraint attached. Precious metals have found comfort in this higher range, but the scope for further trend-following length from current levels is minimal — the systematic buyers who fuel the fast leg of a move are already positioned. Discretionary flows now have to do the heavy lifting, and discretionary desks do not commit ahead of a Fed chair's first symposium speech.
The PCE Print That Split The Fed: Headline 3.7%, Core At 3.3%
Wednesday's inflation data did not resolve the September question. It sharpened the disagreement.
Headline PCE rose 0.2% from June to July against a 0.1% consensus, and 3.7% year over year against 3.6% expected. Core PCE, which strips food and energy, rose 0.2% month over month and 3.3% year over year — both in line with estimates and unchanged from June on the annual reading. Consumer spending and income each came in slightly above forecasts. Full detail publishes through the Bureau of Economic Analysis.
The split inside that print is the reason gold went nowhere. Prices remained sticky year over year, which arms the hawks. Month-over-month data pointed to a slower pace of increase, which gives cover to policymakers content to hold rates steady. Both camps got a data point and neither got a verdict.
Two supporting releases arrived the same morning. Second-quarter GDP came in at 1.5% annualized on the second estimate, matching the initial reading and down from 2.1% in the first quarter. Durable goods orders rose 1.1% in July against a 0.5% consensus, a clear beat that points to business investment holding up better than the growth number implies.
That combination — sticky 3.3% core inflation, 1.5% growth, and durable goods beating by more than double — is the worst possible backdrop for a clean directional call on gold. Inflation above target argues for tightening, which raises real yields and pressures a non-yielding asset. Growth at 1.5% argues for patience. Neither dominates.
The metal's reaction told the story: down 0.83% intraday, down 1.38% on the close, then flat overnight. Gold sold the sticky headline number and then stopped, because the monthly deceleration removed the case for an aggressive repricing.
A decision to hold rates steady in September would lift the primary headwind and support continuation of August's advance. A hike raises real yield expectations and puts the entire 16% August gain at risk. That binary sits three weeks out, and the man who resolves it speaks Friday morning.
Rate Odds At 60% Hold: The Single Number Gold Is Trading
Everything in the gold market right now compresses into one probability.
Markets are pricing roughly a 60% chance the Federal Reserve leaves rates unchanged next month, down from 64% before Wednesday's data. The inverse — the probability of a September hike — sits near 38% to 40%, having moved up on the sticky annual PCE readings. The target range in question is 3.50%–3.75%.
The trajectory of that number across August is the entire explanation for gold's 16% monthly advance. Three data prints early in the month — jobs, CPI and PPI — all came in soft, and September hike odds collapsed from 50% to 31%. Gold ran from near $4,000 toward $4,400, then extended toward $4,696.20 as the Treasury buyback announcement compounded the dollar weakness. Every dollar of that rally was purchased with declining hike probability.
Wednesday partially reversed that. Hold odds slipping from 64% to 60% is a four-point move, and gold gave back 1.38%. The sensitivity is close to linear right now, which tells you positioning is concentrated and short-duration.
The historical context makes the sensitivity worse. Gold and silver shed roughly 29% from their January highs as the hawkish turn under Warsh reshaped expectations across the first half of 2026. At one point in June, September hike odds stood at roughly 68%, up from 29% just one week earlier, and the dollar sat at a 13-month high. That episode is fresh enough that no discretionary desk wants to be long into an ambiguous Fed communication.
What has changed structurally is the composition of the buyer base. The 2026 drawdown was driven by rate traders exiting a position built on a rate-cut thesis that evaporated. Those holders are largely out. What remains long is a different cohort with a different time horizon, and that cohort does not trade a four-point shift in CME probabilities.
The near-term price still does. Between now and the September 15–16 meeting, gold trades the odds, and the odds trade Warsh.
The Dollar At A Three-Month Low And The Treasury Buyback Behind It
The most powerful input into August's gold rally was not an inflation print. It was a debt management decision.
The US Treasury announced it would at least double the size of its liquidity-support buyback operations for longer-dated notes and bonds, running to a minimum of $4 billion per operation from September 9 through November 4 and targeting the 10- to 30-year sector. That announcement pushed the dollar to a more than three-month low last week and remains the reference point every precious metals desk is working from. The operational schedule publishes through Treasury's refunding documentation.
The context that forced the intervention is what gold is actually pricing. The 30-year Treasury bond yield scored a fresh 19-year high on August 17. Japan's 10-year hit a three-decade high the same week. Germany's 30-year bund reached its highest since 2011 and the French 30-year its highest since 2008. National debt crossed $40 trillion, having more than doubled inside a decade.
A government forced to buy back its own long-dated paper while its debt stock passes $40 trillion is the cleanest debasement argument available, and gold is the instrument that trades it most directly. Precious metals have been supported specifically by that trade — protection against the risk of a US debt crisis and a structurally weaker dollar — rather than by any conventional inflation hedge logic.
The dollar's behavior has been the transmission mechanism. Its three-month low last week coincided precisely with gold's run toward $4,696.20 and silver's move above $69. Any firming from here works directly against the metal.
The complication is that the same fiscal anxiety that weakens the dollar also lifts term premium, and rising term premium raises real yields, which is the traditional headwind for a zero-coupon asset. Gold has been trading the currency channel over the real-rate channel throughout August. Whether that continues depends on whether the buyback program successfully caps the long end.
If the buybacks work and long yields compress, both channels turn supportive. If they fail again the way they did on August 20, when the 10-year rose 4 basis points and the 30-year 4 basis points despite the intervention, the two channels fight each other and gold ranges.
Yields At 4.645% And 5.161%: The Real-Rate Arithmetic
The Treasury curve steadied this morning at exactly the right moment for gold.
The benchmark 10-year note yielded 4.645% at 3:05 a.m. ET, down 2 basis points. The 30-year bond sat at 5.161%, also 2 basis points lower. The 2-year nudged 1 basis point lower to 4.211%. That leaves 43.4 basis points between 2s and 10s and 95.0 basis points between 2s and 30s — a steep long end that reflects fiscal risk rather than growth expectations.
Against a 3.3% core PCE reading, the 10-year nominal at 4.645% implies a real yield near 1.35%. On the 30-year at 5.161%, the implied real rate approaches 1.86%. Those are historically elevated real rates for an environment where gold has run 37.15% over twelve months, and the coexistence of the two is the central puzzle in this market.
The textbook relationship says a non-yielding asset should struggle when real yields sit near multi-decade highs. It has not struggled. The reason is that gold in 2026 is not trading as a rate-sensitive instrument. It is trading as a reserve asset and a currency alternative, and both of those functions price off sovereign credit quality rather than the opportunity cost of carry.
The 10-year at 4.68% earlier this month sat in roughly the 96th percentile of its post-2010 distribution. Gold rose 16% in the same month. That divergence is the market telling you which framework is operative.
The nearer-term mechanics still work conventionally. The two-day yield decline into Tuesday — the 10-year fell more than 7 basis points to 4.625% — coincided with gold's push to $4,696.20. The subsequent stabilization near 4.645% has left the metal range-bound. Yields down means gold up on a day-to-day basis even when the medium-term relationship has broken.
The oil channel is the wildcard sitting on top of both. Crude fell for a third consecutive session, easing inflation concerns and reducing the pressure that had been pushing long yields to multiyear highs. WTI for October traded $82.43 after Brent closed Tuesday at $88.58, down 3.9%, with prices off more than 5% on the week.
Falling oil compresses inflation expectations, which lowers the case for a September hike, which supports gold. That chain is currently intact.
Jackson Hole Opens: Warsh's First Symposium Address
The Kansas City Fed's economic policy symposium opens today and runs August 27–29 under the theme "Financial Innovation: Implications for Payments and Policy." Chair Kevin Warsh delivers his address Friday morning. The symposium program is published by the Kansas City Fed.
The expectation heading in is that Warsh does not provide clear guidance on the September decision. That expectation is itself a market condition. If he stays vague, gold holds its range and grinds toward Tuesday's $4,696.20 on drift alone. If he leans hawkish and validates the 38%–40% hike probability, the dollar firms and the metal tests $4,502.80. If he signals patience, the 60% hold probability moves toward 75% and $4,696.20 gives way immediately.
The theme complicates the read. A three-day central banking conference organized around payments innovation and digital money is not structured to deliver a policy signal. Warsh has latitude to spend the entire speech on the architecture of the payments system, and previous chairs have used exactly that latitude at exactly this venue.
The setup he speaks into is unusually loaded. Core PCE at 3.3% against a 2% target. Headline at 3.7%. GDP at 1.5%. A 30-year yield that touched a 19-year high ten days ago. A Treasury department that intervened twice in its own long-bond market this month. A debt stock through $40 trillion. Equity markets that just took a 0.92% futures rally out of a single semiconductor earnings guide.
The reason Warsh specifically matters more than a typical chair is that the hawkish turn under his leadership is what produced the 29% drawdown in gold and silver from their January highs. This market has direct, recent evidence of what his communication does to precious metals pricing, and the memory is nine months old rather than nine years.
Jobless claims arrive first, at 8:30 a.m. ET, with consensus at 209,000 against 206,000 the prior week. A meaningful upside surprise would soften the labor picture and push hold odds higher before Warsh says a word. Data through the Department of Labor.
Read More
-
Yen Stalls at 160 Despite a 3% JGB and Tokyo Core CPI at 2.0% — Intervention Sits at 164, Friday's Payrolls Decide
02.09.2026 · TradingNEWS ArchiveEnergy
-
QQQ ETF ($706.22) Slides 7.4% Below Its High as the Market Reprices the AI Capex Bill — $686.57 Target if $700 Breaks
22.10.2026 · TradingNEWS ArchiveStocks
-
XRPI ($7.00) and XRPR ($10.74) Slide Toward 52-Week Lows as Spot XRP ETF Flows Stall at $708,510
22.10.2026 · TradingNEWS ArchiveCrypto
-
NG ($2.775) Decoupled From Europe’s €88 Gas Crisis as LNG Feedgas Hits 18.9 Bcf/d — $3.30 Upside on Cold Weather
22.10.2026 · TradingNEWS ArchiveCommodities
-
Dollar-Yen (157.35) Loses 157.65 as the Yen Rallies on Haven Demand — 155 Target if 156 Breaks
22.10.2026 · TradingNEWS ArchiveForex
Central Banks Bought 288.9 Tonnes In Q2 — A Record Second Quarter
The structural bid underneath this market has nothing to do with the Fed.
Central banks purchased a net 288.9 tonnes of gold in the second quarter of 2026, a 62% increase year over year and the strongest second quarter on record. That followed 244 tonnes in the first quarter, putting first-half sovereign accumulation above 530 tonnes. Data publishes through the World Gold Council.
The timing is what makes the number significant. Q2 2026 was the quarter gold fell hardest, averaging $4,506 per ounce with spot reaching $4,047 by July 31. Central banks bought a record quarterly amount into that decline. Poland and China remained among the largest official buyers. On the sell side, Russia reduced holdings by 22 tonnes and Turkey — the largest seller in the first quarter — slowed its unloading to 4 tonnes.
The behavioral asymmetry is the whole point. Sovereign reserve managers targeting a tonnage allocation have a mathematical incentive to accelerate purchases when prices fall, because each ounce costs less and moves them closer to a strategic target. They carry no stop-losses and no quarterly performance reporting against a benchmark. ETF holders and rate traders were exiting the same market at the same time on a rate-cut thesis that had evaporated.
Forward intent supports continuation. The 2026 central bank reserves survey published June 16 found that 89% of reserve managers expect global official gold holdings to rise over the next twelve months, and a record 45% of the 76 institutions surveyed plan to add to their own reserves — up from 43% in 2025 and the broadest participation in the survey's nine-year history.
That pace runs at more than double the pre-2022 rate, against a backdrop of record ETF holdings of 4,025 tonnes and a de-dollarization trend measured in decades rather than quarters.
The practical consequence for the price is a floor rather than a ceiling. Sovereign accumulation at this scale does not chase rallies — it absorbs supply into weakness. That is why the June trough near $4,047 held and why the metal is 12.89% higher over the past month. It is also why the January high at $5,602.225 has not been reclaimed: the same buyers who put a floor under $4,000 have no reason to pay $5,600.
ETF Flows, The 942-Tonne Demand Print And China's Physical Bid
The investment side of the ledger has been the drag, and it is starting to turn.
Global gold demand fell to 942 tonnes in the second quarter of 2026, the lowest level since the third quarter of 2021. The decline came from two places: jewellery demand collapsing on affordability at record prices, and investor outflows from gold-backed exchange-traded funds. Physically backed funds recorded 45 tonnes of net outflows during the quarter, concentrated in North American markets.
The pattern held through the first quarter as well. US gold demand softened as a sharp reversal in ETF flows outweighed resilience elsewhere, with sizeable March outflows erasing inflows accumulated earlier in the quarter amid risk-off conditions and elevated positioning. Jewellery demand fell to a record quarterly low. Bar and coin investment provided the partial offset as retail interest held.
That has begun reversing. Gold-backed funds snapped a four-week redemption streak with a $1.1 billion weekly inflow in June, and the largest US physically backed trust recorded approximately $637 million in net inflows on August 7 alone. The cohort that spent the first half of the year exiting on a policy thesis is re-entering on a fiscal one.
The Asian physical channel has been more consistent. China's net gold imports through Hong Kong rose roughly 11% month over month in July, supported by stronger investment demand. Asian buying — driven by geopolitical hedging rather than rate expectations — has been the steadier component of demand throughout the drawdown, with longer holding periods and materially lower sensitivity to Fed policy cycles.
The composition question matters for what happens next. Industrial applications represent approximately 10% of annual gold demand, against 50% or more for silver and copper. That leaves gold's price driven almost entirely by two forces on different time horizons: monetary conviction and the opportunity cost of holding a non-yielding asset.
When those align, moves are sustained and substantial. When they diverge — as they did in the second quarter, with central banks buying a record 288.9 tonnes while ETF holders dumped 45 — the result is the tug-of-war that produced a $4,047 print in July and a $4,696.20 print six weeks later.
August has the two forces aligned for the first time this year.
Silver At $69.34 And A Gold/Silver Ratio Near 66
The white metal is running harder than gold and telling a different story.
Silver climbed toward $69.34 on Thursday, up 1.82% from the previous session, recovering the ground lost Wednesday when it fell toward $68 on the PCE release. Over the past month silver has risen 21.44%. Over twelve months it is up 77.42%.
Compare that to gold's 12.89% monthly gain and 37.15% annual gain and the divergence is stark. Silver has outperformed gold by roughly 8.5 percentage points over the month and 40 percentage points over the year.
The gold/silver ratio at $4,593.74 and $69.34 sits near 66.3. That is a compressed reading by the standards of the past decade and reflects silver's dual identity doing work that gold's monetary function alone cannot.
The industrial leg is the difference. Silver draws demand from photovoltaic solar panel manufacture, electric vehicle production and — increasingly — the electrical infrastructure supporting artificial intelligence data centers. That last channel has grown from a rounding error to a genuine demand vector inside eighteen months, and it scales directly with the capital expenditure numbers coming out of the hyperscalers. Combined hyperscaler capex hit $166.0 billion in the June quarter alone, up 87% year over year.
The supply side compounds it. A 46.3-million-ounce silver deficit is forecast for 2026, extending a structural shortfall that has now persisted across multiple years. Gold has no equivalent — above-ground stock relative to annual mine supply makes a physical gold deficit essentially impossible.
Both metals share the monetary leg. Silver has been supported by the same debasement trade driving gold: protection against a US debt crisis and a weaker dollar, with the Treasury buyback expansion as the proximate catalyst.
Both also share the drawdown history. Gold and silver each shed roughly 29% from their January highs as policy expectations reset under the new Fed leadership.
The implication for gold traders is directional confirmation. Silver leading on the upside is characteristic of precious metals rallies with genuine breadth rather than defensive rotation. Silver leading on the downside is the standard warning. Right now it is leading up by a wide margin, which supports the case that August's move in gold has substance behind it rather than positioning.
Miners: GDX At $104.25 With Newmont Realizing $4,414 Against $1,621 AISC
The equity expression of this trade has been running hot and still lags the metal on a cycle basis.
The VanEck Gold Miners ETF closed Wednesday at $104.25 after trading a $101.66 to $105.71 range on volume of 26.04 million shares against a 27.03 million average. The 52-week range runs $60.44 to $117.18, leaving the fund 11.0% below its high and 72.5% above its low.
The fundamental case underneath that is the margin arithmetic, and it is the strongest in the sector's modern history. Newmont realized $4,414 per ounce on gold in the second quarter against byproduct all-in sustaining costs of $1,621 — a spread of $2,793 per ounce, or a 63.3% margin. That drove a record $2.2 billion in quarterly free cash flow on a 33% year-over-year gain in realized gold price. Agnico Eagle Mines generated $1.3 billion in second-quarter free cash flow at $1,459 AISC. Both held inside full-year cost guidance.
Concentration means those two names drive the fund. Newmont carries roughly 10.37% of assets and Agnico 10.12%, with Barrick at 6.01% and the top ten positions accounting for 56.30%. Fees run 0.51% and the fund carries a beta of 0.67 against the broad market.
The leverage assumption is where the miners have disappointed. Theory says producers amplify the metal's move roughly two-to-one because incremental ounces flow straight to margin. Practice in 2026 has delivered less than that. Mature production profiles, dividend commitments and hedging programs at the majors weaken the pass-through, and management teams have reinvested and repurchased shares rather than aggressively compounding reserves. The fund trades at a price-to-earnings ratio near 16 with the metal at historically elevated levels.
The risk case is specific and quantifiable. A pullback to $4,000 gold alongside WTI above $95 would erase the margin expansion story quickly — energy is a direct input into AISC, and a $600 decline in realized price against rising diesel and power costs compresses the spread from both ends simultaneously.
Neither condition is currently in place. Gold sits at $4,593.74 and WTI at $82.43 after three consecutive down sessions. Producer margins are expanding, not contracting.
Technical Structure: $4,502.80 Below, $4,645.91 And $4,696.20 Above
The levels that matter are tightly clustered and the market is sitting between them.
Below spot, the first line is $4,607.18 as horizontal support, backed almost immediately by the 100-period simple moving average on the hourly chart at $4,606.20. Those two overlapping within $1 of each other creates a genuine shelf. Beneath that, the ascending channel's lower boundary sits at $4,610–$4,615, and a consolidated break below $4,610 would signal increasing selling pressure and invalidate the bullish channel structure.
The deeper level is the 200-period SMA at $4,502.80. Price holding above it is what keeps the medium-term uptrend technically intact even after the ascending trendline broke earlier this week. A move through $4,502.80 would be the first structural failure of the August advance.
Above spot, resistance stacks in three tiers. $4,645.91 has produced Doji and Spinning Top candlestick formations — indecision patterns that mark a level the market cannot resolve. $4,665 is the local resistance whose reclaim on a consolidated basis would signal the current correction is complete and buying pressure is returning. $4,696.20 is Tuesday's three-month high and the hard ceiling.
The consolidation range being priced for today runs $4,576.74 to $4,698.44, with the metal able to move either direction inside it. That is a $121.70 band, or 2.6% of the price — wide enough to trade, narrow enough to confirm the market is waiting.
Momentum readings support the stall rather than a reversal. The hourly RSI near 41.00 shows waning upside momentum, indicating bulls need fresh input to challenge overhead barriers decisively. MACD has been declining in negative territory. On the higher timeframe, price holds above both the 50-period and 200-period moving averages with RSI back above its signal line.
The larger structure remains defined by January. The all-time high at $5,602.225 from January 29 sits 21.9% above current spot. The six-month return of negative 10.89% against a twelve-month return of positive 37.15% describes a market that peaked hard, corrected hard and has spent August recovering roughly half of what the drawdown took.
The trend is up on the month and down on the half-year. Both are true, and $4,696.20 is the level that decides which one is still operative.
Oil, Iran And The Inflation Channel That Cuts Both Ways
The energy market is the mechanism that connects geopolitics to gold, and it has been running in gold's favor for a week.
Crude fell for a third consecutive session, easing inflation concerns and supporting the case for the metal. WTI for October delivery traded $82.43 after Brent settled Tuesday at $88.58, down 3.9%, with WTI losing 3.1% to $82.36 the same session. Prices are off more than 5% across the week.
The driver has been de-escalation rather than demand destruction. The US unveiled a fresh raft of sanctions on Iran and on entities continuing to trade with it, and Iran resumed talks with neighboring Oman on managing the Strait of Hormuz amid mounting economic pressure. Those talks removed the tail risk that had priced Brent near $91 on August 18, when the Strategic Petroleum Reserve fell to its lowest level since 1982.
The transmission to gold runs through inflation expectations. Falling oil compresses the inflation path, which reduces the case for a September hike, which raises the 60% hold probability, which lowers the opportunity cost of holding bullion. That chain has been intact for a week and it is a meaningful component of the 16% August advance.
The chain also runs in reverse, and that is the risk nobody is pricing. Renewed escalation that threatens energy supply through Hormuz would generate two opposing effects simultaneously. Safe-haven demand for gold rises immediately. Then sharply higher crude revives inflation concerns, pushes the Fed hawkish, lifts real yields and the dollar, and works against the metal within days.
That is precisely the dynamic that governed the first half of 2026. The initial US-Iran conflict created sustained geopolitical uncertainty that failed to lift gold, because oil, inflation, yields and the dollar were all elevated at the same time. Geopolitical risk only helps gold when it does not come attached to an energy shock.
The current configuration is the favorable one: unresolved Middle East tension providing a persistent bid, without the crude price that would flip the Fed hawkish. Uncertainty around the conflict and shipping through strategically important waterways continues to generate safe-haven demand.
Focus today sits on Middle East developments and the jobless claims number. Both feed the same equation.
What Would Break The Range In Either Direction
The scenarios divide cleanly and each has a specific trigger.
Upside: jobless claims come in materially above the 209,000 consensus, softening the labor picture and pushing September hold probability from 60% toward 70%. Warsh declines to validate the hawkish case Friday. The dollar resumes its slide toward last week's three-month low. Gold reclaims $4,645.91, then $4,665, then attacks $4,696.20. Above that, the path opens toward $4,800 with limited technical resistance until the levels that produced the January distribution.
That scenario has structural support behind it. Central banks bought a record 288.9 tonnes in the second quarter and 244 tonnes in the first, with 89% of reserve managers expecting global official holdings to rise over the next twelve months and a record 45% planning to add to their own. ETF flows have turned, with a four-week redemption streak broken in June and a single-day $637 million inflow into the largest US trust on August 7. Silver up 21.44% on the month confirms breadth.
Downside: claims come in at or below 206,000, confirming a labor market with almost no involuntary separations. Warsh validates the 38%–40% hike probability Friday. The dollar firms. Gold breaks $4,610 and the ascending channel, then loses the $4,606.20–$4,607.18 shelf, and tests the 200-period SMA at $4,502.80.
That scenario has its own evidence. Core PCE at 3.3% has not moved in two months. Headline accelerated to 3.7% against a 3.6% forecast. Durable goods beat by more than double. Trend-following length is already extended and the scope for further systematic buying from here is minimal. The metal failed at $4,696.20 on Tuesday and has printed two consecutive lower closes since.
The base case sits between them: continued consolidation inside $4,576.74 to $4,698.44 through Friday morning, with the resolution deferred to the speech. Two prior sessions have already shown the market unwilling to commit — Tuesday's failed high, Wednesday's 1.38% give-back, this morning's erased Asian gain.
Gold has run 16% in a month into a resistance level it cannot clear and a Fed communication it cannot handicap. That is a market waiting, not a market deciding.
Forecast And Verdict: $4,696.20 Is The Number, $4,502.80 Is The Line
Constructive, extended and unresolved. That is the honest read on XAU/USD at $4,593.74 spot and $4,648.90 on December futures.
The bull case is structural and it is the stronger of the two on any horizon beyond a month. Central banks bought a record second quarter at 288.9 tonnes, up 62% year over year, into the exact price decline that drove ETF holders out — a 45-tonne outflow in the same period. First-half sovereign accumulation cleared 530 tonnes at more than double the pre-2022 pace. Record ETF holdings of 4,025 tonnes sit on the books. Chinese imports through Hong Kong rose 11% month over month in July. The Treasury is buying back its own long bonds while federal debt runs past $40 trillion. Silver at $69.34 is up 77.42% year over year and confirming.
The bear case is tactical and immediate. The metal has run 16% from near $4,000 in a single month and failed at $4,696.20. Hourly RSI at 41.00 shows momentum draining. The ascending trendline has already broken. Systematic length is close to maxed and discretionary desks are on the sidelines. Core PCE at 3.3% has not budged in two months and headline accelerated to 3.7%. September hike probability sits near 38%–40% and the chair who drove gold down 29% from its January high speaks Friday.
The levels are precise. $4,645.91 is the first test — the level that has produced Doji and Spinning Top indecision patterns and needs to clear on a close. $4,665 confirms the correction has ended. $4,696.20 is Tuesday's high and the gateway to $4,800 and beyond, with the January all-time high at $5,602.225 sitting 21.9% above spot as the eventual objective if the fiscal trade extends into the fourth quarter.
Downside: $4,610 breaks the channel. $4,606.20 and $4,607.18 are the overlapping shelf. $4,502.80 is the 200-period line and the level that would mark August's advance as a failed rally rather than a trend continuation. Below that, the $4,400 zone and the July trough near $4,047 come back into frame.
Call it a hold-and-wait tape with an upward structural bias. Gold closes this week where Warsh puts it, and the range from $4,502.80 to $4,696.20 is wide enough to absorb whatever he says without resolving anything.





