





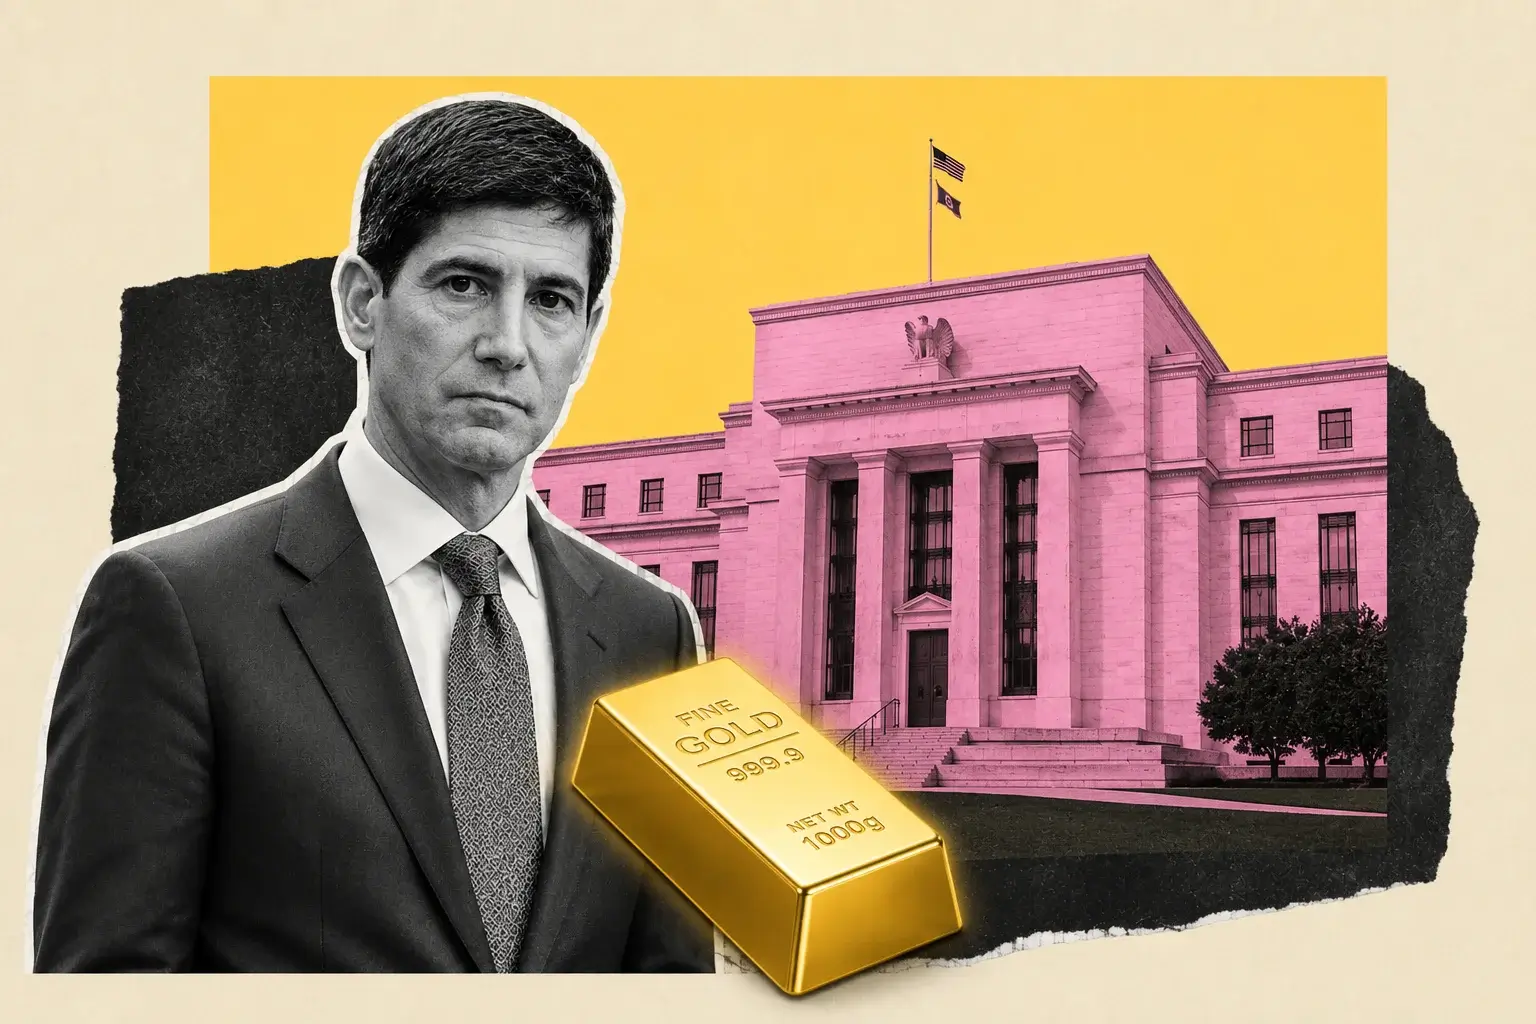
Gold Holds $4,370 After Failing Twice At $4,500 — Central Banks Bought 289 Tonnes Into a 22% Drawdown
XAU/USD touched a 2-month high of $4,449.39 Thursday before closing down 1.3% at $4,350.88 | That's TradingNEWS
Key Points
- Gold trades $4,370.90 after rejecting twice at $4,500 and printing a weekly low of $4,311
- Central banks bought 288.9 tonnes in Q2, up 62%, while gold fell 22% on the quarter
- Fed September hold odds hit 69.4%, up from 42% one month ago, on cooling CPI and PPI
Spot gold traded $4,370.90 at 8:01 a.m. ET Friday, up $20.60 or 0.47% on the session, inside a daily range of $4,310.20 to $4,373.90. The metal opened the day negative, printed a fresh weekly low at $4,311, then reversed and clawed back everything before the New York bell. December futures opened at $4,408.20, down 0.3% from Thursday's settle, and ticked to $4,419.60 by 7:54 a.m.
That recovery matters less than what happened above it. Thursday's session produced the highest print since June 5 at $4,449.39 before the tape rolled over and closed down 1.3% at $4,350.88, with an intraday low of $4,343.79. December COMEX futures ran to $4,509.10 intraday and settled at $4,420.40, down 1.1%. Wednesday told the same story: futures touched $4,502 and closed near $4,469.
Two separate assaults on $4,500 within 48 hours, two rejections. That is not noise — that is a level with real supply behind it, and until it clears, every rally into $4,450 gets sold by holders who bought higher and are still working out of positions.
The month has been strong regardless. Gold carries a gain of over 10% across the past 30 days, roughly 33% year over year, and about 4% on the week. It opened above $4,400 for four consecutive sessions before Thursday's reversal snapped the run. July delivered a 0.5% monthly gain, the first monthly advance since February.
Context frames how far this market has traveled in both directions. The all-time high sits at $5,595 from January 29, with the broader 52-week range running $3,311.46 to $5,595.46. The second quarter produced a 22% to 24% decline, the worst quarterly performance since 2013. The June 11 intraday low of $4,023.95 marked the weakest level since November 2025 and left the metal roughly 26% below the record.
Silver tracked the same pattern. September futures opened at $64.63, down 0.6%, then recovered to $65.14 by 8:03 a.m. Spot silver sits at $64.27, off 0.24%, up 11.31% over the past month and 69.08% year over year. Wednesday's spot print of $65.49 marked the highest since June 22.
The $4,449 Rejection Was Buy The Rumor, Sell The Fact
The sequence into Thursday's reversal is instructive because it inverts the standard reaction function. Gold rallied hard into the CPI and PPI releases, cleared the 100-day simple moving average at $4,387.22, and then sold off after both prints came in supportive.
Wednesday's consumer price report showed inflation at 3.4% over the twelve months through July, down from 3.5% in June and rising just 0.1% on the month. Spot gold added 0.9% to $4,406.64 on that data, with US futures settling 0.6% higher at $4,467.50. Thursday's producer price index printed flat against a 0.2% consensus, with annual wholesale inflation cooling to 4.7% from 5.5%, per the BLS final demand release. Core PPI rose 0.2% against a 0.3% forecast.
Both readings reduce the case for a September Federal Reserve hike. Both should have extended the rally. Gold fell 1.3% instead.
The explanation is positioning rather than macro. The metal had run into the data with the fastest four-day advance since June, and the $4,500 handle sits directly beneath a wall of supply left by every buyer who accumulated during the January-through-March distribution. When the catalyst arrived and price failed to clear resistance on the first attempt, profit-taking cascaded through the COMEX session and dragged spot with it.
There is a structural version of the same point. Roughly 298 tonnes of gold sitting inside ETFs was held at a loss when price traded near $4,000, up from 270 tonnes when the metal was above $4,250. Those are not long-horizon allocators. They are positions waiting for a level to exit at. Every dollar of recovery toward their entry prices converts latent overhang into actual selling.
That dynamic caps rallies without breaking the trend. Gold has been building higher lows since June while failing at progressively similar highs — a compression pattern that resolves violently once the trapped supply clears. The question is whether it clears through absorption or through another leg lower that forces capitulation.
September Hike Odds Fell From 50% To 30.6% In A Month
The single largest change in gold's macro backdrop since mid-July is the collapse in September tightening probability. CME FedWatch now prices a 69.4% chance the Federal Reserve holds at 3.50%–3.75% next month, with 30.6% still expecting an increase.
A month ago that distribution was inverted: 42% expected a hold, 50% expected a 25 basis point increase and 8% priced a 50 basis point move. Intermediate readings track the path — roughly 55% hike probability a week earlier, near 50% before CPI, 40% after CPI, then 34% to 35% after PPI.
Gold responds directly to this because the metal pays no interest. A rising policy rate raises the opportunity cost of holding bullion and pulls capital toward Treasury bills. A hold does the opposite. The move from a 58% hike probability to a 30.6% hike probability is worth several hundred dollars of fair value on any standard real-rate framework.
The Fed has now held for five consecutive meetings under Chair Warsh. The July decision split 9-3, with three members dissenting in favor of an immediate 25 basis point increase. That dissent bloc has not disappeared, and hawkish commentary has continued in speeches since. Two more data points arrive before the September FOMC — August payrolls and August CPI — and the decision effectively belongs to them.
That is the asymmetry gold is trading. If August inflation re-accelerates, the hike returns to the table and the metal loses the entire premium it has built since late July. If August payrolls deteriorate on top of a 0.6% retail sales decline, the market starts pricing cuts rather than holds and $4,500 breaks on the first attempt.
The structure is described accurately as win-win only in the sense that both stagflation and disinflation-with-slowdown support the metal. What does not support it is the current in-between state: inflation at 3.4%, growth decelerating but not contracting, and a central bank pinned at a level that satisfies neither camp.
The 10-Year At 4.660% Is The Ceiling On This Rally
Bullion's problem is not the front end of the curve. It is the long end. The 10-year Treasury yield sits at 4.660% after easing from roughly 4.68% post-PPI, and Treasury sold 10-year notes this week at 4.683% — the highest auction stop since the global financial crisis.
That level exists because inflation runs 140 basis points above the 2% target while deficits widen, and buyers demand compensation for both. It is not a function of Fed policy expectations at all. Long yields have stayed elevated through every dovish repricing of the past six weeks.
The mechanism working against gold is real yields. With headline CPI at 3.4% and the nominal 10-year at 4.660%, the real 10-year sits near 1.26% — positive, and positive real rates are the historical enemy of non-yielding assets. The metal has rallied 10% in a month despite that, which says the safe-haven and central-bank bids are overwhelming the carry math, not that the carry math has improved.
The dollar index at 99.60 is the second constraint. It has softened enough to give gold room, and Friday's advance came partly on renewed dollar weakness after the retail sales miss. But a DXY that holds 99 rather than breaking toward 95 limits how much of the move comes free.
The setup that would flip both variables simultaneously is a growth scare. Falling nominal yields plus a falling dollar plus a Fed pivot toward cuts is the configuration that produced the January run to $5,595. Nothing in the current data set delivers all three.
What the market has instead is a central bank comfortable letting the bond market do the tightening. Long-dated yields near cycle highs are the enforcement mechanism, and they enforce against gold as much as against equities. Until the 10-year breaks below 4.40%, the ceiling on this rally stays where it is.
Retail Sales At -0.6% Added The Growth Leg To The Stagflation Trade
July retail and food services sales came in at $763.6 billion, down 0.6% from June against consensus for a 0.1% gain, per the Census Bureau advance estimate. That is the steepest monthly decline in more than a year. Excluding autos, sales fell 0.3% against a forecast 0.2% gain. The control group that maps to GDP consumption fell 0.4% against expectations for a 0.3% increase.
Year-over-year growth decelerated to 5.0% from a revised 7.3% in May and 6.7% in June — 230 basis points of deceleration in three months. The three-month average from May through July ran 6.3%.
Gold caught a bid off that print and reversed its early weakness, closing the gap back toward $4,370. The logic is direct: a consumer that has stopped spending removes the growth support for the hawkish case, which pulls the September hike further off the table and eventually opens the door to cuts.
The generous tax refunds that cushioned households against Middle East-driven gasoline prices in the second quarter have been spent. Consumer spending grew at a 3.2% annualized rate in Q2 while the overall economy expanded at just 1.5% — a gap that was never sustainable and has now started closing from the wrong direction.
The University of Michigan preliminary August sentiment reading lands at 10:00 a.m. ET, expected at 54.1 against July's final 55.2. Year-ahead inflation expectations are forecast to hold at 4.2%, with the five-to-ten-year measure at 3.3%. Those expectation readings matter more for gold than the headline index — a household sector that expects 4.2% inflation twelve months out while the Fed holds at 3.50%–3.75% is a household sector pricing negative real returns on cash.
Slowing growth plus elevated price expectations is the definition of the environment gold outperforms in. What is missing is the confirmation that the Fed will respond to the growth side rather than the price side. That confirmation arrives with August payrolls in early September.
Central Banks Bought 289 Tonnes In Q2 While Price Fell 22%
The most important number in the gold market this quarter has nothing to do with the chart. Central banks added a net 288.9 tonnes in the second quarter, a 62% increase from 177.9 tonnes in Q2 2025 and the strongest second quarter in the data series, per the World Gold Council's Gold Demand Trends report.
They did that while gold posted its worst quarterly decline since 2013. Reserve managers accelerated purchases into a 22% drawdown. That is the opposite of how speculative capital behaves, and it is the single strongest argument against the thesis that January's $5,595 marked a cycle top rather than a speculative overshoot within a structural bull market.
To calibrate: 289 tonnes in one quarter exceeds the total net gold ETF flows recorded anywhere in the world across all of 2023. Central banks bought 6.4 times more gold in Q2 than ETF holders sold.
The recovery from Q1 was dramatic — first-quarter net accumulation was revised down to 57 tonnes, meaning Q2 represented more than a five-fold increase. Full first-half demand of 345 tonnes was still the lowest H1 total since 2022, when the figure was 241 tonnes, dragged down by heavy sales from Turkey, Russia and Azerbaijan.
The forward signal is unambiguous. The World Gold Council's Central Bank Gold Reserves Survey found 89% of reserve managers expect to increase gold holdings over the next twelve months, citing reserve diversification and protection against geopolitical risk.
This is the layer of the market that did not reprice during the correction. What repriced was everything above it — Fed expectations, real yields, the dollar and fund positioning, all reset within a single trading week in early June. The official-sector bid stayed net positive throughout at a pace above its five-year average.
That distinction defines the downside. Speculative flows set the marginal price on any given day. Official-sector flows set the floor over quarters. The floor has not moved.
Poland At 632 Tonnes And The PBoC At 2,346 Tonnes
The composition of official-sector buying matters because it tells you whether this is a broad reserve-diversification trend or two large buyers doing all the work.
The National Bank of Poland was the largest purchaser in Q2, adding 51 tonnes to bring reserves to 632 tonnes at end-June. Combined with 31 tonnes in Q1, Poland accumulated 82 tonnes in the first half, moving toward a self-set target of roughly 700 tonnes. That leaves 68 tonnes of announced buying still to execute — a mandate, not a market call.
The People's Bank of China added 33 tonnes in Q2, its largest quarterly addition since Q4 2023 when it took 44 tonnes. The first-half increase of 40 tonnes brings reported holdings to 2,346 tonnes. World Gold Council analysis flagged elevated undeclared imports into London consistent with additional Chinese accumulation not appearing in official tallies — meaning the reported figure understates actual absorption.
Beyond the two anchors, buying was distributed: Uzbekistan 16 tonnes, Kazakhstan 15 tonnes, Jordan 6 tonnes, the Czech Republic 6 tonnes. The UAE led Middle East investment demand, surging 34% quarter over quarter and 30% year over year to 5.3 tonnes.
On the sell side, the Bank of Russia moved 22 tonnes, reportedly to help plug a federal budget deficit. Turkey — the largest seller in Q1 — slowed dramatically to 4 tonnes. That deceleration in official-sector selling is as meaningful as the acceleration in buying, because it removes a supply source that suppressed the H1 net figure.
Total gold supply held at 1,269 tonnes in Q2, with a 2% year-over-year increase in mine production offsetting a 6% decline in recycling. Lower quarterly prices discouraged the sale of old jewellery back into the market, which is a self-correcting supply mechanism: falling prices reduce scrap supply, which tightens the physical balance, which supports prices.
Mine production has limited growth potential from here and recycling is price-elastic in the wrong direction. On the supply side, this market is structurally tight regardless of what fund positioning does.
ETF Redemptions Of 45 Tonnes Are The Missing Buyer
The swing factor in 2026 has been the Western ETF channel, and it has swung negative. Gold-backed exchange-traded funds recorded net redemptions of 45 tonnes across the second quarter, concentrated particularly in North America, driven by falling prices, a stronger dollar and elevated inflation and rate expectations.
The scale of the reversal is what matters. Gold ETFs recorded $72 billion of global inflows across 2025, a full-year record, led by North America at $43 billion. In May 2026, global gold ETF assets fell 2% month over month to $604 billion, holdings slipped to 4,121 tonnes, and physically backed products logged $2 billion in outflows. Asian funds posted their first monthly outflow since August 2025 at $1.2 billion, even as European funds kept attracting capital. Year-to-date inflows still stood near $17 billion, so the channel cooled rather than collapsed.
There have been snapbacks. A $1.1 billion inflow week broke a four-week redemption streak in late June, and momentum has improved through the August rally. But the aggregate picture is a demand channel running at a fraction of last year's pace at exactly the moment central banks accelerated.
This is the piece that determines whether gold reaches the upper end of forecast ranges. Central bank buying establishes a floor. It does not produce the price velocity that took the metal from $2,900 to $5,595 in fifteen months. That required Western financial demand layered on top of the official-sector bid, and Western financial demand has been net negative for most of 2026.
Total demand held broadly flat year over year at 1,269 tonnes in Q2, with first-half demand reaching 2,522 tonnes, up 2%. Measured by value, first-half demand hit a record $380 billion. The market is absorbing the same physical volume at dramatically higher prices — which is why the correction stopped at $4,024 rather than continuing toward $3,500.
Watch weekly ETF flow data over the next month. Sustained positive inflows alongside the current central-bank pace is the only configuration that clears $4,500.
Jewellery At 278 Tonnes Is The Demand Destruction Nobody Prices
The cost of a $4,400 gold price shows up in jewellery, and the number is severe. Global jewellery demand fell to 278 tonnes in the second quarter, one of the weakest quarterly readings on record, as high prices curbed consumer purchases across every major market.
That matters structurally because jewellery historically accounted for the largest share of annual gold demand. Its collapse means the composition of the market has fundamentally changed: gold is now priced by reserve managers and financial allocators rather than by Indian wedding season and Chinese festival buying. That makes the price more sensitive to rate expectations and less anchored by physical consumption.
Retail investment told the opposite story. Worldwide bar and coin demand came in at 307 tonnes, a decline of just 3% year over year despite a 14% price decline during the quarter. That stability during a drawdown says physical retail buyers operate on a horizon closer to central banks than to ETF holders. In many markets, price declines actively stimulate accumulation.
Bar and coin demand at 307 tonnes now exceeds jewellery at 278 tonnes — an inversion that would have been unthinkable five years ago. The World Gold Council attributes a significant portion of Q2 over-the-counter demand to Asian private buyers who prefer direct physical ownership over exchange-traded exposure, a channel that receives far less coverage than ETF flows despite representing a larger and more consistent source of absorption.
The forward view from the same data set is that investment remains the primary driver of demand growth through the second half, supported increasingly by OTC activity and Asian buying. Central banks stay on course for another strong year, though likely below 2025. Jewellery volumes stay under pressure. Mine production and recycling offer only modest growth.
Strip that down and the demand equation reduces to two variables: whether official-sector buying holds near 289 tonnes per quarter, and whether Western ETF flows turn. The first looks locked. The second is the open question.
Read More
-
Yen Stalls at 160 Despite a 3% JGB and Tokyo Core CPI at 2.0% — Intervention Sits at 164, Friday's Payrolls Decide
02.09.2026 · TradingNEWS ArchiveEnergy
-
QQQ ETF ($706.22) Slides 7.4% Below Its High as the Market Reprices the AI Capex Bill — $686.57 Target if $700 Breaks
22.10.2026 · TradingNEWS ArchiveStocks
-
XRPI ($7.00) and XRPR ($10.74) Slide Toward 52-Week Lows as Spot XRP ETF Flows Stall at $708,510
22.10.2026 · TradingNEWS ArchiveCrypto
-
NG ($2.775) Decoupled From Europe’s €88 Gas Crisis as LNG Feedgas Hits 18.9 Bcf/d — $3.30 Upside on Cold Weather
22.10.2026 · TradingNEWS ArchiveCommodities
-
Dollar-Yen (157.35) Loses 157.65 as the Yen Rallies on Haven Demand — 155 Target if 156 Breaks
22.10.2026 · TradingNEWS ArchiveForex
Hormuz, $82 Crude And The Geopolitical Bid Under $4,300
Crude climbed above $82 a barrel Friday morning after settling at $81.25 Thursday, with Brent at $89.53 against a Thursday close of $87.07. The catalyst was the UAE accusing Iran of attacking two ADNOC-linked vessels transiting the Strait of Hormuz Thursday evening. Crude finished the week roughly 5% higher despite Thursday's 2%-plus decline.
Gold's relationship with this conflict has been inconsistent, and that inconsistency is the key to trading it. Early in the year, the war drove oil and inflation expectations higher, which shifted the market toward pricing a more hawkish Fed and higher real rates — both of which crushed the metal. Rising oil was bearish gold, not bullish, because the transmission ran through the policy rate rather than through safe-haven demand.
That mechanism has weakened as the inflation shock faded. July energy prices fell 1.5% within CPI following a 5.7% June decline, and gasoline dropped 5.7% inside the PPI goods component. With energy no longer pushing the headline higher, the geopolitical premium reverts to functioning as a straightforward safe-haven bid.
The escalation risk is live. Iran maintains an effective blockade of the strait, which carries about 20% of seaborne global oil, and established a Persian Gulf Strait Authority in May claiming no vessel may pass without a permit it issues. The US is sending another carrier group to replace the USS Abraham Lincoln. Diplomatic progress toward reopening has been minimal, with rhetoric hardening on both sides and attacks on shipping continuing.
That backdrop is what keeps a floor under $4,300 regardless of what the rate path does. A genuine escalation — infrastructure strikes, a full closure, or direct confrontation — takes gold through $4,500 in a session. The opposite scenario, a durable deal that reopens the strait, removes the premium and exposes the $4,074–$4,112 pivot zone.
The market is currently pricing neither outcome with conviction, which is why gold keeps oscillating in a $200 band. That band breaks when the geopolitical picture resolves in either direction.
Silver At $64.27 And A Gold/Silver Ratio Of 67.9
Silver is the leverage trade on the same thesis and it has behaved accordingly. Spot sits at $64.27, off 0.24%, after Wednesday's 1.3% advance to $65.49 marked the highest level since June 22. September futures opened at $64.63, down 0.6%, then recovered to $65.14. COMEX silver traded $65.58 Thursday within a $66.45 to $65.22 range.
The performance spread tells the story. Silver is up 11.31% over the past month against gold's roughly 10%, and 69.08% year over year against gold's 33%. Over a longer window, silver prices have more than tripled despite a recent selloff, with year-over-year growth hitting 173.3% as recently as mid-May.
The gold/silver ratio at 67.9 sits well below the multi-decade average near 70 and dramatically below the 90-plus readings that characterized 2024. A compressing ratio is the classic signature of a late-stage precious metals advance, where industrial and speculative demand pull the higher-beta metal faster than the monetary metal.
Silver's dual identity — monetary hedge plus industrial input — makes it more sensitive to the growth data than gold is. A 0.6% retail sales decline that supports gold on rate-path logic is ambiguous for silver, because industrial demand tracks manufacturing activity. That is why silver slipped Friday while gold rose.
The technical read matches. Silver approached $85 during the January blowoff and has spent the year rebuilding from a far deeper drawdown than gold experienced. Reclaiming $66.45 opens the June range. Losing $64 exposes the low $60s.
For anyone using the ratio as a positioning tool, 67.9 is neither cheap nor expensive relative to where this cycle has traded. It stops being a signal and starts being noise until it breaks 65 or 75.
GDX Up 21% In Five Days On 70% Margins And $1,680 AISC
The equity complex has torn ahead of the metal, which is the standard pattern when the market believes a gold price level is durable rather than transient.
The VanEck Gold Miners ETF rose 21.09% over a recent five-day stretch to $89.73, with the junior fund climbing 22.42% to $116.78. Agnico Eagle gained 22.92% to C$250.17, Newmont advanced 20.55% to $112.97, and Barrick climbed 19.22% to C$61.34. GDX added 7% in a single session on Q2 earnings.
The economics behind that move are extraordinary. Sector leaders are running approximately 70% operating margins against the 20% to 30% range that defined the decade when gold traded between $1,700 and $2,000. Newmont delivered record free cash flow and Agnico Eagle record operating margins in Q2, both on realized gold prices north of $4,400 per ounce. Cash flow generation across the group now rivals large-cap technology, and it has funded a wave of dividend increases and buybacks.
Costs are the offsetting pressure. Newmont reported all-in sustaining costs of approximately $1,680 per ounce in 2026, up sharply from roughly $1,400 two years earlier, with labor and energy inflation the primary drivers. The company designated 2026 a trough year for production, guiding attributable output down to 5.3 million ounces from nearly 6 million, attributed to a sequencing reset at Boddington and technical delays in Nevada. Miners are earning more while producing less.
The structural overhang cleared in July. Barrick reached an agreement with Newmont resolving all Nevada Gold Mines disputes, with both parties vending in excluded properties early — Fourmile from Barrick, Mike and Fiberline from Newmont — creating a complex approaching 100 million ounces. Newmont pays Barrick a $1.95 billion cash top-up within thirty days and has consented to Barrick's IPO of its North American assets, per the Q2 filing. Barrick posted quarterly EPS of $0.73 and adjusted EPS of $0.82, up 55% and 74% year over year.
Even at $4,370 gold with $1,680 AISC, the spread is $2,690 per ounce. The equities are pricing that spread persisting. If gold breaks $4,074, the multiple compression is brutal.
Gold Price Forecast: The Levels From $4,074 To $4,645
The technical map is well-defined and the decision points are tight.
Immediate resistance sits at Thursday's high of $4,449.39. Above that, $4,500 is the level that has now rejected two separate attempts within 48 hours and represents the hard ceiling on this leg. COMEX futures reached $4,509.10 and $4,502 on consecutive days and failed both times. Clearing $4,500 on a daily close opens $4,645 as the upper end of the August projected range.
Support is layered. The 100-day simple moving average at $4,386 has flipped from resistance to the first line of defense — gold crossed above it Wednesday and needs to hold it. Below that, Friday's low at $4,311 and the 2026 yearly open at $4,312–$4,319 form a cluster that also aligns with the 52-week moving average. The 20-day SMA at $4,173 forms the Bollinger middle band. The structural floor is the $4,074–$4,112 pivot zone, defined by the 61.8% retracement of the March decline, the March low and the October high-week reversal close. That zone contained six straight weeks of consolidation through July.
The base case is continued range trading between $4,300 and $4,500 into the September FOMC. This requires no resolution on Hormuz and no surprise in August payrolls or CPI. Month-end projections cluster in the $4,084 to $4,121 band on the bearish read and toward $4,645 on the bullish extension, with the full August range framed at $3,580 to $4,646.
The bull case needs three things: a daily close above $4,500, Western ETF flows turning decisively positive alongside the 289-tonne quarterly central bank pace, and September hike odds falling below 20%. That sequence targets $4,900 to $5,200, where the bulk of institutional year-end forecasts sit. The most aggressive desk targets run to $6,100–$6,300.
The bear case triggers on a September hike. Losing $4,386 exposes $4,312, then $4,173, then the $4,074–$4,112 pivot. Below that the technical extension runs toward $3,800, and the January record starts looking like an exhaustion point rather than a waypoint.
Gold at $4,370.90 sits 21.9% below its all-time high, 8.6% above the June low, and roughly $130 below the level that determines whether this is a recovery or a bear-market rally. The physical market says floor. The rates market says ceiling. September resolves it.





