





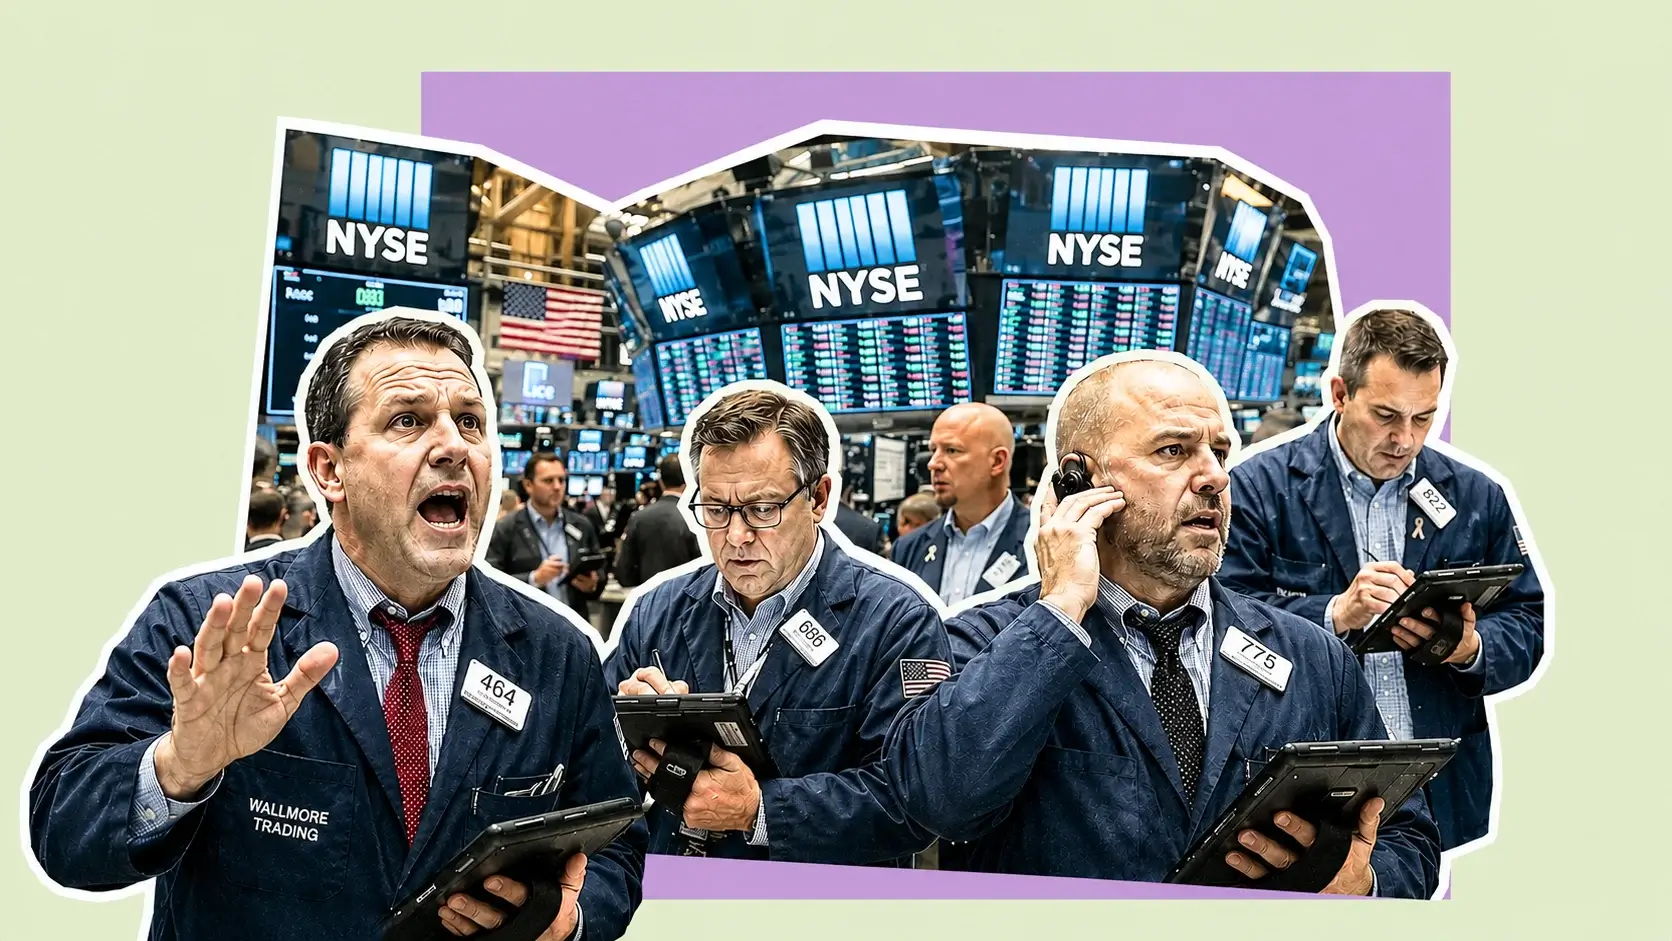
S&P 500 Holds 7,798.99 Record After Retail Sales Crater 0.6% — Rips 12%, Applied Materials Sinks to $508.30
The S&P 500 cleared 7,800 for the first time Thursday, gaining 0.65% | That's TraidngNEWS
Key Points
- July retail sales fell 0.6% to $763.6 billion against consensus for a 0.1% gain
- Reddit surged 12.9% premarket ahead of joining the S&P 500 on August 18
- Applied Materials dropped 4.9% to $508.30 despite record $9.12 billion revenue
The S&P 500 closed Thursday at 7,798.99, up 50.49 points or 0.65%, after punching through 7,800 intraday for the first time in its history. The Nasdaq Composite ripped 0.81% to 26,803.03. The Dow Jones Industrial Average added 69.72 points, or 0.13%, to 53,839.99, its first green session in four. That was the setup heading into Friday: two straight up days for the S&P 500 and Nasdaq, the first back-to-back since August 4, and the best single session for the broad index since the same date.
Then 8:30 a.m. happened. July retail sales came in at $763.6 billion, down 0.6% from June — against consensus for a gain of roughly 0.1%. The forecast range ran from a 0.5% decline to a 0.7% increase, so the print landed at the ugly end of the distribution. Futures barely flinched. S&P 500 futures sat near 7,827.00, up 1.75 points. Dow futures were down 96.84 at 53,863.16. Nasdaq-100 futures held 30,229.25, up 13.04. That non-reaction is the story of this tape.
The VIX closed Thursday at 14.52, down 0.11 or 0.75%. Gold futures held 4,419.40 after settling near 4,431.80. Bitcoin got smoked relative to equities, trading 62,743.02, off 675.14 or 1.06%. WTI for September delivery changed hands at 81.27 after settling at 81.25 Thursday, a 2%-plus decline that helped drag the inflation narrative lower. Brent printed 89.53 early Friday against a Thursday settle of 87.07.
The index has now logged 25-plus record closes in 2026 and sits roughly 13.5% higher on the year. It gained 3.6% in the week ending August 7 alone, closing that stretch at 7,757.64. From the end of the first quarter, the S&P 500 has tacked on about a quarter of its value. The Nasdaq fell nearly 10% from its June peak into late July, then rebounded almost 9% in the first days of August to a fresh all-time high. Whipsaw of that magnitude inside eight weeks does not describe a calm market. It describes one being held up by a single trade.
Retail Sales Fell 0.6% And The Tax-Refund Cushion Is Gone
The headline number is bad. The composition is worse. Retail and food services sales hit $763.6 billion in July, a 0.6% monthly decline against an unrevised $768.6 billion in June, per the Census Bureau's advance estimate. That is the steepest monthly drop in more than a year. Autos and online stores did the damage.
Excluding automobiles, sales fell 0.3% against consensus for a 0.2% gain. Excluding autos and gasoline, sales fell 0.2%. The control group — stripping autos, gasoline, building materials and food services, the slice that feeds directly into the GDP consumption line — fell 0.4% after a downwardly revised 0.4% June increase. Street expectations called for a 0.3% gain. Every cut of the data went the same direction.
The year-over-year math tells you how fast this decelerated. July sales ran 5.0% above July 2025. In May that figure was a revised 7.3%. June moderated to 6.7%. Three months, 230 basis points of deceleration. The May-through-July window averaged 6.3% year over year. The long-run average sits near 4.75%, so the level is still above trend — but the slope has rolled over hard.
The explanation being circulated is that outsized tax refunds this year propped up second-quarter spending and cushioned households against gasoline prices inflated by the Middle East conflict. Those refunds are spent. Consumer spending grew at a 3.2% annualized rate in the second quarter while the overall economy expanded at just 1.5%. That gap was never sustainable, and July is the first month showing the reversion.
None of this is inflation-adjusted. The Census advance report does not deflate for price changes, which means a portion of the 5.0% annual gain is pure price. A 0.6% nominal monthly decline cannot be explained away by that caveat — fewer dollars crossed registers in July than in June, full stop. The National Retail Federation's 2026 forecast of 4.4% core growth looked conservative in the spring. It now looks about right, maybe generous.
Retail earnings land next week. Walmart and Target both report, and their guidance will either confirm the July air pocket or dismiss it as a one-month distortion.
PPI Printed Flat And The September Hike Got Repriced
Wholesale inflation came in unchanged in July, per the BLS final demand release, against a 0.2% consensus. On a 12-month unadjusted basis the index rose 4.7%, below the 4.9% expected and down from 5.5% in June. June's originally reported 0.3% decline was revised to just 0.1%.
The internals were driven by energy. Final demand goods fell 0.7%, with energy costs down 3.1% and gasoline off 5.7%. Food prices dropped 0.9%. Final demand services rose 0.2%, led by a 6.5% surge in the portfolio management index — a line that tracks equity market levels more than any underlying cost pressure. Construction prices advanced 2.2%.
Core PPI, excluding food and energy, rose 0.2% against a 0.3% forecast, and 4.2% annually, matching estimates. The measure that strips food, energy and trade services rose 0.4% on the month and 4.7% over twelve months. That last figure is the one hawks will point to: the cleanest read on underlying producer pressure is still running above 4.5% annualized.
Further up the chain, processed goods for intermediate demand fell 0.6%, weighed by a 3.1% drop in processed energy and a 6.7% slide in diesel. Stage 2 intermediate demand prices rose 7.6% over twelve months. Stage 1 edged down 0.1% on the month but sits 9.7% higher year over year. Pipeline pressure has stopped building, but the accumulated level from the past twelve months has not gone anywhere.
Rate expectations moved. Before Wednesday's CPI, September hike odds sat near 50%. After CPI they dropped to roughly 42%, and after PPI the probability of a hold pushed toward 64%. The Federal Reserve has held the funds rate at 3.50%–3.75% for five consecutive meetings under Chair Warsh, with three dissents at the July decision favoring a 25 basis point increase. That split has not closed.
Two more data points arrive before the September FOMC: August payrolls and August CPI. Both land in the first half of September. The decision belongs to them, not to July.
CPI At 3.4% Is Still 140 Basis Points Above The Target
The consumer price index rose 0.1% in July, putting the annual rate at 3.4% — matching consensus and marking a second straight month of deceleration. Core readings slowed on both a monthly and annual basis. Energy prices dropped 1.5% for the month after a 5.7% June decline, though the sector still carries a 14.7% annual increase following the 10.9% March spike that followed the opening strikes against Iran.
Shelter rose 0.1%, matching food. Shelter had been the sticky component keeping the headline elevated, and even at a tenth of a point it accounted for a meaningful share of the monthly increase given its index weight. The energy-fueled burst that defined the first half of 2026 has faded. What replaced it is a 3.4% run rate that sits 140 basis points above the 2% mandate.
That gap is the entire tension in this market. Equity pricing assumes the Fed holds through September and the AI capex cycle keeps compounding. The bond market is less convinced. The 10-year Treasury yield eased to roughly 4.68% Thursday and drifted to 4.65% after the PPI print, but the Treasury sold 10-year notes at 4.683% — the highest auction stop since the global financial crisis.
That is not a bond market pricing benign inflation. It is a bond market demanding compensation for inflation above target and widening deficits, and it is doing the tightening work the Fed has declined to do. Long-dated yields near cycle highs while the funds rate sits at 3.50%–3.75% is a curve telling you the central bank is behind, not ahead.
The July jobs report was soft, which is what gave the doves cover. Combine a weakening labor market with a 0.6% retail sales decline and the argument shifts from "should the Fed hike" to "how long before growth becomes the problem." Cooling inflation driven by demand destruction is not the same trade as cooling inflation driven by supply normalization. The equity tape is pricing the second. July's consumer data looks like the first.
Reddit Rips 12% Into The Seat AvalonBay Is Vacating
Reddit was the single biggest mover in premarket, up as much as 12.9% after S&P Dow Jones Indices confirmed it will join the S&P 500 before the open on Tuesday, August 18, per the index provider's announcement. Shares closed the extended session Thursday at $175.56, up 11.03%.
The mechanics matter. Reddit replaces AvalonBay Communities, which is being absorbed by fellow index member Equity Residential. Shareholders at both apartment REITs approved the deal with more than 99% of votes cast, clearing a close as early as Monday, August 17. Each AvalonBay share converts into 2.793 Equity Residential shares. The combined entity rebrands as Vivmark Residential and trades under VMRK starting August 18, keeping its index seat. Separately, Sun Communities replaces Webster Financial in the S&P MidCap 400 before the open on Thursday, August 20.
Reddit takes the Communication Services slot and becomes only the second pure-play social media name in the benchmark alongside Meta Platforms. Pinterest and Snap went public earlier and never scaled to the market cap threshold.
The valuation context cuts against the pop. Reddit traded near $153.45 into the announcement, down roughly 31% year to date — one of the weakest showings among digital advertising names. Market cap sits at $30.42 billion. The trailing P/E of 36.77x is well below its five-year median of 111.94x, which tells you how much multiple compression has already happened. Consensus is 14 buys against nine holds with an average target of $218.32, implying 38.1% upside from pre-announcement levels.
Index inclusion forces passive buying. Hundreds of billions benchmarked to the S&P 500 must establish a position, and that structural demand typically puts a floor under newly added names while improving liquidity. But the index effect has moderated substantially over the past decade — the arbitrage is well understood and largely front-run.
The bear case has nothing to do with index mechanics: US user growth is slowing and search referral traffic has become volatile as AI-driven search reshapes how people reach the platform. Second-quarter revenue was strong. Traffic durability is the question that determines whether $175 holds.
Applied Materials Beat On Every Line And Got Sold 5%
Applied Materials posted the best quarter in its history and the stock dropped 4.9% to $508.30 in premarket after already falling 2.48% Thursday. Third-quarter revenue hit $9.12 billion, up 25% year over year, per the company's fiscal Q3 report. Adjusted EPS came in at $3.50 against a $3.36 estimate. GAAP gross margin was 50.3%, with record operating income of $3.08 billion, or 33.7% of revenue.
The guidance was the part that should have worked. Fourth-quarter revenue is targeted at $10.25 billion plus or minus $500 million, up 51% year over year. Non-GAAP EPS guidance of $4.02 plus or minus $0.20 implies 85% annual growth. Management raised its advanced packaging growth forecast for 2026 to above 70% from above 50% — a 20-point upgrade. Process diagnostics and control is guided to grow more than 50%. Gross margins expanded for a thirteenth consecutive quarter, clearing 50% company-wide and 55% in semiconductor systems.
Cash generation was record: $3.04 billion in operating cash flow, $2.33 billion in non-GAAP free cash flow, up 14%. The company returned $860 million to shareholders through $440 million in buybacks and $420 million in dividends, against a commitment to return 80-100% of free cash flow.
So why did it get smoked? Three reasons. Semiconductor systems revenue of $7.04 billion cleared a $6.96 billion consensus by less than 1.2% — a rounding error on the segment that carries the thesis. The company booked a $220 million unrealized loss on investments during the quarter. And the stock had already run 98% year to date, which sets a bar that a merely excellent print cannot clear.
Valuation offers some cushion. Shares trade at 32.14 times forward earnings, a 7% discount to Lam Research and 13% to KLA. The CFO said customer conversations now extend to 2030, with strength expected in DRAM, advanced foundry logic and packaging through the back half. Historically the initial reaction rarely holds — every 30-day window after the past eight reports has been positive, ranging from a 1.53% decline to a 35.8% gain.
Sandisk Rips To $1,647 On An 80% Margin Target And A $2,250 Print
Sandisk was the cleanest long in the tape. Shares blew through $1,528.11 Thursday, up 13.67%, then added another 7.79% in premarket to $1,647.10, trading between $1,642 and $1,647.72 before the bell. The catalyst was an investor day where management laid out an 80% long-term gross margin target and a business model built around locked-in supply agreements rather than spot pricing.
The board authorized an additional $14 billion in repurchases, bringing total remaining buyback authorization to $15.5 billion. The company signed five new agreements since April, including three with new customers and two expansions of existing deals. Shares trade at roughly 17.1 times earnings — a number that looks absurd against a stock that has gone up sixfold in 2026 until you understand memory pricing is the operating leverage.
An overweight reinstatement Friday morning carried a $2,250 price target, implying 47% upside from Thursday's close. Consensus sits at $2,114.77. The thesis is simple: memory demand tied to AI infrastructure has outrun supply and stays that way through 2027.
The technical setup is mixed and matters here. The stock trades 77.8% above its 200-day simple moving average of $895.91 and 14.7% above the 100-day at $1,388.98, but still sits about 4% under the 50-day at $1,659.43. RSI reads 53.43 — neutral. The 20-day sits below the 50-day, signaling near-term weakness, while the 50-day remains above the 200-day, keeping the long-term structure intact. Resistance is $1,696.50. Support is $1,485, near the 50-day exponential average of $1,478.34.
The premarket move puts price within 3% of that $1,696.50 resistance. Clearing it flips the intermediate trend back to constructive. Failing it sets up a retest of $1,485 with the 20-day still pointed down. Sandisk climbed from roughly $48 after separating from Western Digital to more than $2,300 before retreating about 40%. That is a high-beta instrument, and chasing it into resistance is a different trade than owning it at $1,485. Micron ripped 3.7% in sympathy, with Intel and Marvell adding 1-2%.
Cisco Dropped 9.65% Despite $9.3 Billion In Hyperscaler Orders
Cisco delivered record numbers and got hammered for it. Fourth-quarter revenue reached $17.3 billion, up 18% year over year, per the company's Q4 and fiscal 2026 results. Adjusted EPS of $1.22 beat a $1.17 consensus. GAAP net income jumped 51% to $3.9 billion, or $0.97 per share. Full-year fiscal 2026 revenue came in at $63.3 billion, up 12%, with GAAP net income of $13.3 billion. GAAP operating margin was 24.7%; non-GAAP hit 35.9%.
The order book was the standout. Total product orders grew 35% year over year in the fourth quarter, up 25% excluding hyperscalers, with double-digit growth across every geography and customer market. Networking product orders grew 40%, the eighth consecutive quarter of double-digit expansion. Hyperscalers placed $4 billion of orders in the quarter alone, bringing fiscal 2026 to $9.3 billion against an original target range of $5 billion.
The stock fell 8.77% Thursday, printing as low as $111.92 for a 9.65% decline before settling near $115.06, down $8.82 or 7.12%. A mega-cap moving that hard in one session on a beat means the market is pricing something other than the headline.
That something is fiscal 2027 guidance. AI infrastructure delivered approximately $4 billion of revenue in fiscal 2026 against $7.5 billion expected in fiscal 2027 — strong, but a deceleration from the order growth rate. Management flagged that implied growth in the second through fourth quarters runs closer to 13% as comparisons toughen: the prior year's first half grew at single digits while the back half hit mid-to-high teens. Q1 revenue guidance represents about 25% of the full year, matching the three-year average, so linearity is normal. The problem is arithmetic, not execution.
Cisco has beaten on EPS five straight quarters and guides conservatively at the start of every fiscal year. That is a documented pattern. The market treated it as a broken quarter anyway, which is what happens when a networking name gets repriced as an AI infrastructure story and then fails to deliver AI infrastructure growth rates.
Cerebras Got Smoked 11.85% As The AI Trade Started Discriminating
Cerebras Systems tumbled 11.33% to $232.38, down $29.68, after second-quarter revenue came in at $180 million against a $194 million consensus. The company swung to a loss for the quarter even while lifting its full-year outlook. Shares had already fallen 16% to $219.60 in Wednesday's extended session before partially recovering.
This is the trade that has defined August: the AI complex is no longer moving as one block. Cerebras IPO'd in May at levels that took it from $125 to $350 before the stock settled into a consolidation near $234.85, testing $244 as breakout resistance. A $20 billion-plus arrangement tied to OpenAI validated the speed-optimized inference positioning. Missing revenue by $14 million on a $194 million base — a 7.2% shortfall — was enough to erase a quarter of the year's gains.
Compare that to the enterprise software side of the same theme. On Thursday, monday.com gained 9.7%, MongoDB climbed 7.9% and Cloudflare added 6.2%. Palantir rose 4.66% on average volume, extending a 33% monthly gain. Snowflake added 1.54% and sits 55.7% higher year to date. The SOXX semiconductor ETF managed just 0.76% to 550.74. Agentic AI adoption is rotating leadership from hardware toward software, and the tape is expressing that daily.
Tesla ripped 3.80% to $339.96 on below-average volume with no company-specific catalyst — the robotaxi and FSD story getting a pure macro bid rather than a fundamental one. On the Dow, Merck gained 2.00%, Nike 1.90% and Visa 1.51%, while UnitedHealth fell 1.57% and McDonald's dropped 1.23%.
Single-stock dispersion is running at extremes. Accelerant gained 43.4% after agreeing to a take-private at $20.25 per share. Securitize fell 27.5%. Capricor Therapeutics gapped 86.3% higher on Phase 3 data. International Money Express jumped 24.7% after New York regulators cleared its $500 million acquisition. Innventure collapsed 44.6% after suspending 2026 guidance. A day where the index rises 0.65% and individual names move 40 points in either direction is not a broad rally. It is a narrow one with a lot of noise around it.
Oil At $81.27 With Two ADNOC Tankers Hit In Hormuz
Crude did the heavy lifting on the disinflation narrative Thursday and then reversed. WTI for September settled at $81.25, down more than 2%. Brent shed over 2% to close at $87.07. By early Friday, Brent had rebounded to $89.53 and WTI ticked to $81.27. Despite Thursday's decline, crude finished the week roughly 5% higher.
The bid came back after the UAE accused Iran of attacking two vessels linked to Abu Dhabi National Oil Company as they transited the Strait of Hormuz Thursday evening. No injuries were reported. One tanker was struck by an unmanned aerial vehicle during an outbound transit and sustained minor damage. Saudi Arabia condemned the attacks. Last week ADNOC reported three of its tankers had been hit in the same waterway.
Iran maintains an effective blockade of the strait, which normally carries about 20% of global seaborne oil. Tehran established a Persian Gulf Strait Authority in May and claims no vessel may pass without a permit it issues. The IRGC Navy publicly asserts complete control over movements through the chokepoint. The US position is that this claim is illegitimate, and a naval blockade of Iranian ports has been described as potentially continuing indefinitely. Another carrier group is being sent to replace the USS Abraham Lincoln.
The supply picture is deteriorating on both sides of the ledger. US crude inventories surged 17.4 million barrels last week, the largest weekly build since January 2023 — a bearish print that reflects export disruption rather than demand strength. Global stockpiles are drawing down rapidly as the strait stays throttled. Diplomatic efforts have made little progress; both sides are trading reparation demands.
Copper hovered near $14,070 during European hours, off 0.3% and within reach of record levels. Gold sat at $4,419.40. That combination — record copper, $4,400 gold, $89 Brent — is not a commodity complex signaling disinflation. It is one signaling supply constraint. The July energy decline that pulled CPI to 3.4% and PPI to flat was a one-month reprieve, not a trend break.
Drone Tariffs Hit 100% And The Domestic Names Gapped
A proclamation signed Thursday imposes tariffs of up to 100% on imported drones and unmanned aircraft components. Drones weighing more than 25 kilograms — 55 pounds, effectively Group 3 and above — or equipped with capabilities designated sensitive for national security, including thermal imaging and docking stations, face the top rate. Smaller commercial and hobbyist units carry a 25% levy.
Allied nations get partial relief: 15% for the European Union, Japan, Liechtenstein, South Korea, Switzerland and Taiwan. The United Kingdom faces 10%, conditional on substantially all hardware, software and technology originating within the relevant supply chain. Most tariffs take effect 21 days after signing. Components deemed non-sensitive get 180 days.
The target is Chinese manufacturing, and the market read it that way immediately. Unusual Machines soared more than 14% to $31.13, the largest move in the group. Red Cat Holdings gained 7.42%. Ondas rose 2.92%. AeroVironment added 2.95%. Kratos Defense advanced 2.42%. The overnight range across the complex ran from 1% to over 7%.
Year-to-date positioning explains the dispersion. Unusual Machines has surged 113% in 2026 and Red Cat 29%, while Ondas, AeroVironment and Kratos have declined between 8% and 21%. The tariff hands the beaten-down legacy contractors a protected competitive position without requiring them to win on price, and hands the small-cap pure plays a demand pull they have not been able to manufacture on their own.
The structural backdrop was already supportive. The Pentagon's 2027 budget request includes nearly $75 billion for unmanned systems and counter-drone technology. The FCC banned all foreign-made drones in December 2025, citing unacceptable national security risk; DJI sued in February arguing it was never given a chance to respond. This proclamation closes the commercial channel the FCC ruling left partially open.
Execution is the test that has not been passed. Production scaling, supply-chain independence from Chinese components, dilution, and margin structure all remain open questions for companies whose combined revenue is a fraction of the addressable budget. A tariff creates the opening. It does not build the factory.
The 10-Year At 4.68% Is The Constraint Nobody Is Pricing
The bond market is running a different scenario than the equity market, and it has been for months. The 10-year yield eased to about 4.68% Thursday and drifted toward 4.65% after PPI, but Treasury sold 10-year notes at 4.683% — the highest auction yield since the global financial crisis. That clears at a level that implies buyers require meaningful compensation to fund the government at current deficit trajectories.
Inflation above target and widening fiscal deficits have kept long-dated yields elevated even as short-term rate hike odds recede. The framework being expressed by policymakers is that the bond market can enforce tightening in the near term while the Fed holds. That works until it doesn't. Long yields at cycle highs while equity multiples sit at record levels is a spread that resolves in one of two directions, and only one of them is pleasant for stocks.
Three FOMC members dissented at the July hold, preferring a 25 basis point increase. Hawkish commentary has continued in speeches since. The July CPI and PPI prints reduced immediate pressure, but the cooler readings raise the stakes on the new chair delivering on rhetoric that this pace of consumer price increases will not be tolerated. If August data comes in hot, the September decision reverses fast.
The dollar has traded on geopolitics more than inflation. GBP/USD sat at 1.3540, up 0.39%. The FTSE 100 held 10,775.19. Asian equities rallied into the US open, with the KOSPI climbing between 1.4% and 2.4% and the Nikkei adding 0.6% to 0.8%. Nintendo rose as much as 7.5% to ¥8,945 in Tokyo after Pokémon Pokopia crossed 5 million units four months post-launch, putting the stock on track for a third straight weekly gain — its longest streak since November.
The University of Michigan preliminary August sentiment reading lands at 10:00 a.m. ET, expected at 54.1 against 55.2 in July. Current conditions are forecast at 55.0 versus 54.8. One-year inflation expectations are expected to hold at 4.2%, with the five-to-ten-year measure at 3.3%. July's final reading of 55.2 marked an 11.5% jump from June's 49.5 and the highest since February — before the Iran conflict drove gasoline higher.
Read More
-
Yen Stalls at 160 Despite a 3% JGB and Tokyo Core CPI at 2.0% — Intervention Sits at 164, Friday's Payrolls Decide
02.09.2026 · TradingNEWS ArchiveEnergy
-
QQQ ETF ($739) Fades From an Early Tech Rally as a 77.9 ISM Prices Index Meets Micron's $61.5B Guide — $760 Record Test Ahead
01.10.2026 · TradingNEWS ArchiveStocks
-
XRPR and XRPI Follow XRP's $1.49 Test as Spot Funds Hold 1.16B XRP and a 1 Billion Token Escrow Release Lands — $1.70 in Play
01.10.2026 · TradingNEWS ArchiveCrypto
-
November NG Slips Below $3 as Decade-High Storage Meets Capped LNG Exports — $2.75 in Sight
01.10.2026 · TradingNEWS ArchiveCommodities
-
Dollar-Yen at 158 Presses Toward 160 as a 363 bp Carry Gap Meets Katayama-Bessent Intervention Risk — 159 in Sight
01.10.2026 · TradingNEWS ArchiveForex
Concentration At 45% Of Market Cap Is The Real Position
Here is the number that frames everything else: AI-linked names now account for roughly 45% of total S&P 500 market capitalization, an all-time high for any single thematic cluster in the index. Nvidia alone carries 7.55% of index weight and Apple 7.04%. Strip the AI complex out of the benchmark and the two-year return collapses from 142% to 16%.
That concentration produced 86% of S&P 500 companies beating expectations through early August, against a long-term average of 68% since 1994. It also produced the July stress test. A hedge fund built on AI infrastructure exposure grew to as much as $45 billion, reported a 439% net first-half return on July 24, then took losses severe enough that a cascade of margin calls forced liquidation of its entire public portfolio six days later — shrinking assets to roughly $10 billion in weeks. A stake once estimated at $16 billion changed hands in one of the largest rushed equity transactions on record.
An AI bubble now ranks as the most-cited tail risk among institutional allocators, displacing second-wave inflation from the top spot, with 45% naming it against 28% the prior month. AI-linked borrowing has reached $1.4 trillion spanning hyperscaler corporate issuance and leveraged positions in AI-adjacent equities.
None of that has stopped the tape. Year-end index targets have been marched up to 8,000 from 7,800, with 2026 earnings estimates at $365 and 2027 at $420. Cloud growth, backlog expansion and improved cash-flow visibility at the largest platforms have quieted questions about return on capex — for now.
Nvidia reports August 26. That print carries more weight than any macro release on the calendar between now and then. With 7.55% of index weight and a supplier chain that includes half the names that moved this week, a guidance stumble transmits through the entire benchmark inside a session. The market has spent August pricing in a beat.
Levels That Matter Into Retail Earnings Week
The S&P 500 enters Friday's session with 7,798.99 as the reference close and 7,800 as psychological support that was resistance 48 hours ago. Futures at 7,827.00 imply an open above that line. Holding it through a session that opened with a 0.6% retail sales decline would confirm the record close rather than mark a failed breakout.
The Nasdaq Composite at 26,803.03 is the cleaner momentum read given semiconductor leadership. Nasdaq-100 futures near 30,229.25 with Micron up 3.7% and Sandisk up 7.79% in premarket point to another chip-led session. The Dow at 53,839.99 remains the laggard, with futures down 96.84 at 53,863.16 — the index carries the least AI exposure and the most consumer-cyclical weight, which is exactly the wrong mix for a week when consumption data broke.
Three things determine next week. Michigan sentiment at 10:00 a.m. sets the tone for whether July retail sales get read as noise or signal — a print materially below 54.1 turns a one-month miss into a trend. Walmart and Target guidance on the state of the consumer either validates or contradicts the Census data. And Nvidia on August 26 decides whether the 45% of index market cap tied to AI holds its multiple.
The setup rewards discrimination over exposure. Applied Materials at $508.30 trading at 32.14 times forward with 51% guided revenue growth is a different proposition than Cisco at $111.92 guiding AI revenue growth deceleration. Sandisk at $1,647.10 pushing $1,696.50 resistance is a different proposition than Cerebras at $232.38 having just missed by 7.2%.
The index is at a record. The consumer just posted the worst month in over a year. Brent is back near $90 with tankers getting hit in Hormuz, and the 10-year is auctioning at post-crisis highs. Those four facts have not been reconciled. They will be.




