Gold Price Forecast: XAU/USD Claws Back Above $4,490 as Ceasefire Hopes Undercut the Greenback
Bullion is caught in a genuine tug-of-war: the unwinding of the Iran war risk premium and a softer dollar are pulling it up off the $4,360 two-month low | That's TradingNEWS
Key Points
- Gold rebounds toward $4,500 from a two-month low near $4,360 as the Iran truce weakens the dollar.
- Core PCE at a 3.3% annual rate and a hawkish Warsh Fed cap the rebound and keep yields elevated.
- Central-bank buying near 27 tonnes a month anchors a structural floor around $4,000.
Gold enters the final session of May in recovery mode, edging higher toward the $4,500 mark per troy ounce in the early Friday session after rebounding from a two-month low struck in the prior trading day, when the metal sank toward the $4,360 support zone before buyers stepped in. The bounce follows reports that Washington and Tehran have reached a tentative agreement to extend their ceasefire by 60 days and open further talks on Iran's nuclear program — a development that, counterintuitively for a safe-haven asset, has helped gold by undermining the U.S. dollar rather than by stoking fear. The price action this week has been a study in indecision: bullion tested the mid-$4,400s repeatedly before recovering, reclaimed the psychologically important $4,500 level on Thursday as the dollar retraced, and is now attempting to build on that "goodish" bounce. Yet the recovery is fragile and capped, because the same macro forces that triggered the slide to a two-month low remain firmly in place. The honest characterization of the current tape is that gold is a market trying to repair damage rather than one in firm control of its own trend — the buyers who defended the mid-$4,400s deserve credit, but the broader backdrop of elevated Treasury yields, a fundamentally firm dollar, and a Fed positioned to keep rates higher for longer argues for caution, and the immediate driver of every tick remains macro rather than physical jewelry demand or even the structural central-bank bid.
The Iran Ceasefire Cuts Both Ways for Bullion
The defining dynamic for gold right now is the genuinely two-sided nature of the Iran ceasefire story, which simultaneously removes one of bullion's biggest tailwinds while reinforcing another. The dominant macro catalyst for gold's entire 2026 rally was the geopolitical risk premium generated by the Iran war and the threat to the Strait of Hormuz, and the ceasefire diplomacy is now partially unwinding that premium — which is unambiguously bearish for the safe-haven bid that carried the metal toward record territory earlier in the year. When Bloomberg-style reports of the tentative 60-day extension hit the wires, gold's first instinct was to sell off, dropping toward $4,360 as traders priced out the conflict premium. But the mechanism then reversed through the currency channel: the ceasefire optimism weakened the U.S. dollar against developed-market peers, and because gold is priced in dollars, a softer greenback mechanically lifts the metal, which is the proximate reason for the rebound toward $4,500. Complicating matters further, the deal remains unsigned and contested — President Trump has not agreed to the terms, the two sides remain at odds over key issues including Iran's nuclear program and the Strait, and the conflict has repeatedly proven capable of re-escalating, which means the risk premium gold has shed could come flooding back on a single headline. The result is a metal whipsawing between the bearish pull of de-escalation and the bullish push of a weaker dollar, with the unsigned status of the deal keeping a lid on directional conviction in both directions.
The Inflation Engine Still Runs Hot
Working alongside the geopolitical cross-currents is the inflation picture, and here the signal for gold is more durable and arguably more important than the on-again, off-again ceasefire headlines. U.S. core PCE inflation hit an annual rate of 3.3% in April, the fastest pace since May 2023 and a reading that confirms price pressures are not merely sticky but actively reaccelerating. For gold, persistent inflation is a foundational support, because the metal has functioned for centuries as a store of value that holds purchasing power when fiat currencies are being eroded, and a multi-year high in core inflation reinforces exactly that thesis. The tension, however, is that hot inflation pulls two levers in opposite directions for bullion: it strengthens the long-term store-of-value case while simultaneously empowering a hawkish central bank to keep nominal rates elevated, which raises the opportunity cost of holding a non-yielding asset. The same oil shock that the Iran ceasefire would resolve has been feeding into the inflation data, so there is a self-referential quality to the current setup — the resolution of the conflict would lower oil, cool inflation, and reduce both gold's safe-haven appeal and its inflation-hedge appeal at once, while a re-escalation would raise oil, stoke inflation, and revive both. This is why inflation data has become, in the words of market participants, the strongest single signal for gold, outranking even the ceasefire headlines in its medium-term importance.
A Hawkish Warsh Fed and the Opportunity-Cost Problem
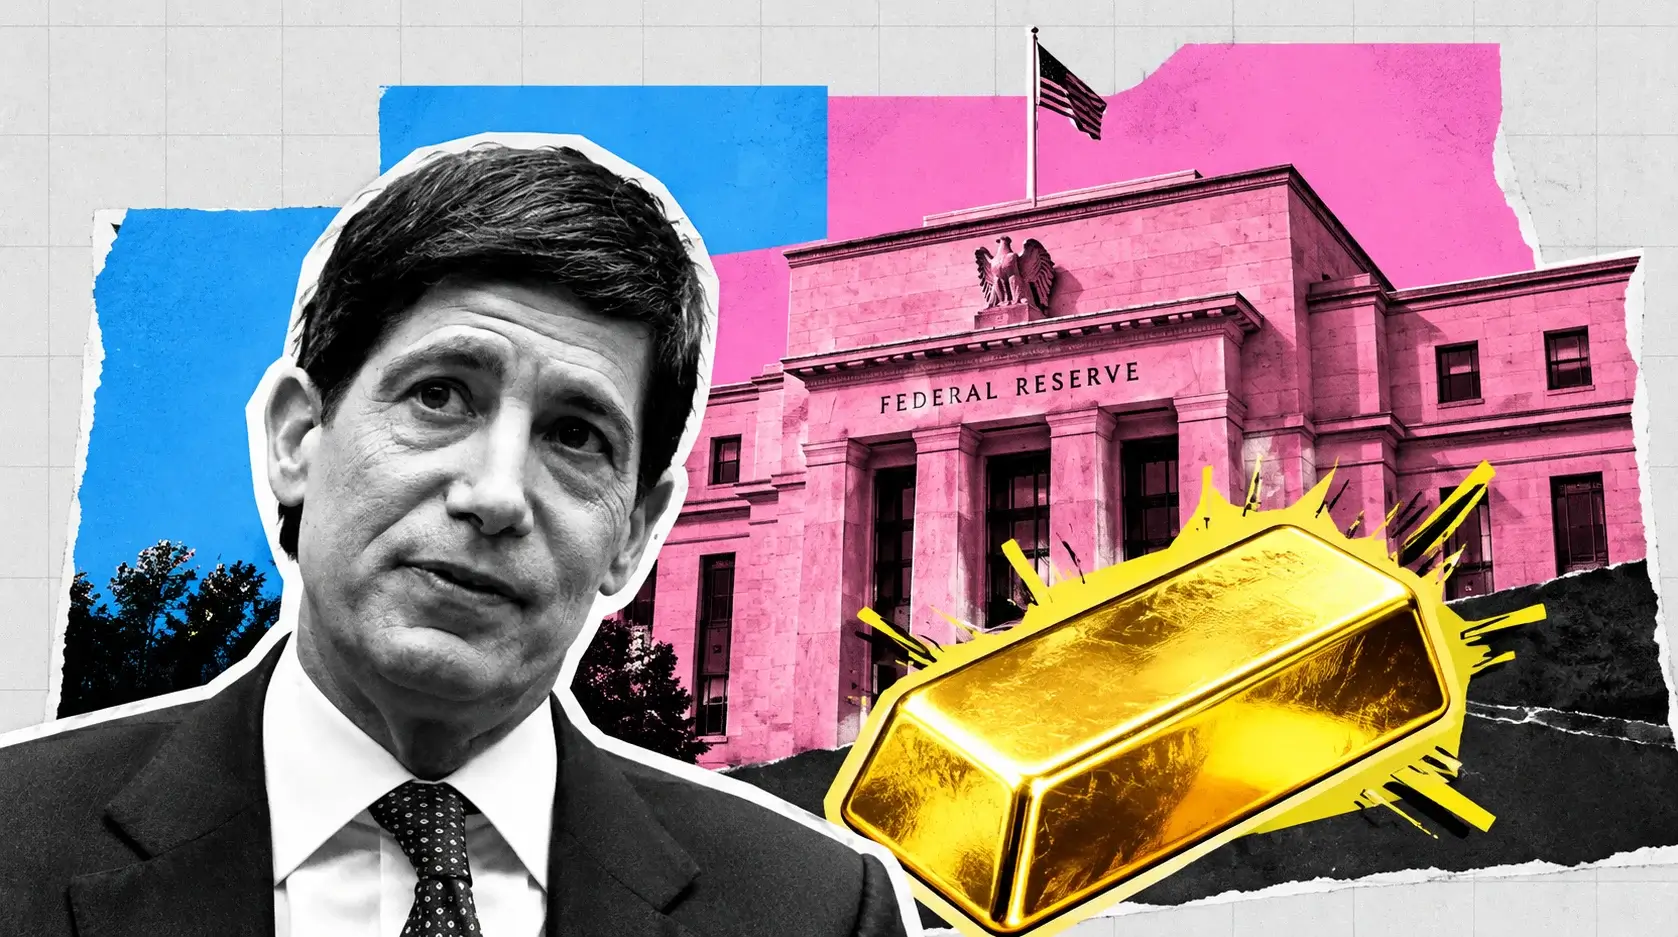
The factor capping gold's rebound most directly is the changed posture of the Federal Reserve under Kevin Warsh's new leadership, which the market is reading as decisively hawkish and which has reinforced bets that U.S. rates will stay higher for longer or even rise this year. The mechanical relationship between Fed policy and gold pricing operates through the opportunity-cost channel: gold yields nothing, so when the cost of money is high and Treasuries are paying attractive real and nominal returns, the relative appeal of holding bullion diminishes, and rising rates therefore weigh on the metal. With core PCE running at 3.3% and a Fed chair whose credibility is staked on fighting inflation, the bond market has pushed long-end yields higher, and that combination of elevated yields and a firm dollar has been the primary force limiting gold's safe-haven bid and pulling it toward the two-month low in the first place. The hawkish Fed bets act as a tailwind for the dollar even as the Iran ceasefire weakens it, creating yet another tug-of-war that has left bullion directionless on an intraday basis. The key insight for the forecast is that gold's rallies will remain capped as long as the Warsh Fed is perceived as unwilling to ease, because every attempt to break higher runs into the headwind of rising opportunity cost — and only a genuine cooling in inflation that gives the Fed room to soften its stance would remove that ceiling and let the structural bull case reassert itself.
The Dollar Is the Swing Variable
Because gold is priced in dollars, the greenback's trajectory has become the single most important short-term swing variable, and right now the dollar itself is being pulled in two directions that mirror gold's own indecision. The Iran ceasefire optimism has weakened the dollar by improving global risk appetite and reducing the flight-to-safety bid that had boosted the currency during the conflict, and that retracement in the greenback is the direct cause of gold's rebound toward $4,500 — the EUR/USD pair, for instance, strengthened toward 1.1655 on the same ceasefire news. But the hawkish Fed bets, bolstered by the surge in inflation to the fastest pace since 2023, simultaneously act as a fundamental tailwind for the dollar, capping the upside for non-yielding bullion. The dollar is therefore caught between a risk-on impulse that pushes it down and a rate-differential impulse that pushes it up, and gold's near-term direction will be largely determined by which of these forces wins out on any given session. For traders, this means watching the dollar index and the major pairs as a real-time proxy for gold's likely move: a sustained dollar retracement on firming ceasefire progress would let gold extend toward the mid-$4,500s and beyond, while a dollar rebound on hawkish Fed repricing or a ceasefire breakdown would send bullion back toward and potentially through the $4,360 floor.
The Technical Structure Remains Defensive
The chart confirms the cautious fundamental read, with gold's technical structure still firmly defensive despite the Friday bounce. The metal is trading below its key short- and medium-term moving averages — the 21-day, 50-day and 100-day simple moving averages all sit above current price, a configuration that signals rallies are likely to face supply before the broader uptrend can resume. The relationship between those averages is itself bearish: the 21-day SMA has been threatening to pierce down through the 100-day SMA, the kind of "bear cross" that technicians watch for as confirmation of a shift in trend, and the 14-day Relative Strength Index has been hovering below the midline around the high-40s, hinting at renewed downside momentum rather than a clean reversal. The price has been filling bearish opening gaps and consolidating in tight ranges with spreads reflecting active but directionless participation — a market that genuinely does not know which scenario to price. The takeaway is that the Thursday-into-Friday rebound, while real, has not yet repaired the damaged technical structure: gold needs to reclaim and hold above its moving-average cluster, particularly the mid-$4,500s, to flip the short-term setup back to constructive, and until it does, the bias on the charts remains for rallies to be sold and for the metal to retest support rather than to break out.
Mapping the Key Levels: $4,360 Floor to $5,000 Ceiling
The actionable level map for gold is unusually well-defined after a week of testing. On the downside, the critical support is the $4,360 zone that marked Thursday's two-month low and that buyers aggressively defended — a daily close beneath it would confirm the bearish technical structure and open a path toward deeper support, with the $4,450-to-$4,500 band having served as the prior near-term support area that the metal tested before rebounding. Below the immediate levels, the structural floor that matters most sits closer to $4,000, a level anchored not by chart patterns but by the relentless central-bank demand that provides a fundamental backstop. On the upside, the immediate hurdle is the $4,500 level the metal is fighting to hold, followed by the mid-$4,500s where the moving-average cluster and prior resistance converge, and then the much larger psychological and technical barrier at $5,000 — a level that some analysts argue gold must decisively break to confirm the next major upward leg. The monthly range expectations frame the near-term battlefield neatly, with May projected to trade between roughly $4,380 and $5,100, which captures both the two-month low just tested and the upside potential if the dollar weakens and the structural bid reasserts. The cleanest way to trade this is to treat $4,360 and $5,000 as the boundaries of the current regime, with the mid-$4,500s as the pivot that determines whether the next move targets the floor or the ceiling.
Read More
-
Yen Stalls at 160 Despite a 3% JGB and Tokyo Core CPI at 2.0% — Intervention Sits at 164, Friday's Payrolls Decide
02.09.2026 · TradingNEWS ArchiveEnergy
-
FDVV ETF ($61.42) Balances Nvidia, Apple and Microsoft Against Rate-Sensitive Income Holdings — $64.54 High in Reach if Yields Ease
19.10.2026 · TradingNEWS ArchiveStocks
-
XRPI ($6.98) and XRPR ($10.61) Trade 56% and 52% Below Their Highs as First-Mover Funds Lose the Fee Battle to 0.19% Spot Products
19.10.2026 · TradingNEWS ArchiveCrypto
-
NG Holds Its $3.00–$3.30 Range as Light Storage Builds Meet Record 112.2 Bcf/d Output — $3.50 Above $3.26
19.10.2026 · TradingNEWS ArchiveCommodities
-
Dollar-Yen (158.43) Stuck in a 1.39-Yen Box as Carry Meets the Intervention Line — 156.65 Below 157.55, Tokyo Waits at 160
19.10.2026 · TradingNEWS ArchiveForex
The Central-Bank Demand Floor
Underpinning the entire bullish thesis for gold is a source of demand that operates entirely independently of headlines, inflation prints, or Fed decisions: the structural accumulation of bullion by global central banks. Early data for 2026 suggests this strategic institutional buying has not slowed from its torrid pace, with central bank purchases running at roughly 27 tonnes per month, or over 324 tonnes per quarter — a level of price-insensitive demand that creates a genuine floor beneath the market. The significance of this buying cannot be overstated for the forecast, because it represents demand that continues regardless of what the Fed does with rates, regardless of whether the Iran war ends tomorrow or drags through the summer, and regardless of whether U.S. equities rally or correct. This is the primary reason the bearish scenario for gold has a lower bound near $4,000 rather than something far more catastrophic — every dip toward that level is met not just by tactical traders but by sovereign buyers executing multi-year diversification strategies away from dollar reserves. The central-bank bid is the closest thing gold has to a guaranteed buyer of last resort, and it transforms the risk profile of the asset: while the metal can certainly chop and even decline meaningfully in the near term on dollar strength and hawkish Fed repricing, the structural floor means the downside is contained in a way that few other assets enjoy, and it is the foundation on which the optimistic year-end forecasts of $5,400 to $6,000 ultimately rest.
Gold Versus the Risk-On Trade
The cross-asset behavior this week has been instructive, because gold has been caught in the same broad risk recalibration that hit Bitcoin, with both the safe-haven and speculative trades being unwound simultaneously as the Iran premium drained out. While equities pushed to record highs on the ceasefire relief and the AI capex boom, gold initially sold off toward its two-month low as the conflict premium evaporated, demonstrating that in the current regime bullion is trading as a geopolitical-risk instrument first and an inflation hedge second. The simultaneous weakness in gold and Bitcoin earlier in the week told a clear story: when long yields rise and the geopolitical premium fades, both the traditional haven and the digital speculative asset get sold, leaving investors with few obvious places to hide. Gold's subsequent rebound on dollar weakness, however, distinguishes it from Bitcoin, which has continued to struggle under ETF outflows — bullion at least has the dollar channel and the central-bank floor working in its favor, whereas crypto lacks an equivalent structural backstop. The relationship with oil is equally important: the same crude pullback that the ceasefire is driving lowers the inflation impulse that supports gold, but it also weakens the dollar's energy-driven strength, netting out to the directionless chop the metal has displayed. For the forecast, the key cross-asset insight is that gold's near-term fate is tied to the broad macro risk cycle and the dollar, while its medium-term fate rests on the more durable inflation and central-bank dynamics.
Positioning and the ETF Picture
The positioning backdrop adds nuance to the demand story, with the speculative and investment flows showing the same hesitation evident in the price action. After the powerful run that carried gold toward record territory earlier in 2026, the market has been digesting elevated positioning, and the slide to a two-month low suggests some of the tactical longs that piled in during the conflict premium phase have been shaken out. Gold ETF demand, captured by the major vehicles, tends to follow price momentum and sentiment, which means the recent weakness has likely coincided with some investment outflows even as the structural central-bank buying continues unabated — a divergence between the price-sensitive Western investment community and the price-insensitive sovereign accumulators. The healthy aspect of the recent shakeout is that it has cleared out weaker hands and reset positioning to less extreme levels, which paradoxically improves the setup for a sustainable advance once a catalyst arrives, because an overbought, over-positioned market is more vulnerable to sharp reversals than a market that has just flushed out its speculative excess. The watch items for positioning are whether ETF flows turn back positive as the dollar weakens and whether the futures market shows speculators rebuilding long exposure — a return of investment demand to complement the ever-present central-bank bid would be the signal that the rebound from $4,360 has legs rather than being a mere dead-cat bounce within a corrective phase.
The Bull Case: Why Gold Reasserts
The constructive scenario for gold is straightforward and rests on the durability of its two structural pillars surviving the near-term macro headwinds. In this view, the current weakness is a correction driven by the temporary unwinding of the Iran premium and a bout of dollar and yield strength, not a break in the secular uptrend that has defined the metal's multi-year advance. The central-bank buying continues at roughly 27 tonnes per month, providing the floor near $4,000, while core inflation at a three-year high of 3.3% reinforces the store-of-value thesis over any horizon longer than the next few weeks. The bullish trigger is a softening in either the dollar or the Fed's hawkish stance: if inflation eventually cools enough to let the Warsh Fed signal patience, or if the dollar continues to weaken on improving global risk appetite, gold's opportunity-cost headwind eases and the metal is free to reclaim the mid-$4,500s and challenge the $5,000 barrier. Analysts maintaining optimistic year-end targets in the $5,400 to $6,000 range are betting precisely on this combination of continued central-bank accumulation, persistent inflation, and an eventual peak in real rates, with geopolitical instability providing periodic upside catalysts. The bull case requires only that the structural demand outlast the cyclical headwinds, which given the entrenched nature of central-bank diversification and sticky inflation is a reasonable base case for patient investors looking past the near-term chop.
The Bear Case: Why the Floor Gets Tested
The bearish scenario is equally coherent for the near term and rests on the convergence of every cyclical headwind at once. In this view, the Iran ceasefire holds and is eventually signed, draining the remaining geopolitical premium and removing the single biggest catalyst behind gold's 2026 rally, while the resolution of the conflict lowers oil prices, cools the inflation impulse, and weakens the store-of-value bid. Simultaneously, the hawkish Warsh Fed keeps long yields elevated and the dollar firm on a rate-differential basis, sustaining the opportunity-cost headwind that has already driven the metal to a two-month low. The bearish technical structure — price below all major moving averages with a threatening bear cross and a sub-midline RSI — reinforces the case that rallies will be sold, and a daily close beneath the $4,360 support would confirm the breakdown and open a path toward the next support levels, potentially toward the $4,000 central-bank floor. The bear case does not require a collapse, merely a continuation of the current macro configuration: a held ceasefire, a hawkish Fed, a firm dollar, and cooling oil-driven inflation would together cap every rally and grind the metal lower toward its structural floor. The key tell for this scenario is a decisive close below $4,360 on the back of a signed Iran deal and continued dollar strength, which would shift the near-term burden of proof firmly onto the bulls.
Price Targets and the Final Read
Synthesizing the technical levels, the competing scenarios, and the structural backdrop, the roadmap for gold is defined by a near-term range with a contested floor and a distant ceiling. The immediate near-term picture has gold attempting to hold $4,500 and build toward the mid-$4,500s, with the $4,360 two-month low as the critical support that must hold to keep the corrective phase contained and the $5,000 barrier as the upside target that would confirm the resumption of the secular bull trend. The May trading range of roughly $4,380 to $5,100 frames the boundaries, while the optimistic year-end forecasts of $5,400 to $6,000 capture the structural bull case predicated on continued central-bank accumulation and persistent inflation. The final read is that gold is a market in genuine equilibrium between powerful opposing forces — the bearish unwinding of the Iran premium and the bullish weakening of the dollar, the bullish three-year-high inflation and the bearish hawkish Fed it empowers, the cyclical headwinds of yields and a firm greenback against the structural floor of sovereign buying. For traders, this argues for respecting the range rather than forcing a directional bet: the $4,360 floor and the $5,000 ceiling are the levels that matter, the dollar and the inflation data are the catalysts to watch, and the structural central-bank bid means that even in the bearish scenario the downside is contained near $4,000. The prudent posture into month-end is to treat dips toward $4,360 as the high-probability buying zone given the structural floor, while recognizing that a sustained breakout above $5,000 requires the macro vise of a hawkish Fed and firm dollar to loosen first.