


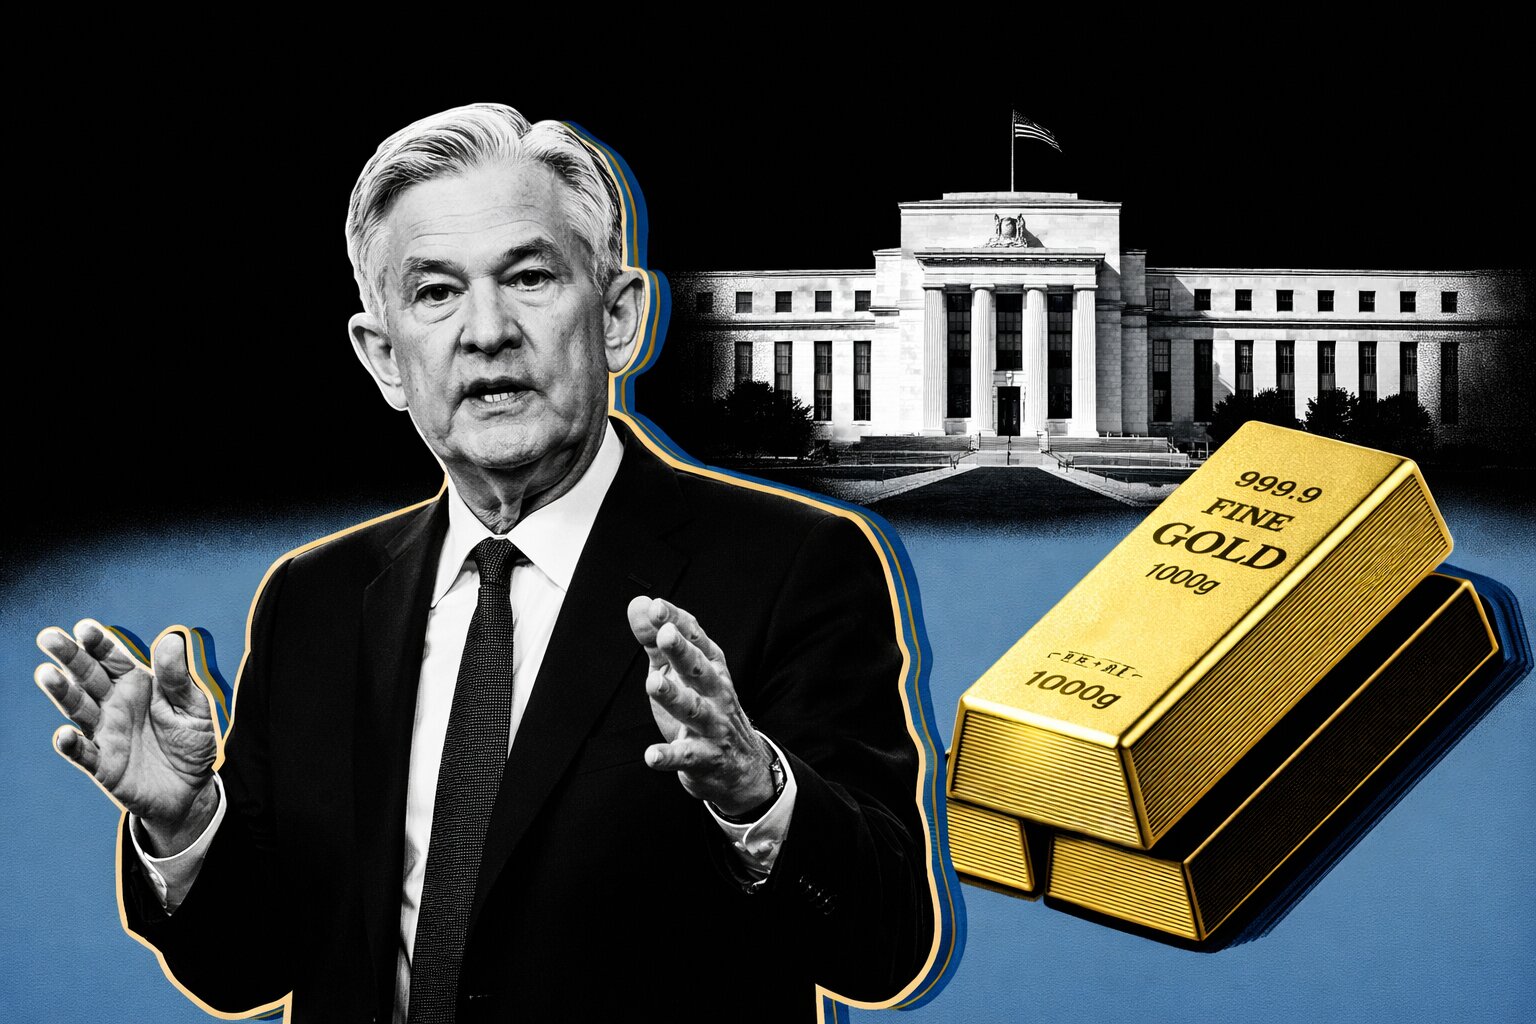
Gold Price Forecast: XAU/USD Hits Six-Week Low at $4,545 With a 9% Weekly Crash as Fed Hawkishness
Newmont (NEM) Drops 8.6%, Silver Loses 10% in a Week, RSI Collapses to 25.53 — With SMA-200 at $4,359 as the Last Line of Defense, the Next Move Toward $4,350 or $6,000 Hinges on the May Fed Chair Transition | That's TradingNEWS
Gold Price Forecast: XAU/USD Crashes 9% in a Week, Hits Six-Week Low at $4,545 — Is the Bull Market Over or Is This the Setup of the Year?
From $5,594 to $4,545: The Fastest Unwind in Gold's Multi-Year Bull Run
The numbers tell the story without any decoration needed. Spot gold hit an all-time high of $5,594.82 on January 29, 2026. It is now trading at $4,545 — a collapse of more than $1,049 per ounce, or roughly 18.7%, in under eight weeks. The weekly drawdown alone is close to 9%, making this one of the sharpest seven-day reversals bullion has seen in years. Gold futures for April delivery settled at $4,632.40 after shedding 5.4% in a single session Thursday, while Friday brought a 0.92% bounce to $4,680.26 and spot gold edged 0.3% higher to $4,662.51 by early New York hours — numbers that look like relief only against the backdrop of what just happened. They are not a recovery. They are a stabilization attempt in the middle of a momentum unwind that has the entire precious metals complex questioning what comes next.
Wednesday told the story before Thursday even started. Spot gold dropped 2.9% to $4,860.21 the moment the Fed kept rates steady at 3.50%–3.75%, with a strengthening dollar piling on as the press conference failed to deliver any signal of near-term easing. Independent metals trader Tai Wong called Powell's tone "not nearly enough" for gold — and the market agreed violently. The next session finished the job, with Thursday's intraday range running from $4,686.89 to $4,867.12 before sellers drove it toward the lows in a session that wiped out the final layer of optimism that had kept the metal above $4,700. Seven consecutive sessions of losses have now stacked up. Silver, which surged 135% in 2025 and had been gold's more aggressive running mate, is in even worse shape — spot silver hit $71.62 on Friday, down 1.7% on the day, while silver futures posted a marginal 0.8% bounce that fooled no one. The week's total silver loss exceeds 10%. Platinum shed 4% alongside the Thursday rout. The S&P 500 materials sector gave up 2.3% in that same session. Newmont (NEM) dropped 8.6% — one of Wall Street's most direct gold equity proxies — in a single day, confirming that the selloff is not contained to the spot market.
The Contradiction That Is Destroying Gold Right Now: War, Inflation and No Rate Cuts
Gold's entire rally from mid-2024 through January 2026 was built on two pillars: rate cut expectations and safe-haven demand. Both are now cracking simultaneously, and the combination is punishing the metal in a way that appears paradoxical on the surface but makes complete technical and fundamental sense once you look at the mechanics.
The U.S.-Israel war with Iran that began February 28 pushed Brent crude from roughly $75 to over $119 at Thursday's intraday peak before it pulled back toward $108–$110. Oil up 40%–50% in three and a half weeks is not a commodity story — it is an inflation event. The ECB moved this week to lift its 2026 inflation projection to 2.6%, up sharply from 1.9% in December. The IMF has modeled that a sustained 10% rise in energy prices lifts global inflation by 0.4 percentage points and shaves 0.1%–0.2% off output. The Bank of England, Bank of Japan, Bank of Canada, ECB, and the Federal Reserve all held rates steady this week. Not one cut. Not one dovish signal strong enough to offset the energy shock narrative.
The Federal Reserve kept its benchmark rate unchanged at 3.5%–3.75%, precisely as markets expected — but the tone was anything but neutral. Fed Governor Christopher Waller, who had been prepared to dissent in favor of a cut just two weeks ago after the negative 92,000 jobs print, reversed course entirely once the Strait of Hormuz closed. He voted for a pause. That single behavioral shift from one of the Fed's most dovish members signals how dramatically the rate-cut trade has collapsed. LSEG data now shows traders have fully abandoned any 2026 Fed cut expectations and are targeting mid-2027 as the earliest possible easing. On prediction markets, the odds of a rate hike at the April meeting have surged from 8% to over 24%. When the discussion shifts from "how many cuts" to "is the next move a hike," gold loses one of the primary reasons to own it — and the selloff accelerates.
Charu Chanana, chief investment strategist at Saxo in Singapore, nailed the core problem: stagflation risk. Persistent inflation from oil prices paired with growth that is deteriorating — not expanding — is the worst possible macro cocktail for gold in the short term. Inflation alone is bullish for bullion. But inflation caused by an energy shock, in an environment where rates may need to go higher to contain it, creates a simultaneous dollar-strengthening effect that offsets the inflation bid. A stronger dollar suppresses XAU/USD mechanically by making the metal more expensive for non-U.S. buyers. Right now, the dollar is winning that argument completely. Treasury yields are climbing alongside it — the 10-year is approaching its highest level since August and the 30-year has risen to 4.95%, dragging the 30-year fixed mortgage rate to 6.22% in a spillover effect that is hitting every rate-sensitive asset class simultaneously. Gold is not immune to that gravitational pull.
Toni Meadows, head of investment at BRI Wealth Management, framed it precisely: gold pricing has a structural "fear mark-up" built into it during geopolitical stress, but that mark-up is not a day-to-day hedge against every risk asset move. It is driven by longer-term trends rather than short-term fear trading. The implication is direct — the speculative fear premium that was embedded in gold at $5,594 in January is now being extracted. What remains underneath is the structural value, and the market is currently in the process of finding where that structural bid actually lives.
The Technical Picture for XAU/USD: Bearish Across Every Short and Medium-Term Metric
The technical structure on gold is the most bearish it has been since before the 2025 bull run began. XAU/USD is trading at $4,545–$4,680, well below both the SMA-20 at $5,061.99 and the SMA-50 at $5,037.66. The price is sitting approximately 10% below both short and medium-term moving averages — a gap that typically requires either a sharp mean-reversion rally or continued drift lower before those levels become relevant again. The only structural support remaining is the SMA-200 at $4,359.32, which the current price is defending by roughly $185 per ounce.
The Ichimoku Kijun line sits at $4,966.33 — that is resistance, not support, given where price is trading. Getting back above the Kijun would require a $400+ move from current levels and sustained buying that has no obvious catalyst in the current macro setup. The RSI has cratered to 25.53 — deeply oversold by any standard reading. The Stochastic RSI is at 0.00, a technical floor. The CCI is at –241.57 — the kind of reading typically seen at genuine cycle lows, not in the middle of an ongoing correction. Bull/Bear Power stands at –263.42, confirming that sellers are completely in control. The MACD and ADX are both signaling bearish bias without any sign of reversal momentum.
The forward price model outputs are telling in their own right. The 24-hour prediction is +3.9% to $4,722.33. The 48-hour target is +4.39% to $4,744.57. The 7-day prediction is a more conservative +1.89%, targeting $4,630.87 — a figure that actually sits below current levels, which underscores the model's acknowledgment that the near-term path is not linear and that a retest of lower levels within the next week cannot be ruled out. The 1-month target is $4,835.93, implying 6.4% upside. The 3-month target of $5,238.73 represents a 15.3% recovery. None of these near-term projections suggest a V-shaped reversal is imminent. They suggest a slow, grinding stabilization process over weeks, not days.
Short-term price consolidation is expected in the $4,620–$4,750 range over the next five trading sessions. A break above $4,750 opens the door toward the Kijun at $4,966, but the probability of a sustained move above that level is low given current fundamental headwinds. A decisive close below $4,620 opens the next downside target — the SMA-200 support zone between $4,350 and $4,400. That is not a crash scenario. That is the base-case downside if selling pressure does not abate.
Friday's Quadruple Witching Adds Structural Volatility to an Already Unstable Metal
Friday's quadruple witching event — the simultaneous expiration of stock options, index options, index futures, and single-stock futures — is injecting an additional layer of volatility into gold and silver that has nothing to do with fundamentals. Trillions of dollars in derivatives rolling off the board simultaneously forces institutional rebalancing and position unwinding across all asset classes, including precious metals. David Laut, CIO at Kerux Financial, noted that this particular witching event lands into a market that has already been on edge for weeks. For gold specifically, the impact is asymmetric — institutions that had long gold positions as macro hedges are unwinding them as part of broader portfolio rebalancing, adding to the structural selling pressure without any corresponding fundamental signal. The oscillation in silver between positive and negative territory on Friday morning — up 0.8% in futures while spot was down 1.7% simultaneously — is a direct artifact of derivatives expiration mechanics creating intraday cross-currents. Stripping out the witching effect, the underlying bid on gold Friday is real but insufficient to reverse the weekly trend.
The Momentum Trade That Built the $5,594 Peak Is the Same Trade Now Destroying It
Arthur Parish, metals and mining equity analyst at SP Angel, explained precisely what happened on the way up and why the reversal has been so violent. During the 2025 bull run, which pushed gold up 66% over the course of the year, a massive wave of generalist capital entered the space — systematic hedge funds running momentum strategies, retail money chasing the trend, and macro tourists who had never owned gold before coming in to ride what looked like a structural shift. Central banks were the original architects of the move, accumulating reserves aggressively following the freezing of Russian assets after the Ukraine war. That institutional buying drove the first leg higher. Then the momentum crowd piled in on top.
That money was never strategically positioned in gold. It was positionally leveraged on the trend, and when the trend reversed — when oil-driven inflation crushed rate-cut hopes instead of justifying them — those positions unwound simultaneously. The 3.9% single-day crash to $4,629.29 on Thursday. The 5.4% hit in April futures. Silver futures posting their biggest daily decline since the 1980s at the end of January. These are not fundamental reappraisals. These are overextended speculative positions getting flushed at the same time. Parish was direct about it: the money that came in during the 2025 rally is "not wedded to long-term gold positioning" — and it is leaving the space now. He frames that exodus as actually necessary for gold to build a clean base before taking another leg higher. Daniel Ghali, commodity strategist at TD Securities, confirmed the same view — institutional players pulled back from overstretched bets but the metal could slide further and still remain within its broader bull-market trajectory. That qualification matters enormously for what comes next.
JPMorgan Was at $6,300 Last Month. What Happened to That Thesis?
Just last month, JPMorgan maintained its end-2026 price target for gold at $6,300 per ounce — a target that now looks extraordinarily aggressive given XAU/USD is trading $1,755 below that level. That target has not been formally rescinded, but the speed of the reversal illustrates how quickly consensus can become obsolete when a black-swan geopolitical event lands. The Iran war shifted monetary policy expectations for every major central bank simultaneously, something no base-case model had priced in at the beginning of February.
The structural case that underpinned JPMorgan's $6,300 call has not entirely collapsed — lower rates, central bank accumulation, dollar weakness, and a post-halving crypto rotation into hard assets were the pillars. Most of those pillars are now delayed rather than destroyed. But $6,300 by December 2026 requires a recovery from $4,545 of roughly 38.6% in nine months — a move that is only possible if the macro environment shifts materially in gold's favor in H2 2026. The 1-year algorithmic price prediction sitting at $6,865.55 — implying 51% upside from current levels — makes the JPMorgan target look conservative by comparison. Neither number is reachable without a fundamental shift in the rate and dollar environment.
Azuria Capital's Long Game: U.S. Debt at $39 Trillion and the Case for a Structural Floor
Tavi Costa, CEO of Azuria Capital, is not panicking. His framework for gold has nothing to do with week-to-week price swings caused by war headlines and oil futures. The core argument starts with U.S. national debt, now exceeding $39 trillion — and with the fiscal cost of the Iran war mounting, the $40 trillion mark could arrive before autumn 2026. As the debt load grows, interest payments crowd out other spending, and the political pressure to suppress yields eventually overpowers the economic argument for restraint. Costa's thesis is that central banks will prioritize lower financing costs in the medium term regardless of what inflation data suggest — and that structural reality becomes the dominant tailwind for gold.
The comparison he presented at PDAC 2026 — the world's largest mining convention — is striking: U.S. gold reserves today represent approximately 3% of total federal debt. In the 1940s, that ratio was 51%. That is not an argument for gold today in isolation. It is an argument that gold is historically and structurally underrepresented relative to the monetary base it is supposed to anchor. If sovereign debt risks continue to compound — and there is no credible mechanism to reverse a $39 trillion trajectory in any near-term timeframe — the long-term bid for gold is structural, not cyclical. Azuria's presentation at PDAC explicitly framed gold as part of a historical turning point for tangible assets — one that is, by this reading, still early. Despite the 66% surge in 2025 and the current selloff, the sector remains underrepresented in most institutional portfolios relative to where the macro backdrop argues it should be.
The supply argument reinforces this. At PDAC, data showed there have been practically no significant new mining discoveries in the past two years — an extraordinary finding in modern mining history. Exploration investment was suppressed for years while gold traded below incentive prices. That pipeline failure does not show up in spot prices today. It shows up in production volumes two to five years from now. A tightening supply profile against rising structural demand from central banks and fiscal-stress-driven allocations is not a narrative. It is arithmetic.
Central Bank Reserve Reallocation: The Buyer That Does Not Panic-Sell
The most durable support mechanism for gold — the one that does not show up in hourly price charts but has been quietly building since 2022 — is central bank reserve reallocation. Emerging market central banks have been systematically shifting reserves away from U.S. Treasuries and toward physical gold. This trend accelerated after the freezing of Russian assets demonstrated that dollar-denominated reserves are subject to geopolitical confiscation risk. That lesson has not been forgotten in Beijing, Riyadh, New Delhi, or Ankara.
Azuria Capital flags this as a decisive structural factor because it creates a source of demand that does not depend on Western investor sentiment, hedge fund momentum, or retail fear-and-greed cycles. Central bank buying does not panic when the RSI drops to 25. It buys at $4,545 the same way it bought at $2,000 in 2023. The critical implication is that the current selloff — driven by speculative momentum unwinding — is occurring against a backdrop of structural demand that has not reversed and shows no signs of reversing. When the momentum crowd finishes its exit, the patient structural buyers are the ones left setting the next price floor.
Read More
-
FDVV Slips Near $60 as the "High Dividend" ETF's Hidden Tech Top — NVIDIA, Apple, Microsoft — Gets Caught in the AI Air Pocket
26.06.2026 · TradingNEWS ArchiveStocks
-
IBIT Drives Bitcoin ETF Flows Negative for 2026 as $7.2B Exits Across Two Record Streaks — But On-Chain Data Says Cyclical, Not Structural
26.06.2026 · TradingNEWS ArchiveCrypto
-
Natural Gas Holds $3.30 on Expiry Day as Next Week's Heat Wave Overpowers a Bearish Storage Print and Record Production
26.06.2026 · TradingNEWS ArchiveCommodities
-
Dollar-Yen Grinds to 40-Year Highs Near ¥161.70 as the Warsh Fed Keeps the Rate Gap Wide and Tokyo's Intervention Threat Loses Its Bite
26.06.2026 · TradingNEWS ArchiveForex
Mining Stocks: Newmont (NEM) Down 8.6%, But the Margin Story Has Not Changed
Newmont (NEM) took an 8.6% hit Thursday in one of its worst single-session performances in recent months. The materials sector broadly lost 2.3%. These moves are mechanical reflections of spot price pressure — when gold drops 3.9% in a session, leveraged equity exposure to the metal loses more on a percentage basis, which is exactly what mining stocks did. But the underlying operating picture for producers has not deteriorated in proportion to the share price move.
Azuria Capital's PDAC presentation highlighted the disconnect between metal prices and mining valuations directly. Despite gold and silver having delivered 66% and 135% gains respectively in 2025, numerous producers continue to trade at comparatively moderate valuation multiples. The market's skepticism — the lingering doubt about whether elevated precious metal prices can be sustained — is exactly what keeps these multiples compressed. At the same time, many producers are generating margins that would be exceptional in any other industry, with current production costs sitting significantly below spot prices even at $4,545. A producer with all-in sustaining costs of $1,200–$1,400 per ounce — representative of Tier 1 operators — is generating $3,100–$3,300 in gross margin per ounce at current spot prices. That is not a marginal business. That is a cash machine that the equity market is discounting far more aggressively than the fundamentals justify. NEM at current levels, for those with a 12–18 month conviction frame, is being offered at a meaningful discount to its intrinsic earnings power.
Silver's Structural Problem: The Industrial Cycle Is Not Cooperating
Silver's 10%+ weekly loss and its ongoing underperformance relative to gold reflect a specific vulnerability that gold does not share. Silver's dual role — as both a monetary metal and an industrial input for electronics and solar manufacturing — makes it acutely sensitive to the global growth outlook. In a stagflationary environment where inflation is rising but growth is slowing, silver loses the industrial demand argument that distinguished it from gold during the 2025 bull run when it surged 135% to massively outperform its yellow counterpart.
Silver at $71.62 spot, oscillating between positive and negative territory through Friday morning before settling deeper in the red, is a higher-beta, more volatile expression of the precious metals thesis — and that beta cuts both ways. It overshoots to the downside in risk-off environments with thin liquidity, and it overshoots to the upside when conditions turn favorable. The Friday session illustrated this perfectly — silver futures were showing 0.8% gains at the same moment spot was printing 1.7% lower, a divergence that reflects derivatives market distortion more than genuine fundamental disagreement. For new entries, waiting for dollar stabilization and a confirmed yield plateau makes more sense than chasing a metal that is simultaneously losing its monetary narrative and its industrial narrative in the same macro environment.
The $4,350–$4,400 Zone: Where the Long-Term Bull Market Gets Tested
The SMA-200 at $4,359.32 is the line that separates a severe correction within an intact bull market from a structural breakdown. Every major bull market in gold's history has at some point revisited the 200-day moving average, shaken out weak holders, and then resumed the primary trend. The current selloff from $5,594 to $4,545 is painful but not unprecedented in the context of a multi-year secular bull run. Gold dropped from its January record to lows around $4,500 — a support area that has now been tested multiple times in the past week and has held on a closing basis, providing the first tentative evidence of buying interest at these levels.
If the SMA-200 breaks and gold closes below $4,350 on a weekly basis, the calculus changes materially. That would represent a 22%+ drawdown from the all-time high, a level that would force institutional reassessment of the entire thesis. The next major support below $4,350 is in the $4,100–$4,200 zone — old resistance that became support during the 2025 breakout. A test of those levels would require a sustained deterioration in both the geopolitical and monetary environment simultaneously. It would also represent gold trading below both the current spot price of oil-equivalent inflation-adjusted metrics, which historically has attracted aggressive central bank accumulation.
The more likely scenario is that the $4,350–$4,400 band holds, accumulation resumes, and gold begins rebuilding structure in the $4,400–$4,750 range through Q2 2026 before a directional move becomes clear in H2. The 3-month algorithmic target of $5,238.73 requires exactly this kind of base-building — a period of consolidation followed by a catalyst-driven move. The catalyst calendar is not empty: the Fed chair transition in May, potential Iran conflict de-escalation, and any dovish shift in the dot plot could all serve as triggers within the next 90 days.
The Fed Chair Transition in May: The Hidden Catalyst for XAU/USD Recovery
The single most underappreciated catalyst for a gold recovery in 2026 is the Federal Reserve chair transition scheduled for May. Jerome Powell's term as chair ends May 15. Trump's presumed nominee, Kevin Warsh, has signaled a more accommodative approach to monetary policy and a greater tolerance for inflation overshoot to support growth. If Warsh is confirmed and his first communications signal any shift toward easing — even a softening of rate-hike language — gold's rate-sensitivity argument flips from headwind to tailwind overnight. The 6-month price target of $5,361.98, representing 18% upside from $4,545, maps almost exactly onto the window where a post-confirmation policy pivot would begin to feed through into markets. The 1-year target at $6,865.55 — a 51% gain from here — is the scenario where the rate pivot is decisive and the Iran conflict has resolved, freeing global growth to recover and the dollar to weaken. Both conditions are plausible within a 12-month window. Neither is guaranteed within the next 30 days.
The Verdict on XAU/USD: HOLD with Defined Accumulation Parameters and Zero Urgency to Buy Today
Gold at $4,545–$4,680 is not a buy today. The short-term technical structure is broken — the metal is 10% below both the SMA-20 and SMA-50, the RSI is at 25.53 but can remain depressed in sustained downtrends for weeks, and the macro environment with a hawkish Fed, dollar strength, rate hike odds at 24%, and surging oil prices has not resolved. Seven consecutive sessions of losses. A weekly drawdown of 9%. Momentum funds still in the process of exiting. Exchange-traded instruments like ETFs experiencing structural outflows. Buying into that setup before stabilization is confirmed is capital destruction dressed up as contrarianism.
The accumulation window opens between $4,350 and $4,450 — on a weekly closing basis above the SMA-200, with a stop awareness below $4,300. That range represents the intersection of the long-term moving average, the historical breakout zone from the 2025 bull run, and the level where central bank structural buyers historically accelerate their purchasing. Scaling into a position in that zone — not committing fully at one price — is the disciplined approach to what remains a structurally intact multi-year bull market that has temporarily been derailed by a momentum flush compounded by the sharpest geopolitical oil shock since 2022.
The 12-month thesis remains intact. U.S. debt approaching $40 trillion, central bank reserve reallocation accelerating away from Treasuries, two years of mining discovery failure tightening future supply, the ECB revising inflation projections upward to 2.6%, the IMF modeling persistent energy price effects on global output, and a Fed chair transition that could flip the monetary narrative entirely in May — these are not factors that disappear because Brent crude spiked to $119 and the speculative momentum crowd exited in a panic. They are the reason gold was at $5,594 in January and the reason it is not staying at $4,545 permanently. The position is HOLD existing positions with defined risk at $4,300 on a weekly close, accumulate between $4,350 and $4,450, 6-month target $5,200–$5,400, 12-month target $6,000+ contingent on a monetary pivot and Iran conflict resolution.


