


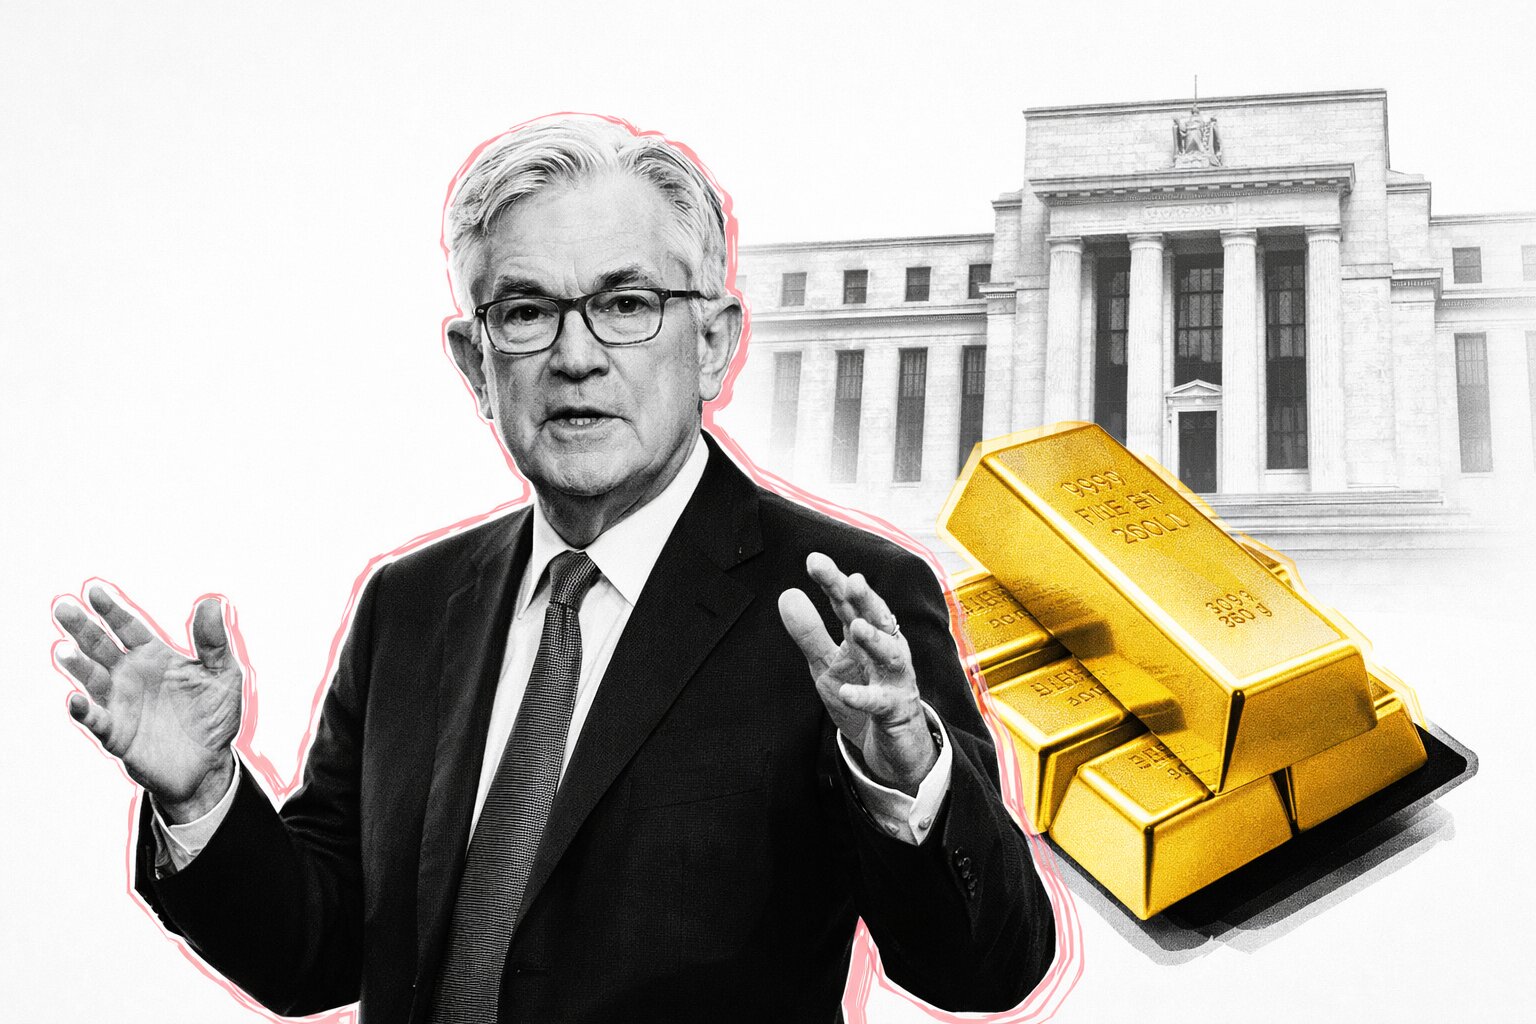
Gold Price Forecast: XAU/USD Stuck at $5,170 Before CPI — Is the $5,500 Target Still on the Table?
XAU/USD swings $330 in 48 hours as oil collapses, the dollar retreats, and February CPI looms — with $5,500 in sight and $4,760 as the floor if the data turns ugly | That's TradingNEWS
Gold (XAU/USD) Price Forecast: War Premium, CPI Jitters, and the $5,500 Target That's Starting to Look Inevitable
XAU/USD Whipsawed Between $5,091 and $5,420 — Here's What's Actually Driving It
The gold market spent the last 72 hours doing what geopolitical commodity markets do best: punishing anyone who held conviction too long. Spot XAU/USD shed 1.5% on Monday, crashing from the $5,220 area to $5,091.62 as oil near $120 a barrel reignited inflation fears, gave the dollar a fresh bid, and crushed rate-cut bets. Twenty-four hours later, the reversal was almost violent — XAU/USD clawed back 1.7% to $5,222.74, with April gold futures outperforming at $5,234.40, a 2.6% single-session jump. As of early Wednesday, March 11, the metal has retreated to the $5,170–$5,180 range as traders sit on their hands ahead of the February CPI print due at 8:30 a.m. ET. That number — not the war, not the dollar, not oil — is the immediate catalyst that determines whether this bounce sustains or fades into another failed rally.
The Oil-Dollar Feedback Loop That Keeps Trapping Gold Bulls
What made Monday's selloff so brutal wasn't geopolitics — it was the secondary effect. With Brent crude threatening $120 and WTI trading uncomfortably close, the market consensus rapidly recalibrated the Federal Reserve's policy path. Higher energy equals stickier CPI, which means the Fed holds longer, which means real yields stay elevated, which means gold loses the tailwind that drove the rally to $5,420 in late January. The dollar index — already a beneficiary of safe-haven flows from Middle East escalation — strengthened further, compounding the pressure on dollar-denominated bullion.
Tuesday's session flipped that logic entirely. Crude oil collapsed more than 10% in a single session after President Trump floated a diplomatic off-ramp in the Middle East. Brent dropped $10.45 to settle at $88.51. WTI fell $10.61 to $84.16. That simultaneous move — crude from near $120 to sub-$90 in a matter of days — wiped out a significant chunk of the inflation risk premium baked into the Fed's projected path. The dollar index responded with a 0.1% retreat to 98.74, and gold immediately caught a bid.
Bart Melek at TD Securities correctly identified the mechanism: when oil retreats, it reduces pressure on the Fed to stay restrictive, and that directly supports XAU/USD by compressing real yield expectations. Jim Wyckoff at Kitco Metals adds the floor argument — as long as active conflict persists in the Middle East, institutional demand for safety won't disappear entirely. Both analyses are simultaneously correct, which is precisely why XAU/USD is trapped in this violent, high-amplitude range rather than trending cleanly in either direction.
Technical Picture for XAU/USD: $5,153 Is the Line in the Sand
The 4-hour chart tells a measured story. A Hammer pattern formed near $5,180.26, a classic signal that buyers stepped in with intention after a flush lower. A Spinning Top pattern near $5,208.41 then appeared at key resistance, reflecting genuine market indecision rather than commitment to direction. MACD is drifting sideways in positive territory — consolidation, not reversal. RSI holds near 55, technically neutral, which means neither overbought conditions nor oversold exhaustion is forcing anyone's hand. MFI is elevated in the upper range, indicating high liquidity and active participation. Both VWAP and SMA20 sit below the current market price, confirming the broader bullish structure remains intact even while the short-term range tightens.
The base case for today calls for long entries on volume above $5,208.41, with a sequence of upside targets at $5,266.41, $5,320.89, $5,370.11, $5,426.67, $5,490.37, $5,548.44, $5,608.39, and ultimately $5,673.36. Stop loss on the long scenario sits at $5,180.26 — tight, but appropriate given the proximity of support. The alternative scenario flips short on volume below $5,153.72, targeting $5,107.72, $5,052.87, $4,996.26, $4,937.88, $4,881.57, $4,821.84, $4,760.74, $4,701.55, and $4,645.91 in succession, with the same $5,180.26 stop. The weekly range forecast is $4,881.57 on the low end and $5,426.67 on the high, with an average around $5,154.12 — a wide band that reflects exactly how event-driven the next five sessions will be.
The Physical Gold Market Is Sending a Different Signal
While futures traders debate CPI scenarios, the physical bullion market is running its own playbook entirely. Dealers in Dubai — one of the primary transit corridors for gold moving into India and other Asian destinations — are currently offering discounts of $10 to $30 per ounce against the London benchmark. That's not a sign of weak demand globally; it's a supply-chain consequence of flight disruptions that have physically stranded metal and kept buyers sidelined in the spot market. MKS PAMP's Nicky Shiels flagged the conflict's "known unknowns" as a direct recipe for continued price volatility, and the Dubai discount dynamic supports that view. When physical and paper markets disconnect like this, volatility in futures tends to amplify rather than dampen.
In Poland, the physical demand story reads entirely differently. Pawel Mazurek, president of the Mazovia Mint, reported that interest in physical bullion jumped sharply following U.S. and Israeli strikes on Iranian territory, with year-on-year growth in individual purchases running 30% to 50%. One- to 50-gram bars and bullion coins are the dominant entry points. Poland has historically lagged its Western neighbors — between 10% and 15% of Polish investors hold gold, compared with German private households estimated to hold 9,000 to 9,300 tonnes, which actually exceeds the Bundesbank's 3,350 to 3,378 tonne reserve position. In Poland the numbers are reversed: the National Bank holds roughly 550 tonnes while private holdings sit at 200 to 500 tonnes. The average Pole held three grams at the start of 2023. The average German held 103 grams.
Globally, private gold ownership is concentrated in South and East Asia. India leads with an estimated 26,000 to 34,600 tonnes, largely held in generational jewelry. China holds 23,000 to 31,000 tonnes, the United States around 26,000 tonnes. Turkey stands out as a regional outlier — the World Gold Council recorded 80 tonnes of purchases there in 2022 alone, driven by inflation that hit 80% annually and deep distrust in the lira.
Read More
-
FDVV Slips Near $60 as the "High Dividend" ETF's Hidden Tech Top — NVIDIA, Apple, Microsoft — Gets Caught in the AI Air Pocket
26.06.2026 · TradingNEWS ArchiveStocks
-
IBIT Drives Bitcoin ETF Flows Negative for 2026 as $7.2B Exits Across Two Record Streaks — But On-Chain Data Says Cyclical, Not Structural
26.06.2026 · TradingNEWS ArchiveCrypto
-
Natural Gas Holds $3.30 on Expiry Day as Next Week's Heat Wave Overpowers a Bearish Storage Print and Record Production
26.06.2026 · TradingNEWS ArchiveCommodities
-
Dollar-Yen Grinds to 40-Year Highs Near ¥161.70 as the Warsh Fed Keeps the Rate Gap Wide and Tokyo's Intervention Threat Loses Its Bite
26.06.2026 · TradingNEWS ArchiveForex
Central Banks Are Accumulating — and That Changes the Floor
Four consecutive years of record central bank gold buying is not a coincidence. Institutions from the ECB to China's People's Bank to India's Reserve Bank have been systematically diversifying away from dollar-denominated reserves amid what Mazurek describes as deepening geopolitical fragmentation. The argument he makes for retail investors mirrors the institutional logic: if sovereign treasuries are hedging with physical gold, the same framework applies at the household level. Patrice Mesnier, founder of Oldenburg Capital Partners in Luxembourg, takes it a step further — he argues that current retail demand isn't purely reactive to headlines. It's the product of a slow, structural erosion of confidence in fiat monetary systems, where gold's fixed scarcity stands in direct contrast to the elastic supply of paper money. That shift in awareness, he argues, persists after the news cycle moves on.
The Fed Path and What CME Probabilities Actually Say
As of now, 95.6% of market participants expect the Fed to hold rates at 3.50% to 3.75% at the March 17–18 meeting. The probability of a cut to 3.25%–3.50% stands at just 4.4%. That's nearly unanimous consensus for a hold, which under normal conditions would pressure XAU/USD by keeping real yields elevated. But this is not a normal conditions environment. Core producer prices rose 0.8% in January — the strongest monthly gain since mid-2025 — and yet gold held its ground as capital rotated from equities into long-duration Treasuries, pushing 10-year yields to their lowest level in four months. That equity-to-bond rotation actually provided gold with an unexpected lift at a moment when the CPI data should have weighed on it.
The broader rate picture for 2026 now puts the first Fed cut at July at the earliest, according to current market positioning. John Belton at Gabelli Funds identifies the central risk clearly: if oil prices reaccelerate from their current $84–$88 range back toward the levels seen earlier this week, the disinflation narrative collapses and rate-cut expectations get pushed further out. That scenario would hit XAU/USD directly. Michael Brown at Pepperstone adds another layer — traders had been aggressively positioned for a rapid conflict resolution, and renewed clashes in Iran complicated those assumptions fast. Every headline out of Tehran carries price risk in both directions.
The Tariff Variable That Most Gold Forecasts Are Underweighting
The Trump administration's invocation of Section 122 to impose universal 10% tariffs is already in the gold price, but perhaps not fully. U.S. Trade Representative Jamieson Greer has signaled those tariffs could rise to 15% following a new Supreme Court ruling. That adds a systemic inflation risk that's separate from the Middle East entirely — it's domestic, structural, and not resolved by a ceasefire. More investors are turning to XAU/USD as a hedge against exactly this kind of policy-driven inflation, and that demand doesn't evaporate if the geopolitical temperature drops.
Thirty-Day Forecast and the $8,356 Outlier
The 30-day forecast range for XAU/USD runs from a monthly low of $4,760.74 to a monthly high of $8,356.00, with an average price of $6,558.37. That upper band is an extreme scenario projection, not a base case — it reflects a full escalation scenario where the Middle East conflict widens, oil returns to crisis levels, inflation expectations become unanchored, and gold enters a true panic bid. The base scenario points to moderate gains driven by geopolitical uncertainty, central bank accumulation, and eventual monetary easing. The constraint on the upside is a strong dollar and rates that remain elevated longer than the market currently prices.
Key events to watch through the end of March: February CPI today (March 11), initial jobless claims on March 12, U.S. GDP second estimate and University of Michigan 5-year inflation expectations on March 13, and the Fed's rate decision alongside February PPI on March 18. Every one of those releases carries the potential to reprice XAU/USD by $100 or more intraday given current volatility levels.
MCX and the Indian Market Dimension
On MCX, gold futures gained approximately 1% Tuesday while silver rallied close to 4%, tracking the same global cues that lifted spot XAU/USD. The rupee-denominated move reflects both the international price action and dollar-rupee dynamics — a softer dollar index reduces import costs for India and eases rupee pressure, which amplifies the effect of global gold gains in local terms. Silver's 4% outperformance relative to gold's 2.8% gain reflects silver's higher beta behavior in risk-on commodity environments. Platinum moved 2.4% higher in the same session, while palladium was the lone laggard, dipping 0.9%.
For Indian buyers watching MCX, the CPI print is the immediate trigger. A softer-than-expected number pulls Treasury yields lower, weakens the dollar, and extends the bullion rally — that's a double benefit for rupee-denominated positions. A hot CPI does the opposite: yields spike, dollar firms, and the dollar index rise compounds the damage in rupee terms. Tracking MCX open interest alongside the U.S. 10-year yield and dollar index gives the clearest real-time read on positioning.
The Verdict: Bullish Structure, But Not a Screaming Buy at $5,170
XAU/USD is a buy on dips, not a chase at current levels. The $5,000 level holds structural importance as a psychological floor, and the 50-day EMA underneath provides a technical backstop. The broader trend remains bullish — central bank accumulation, geopolitical instability, rate-cut expectations building toward mid-year, and tariff-driven inflation risk all support the metal. But the $5,208.41 resistance level needs to break convincingly on volume before the next leg toward $5,266 and $5,320 opens up. Analyst consensus from institutions including JP Morgan, Wells Fargo, UBS, CIBC, Deutsche Bank, and Société Générale projects XAU/USD above $6,000 by end of 2026. Christopher Lewis at FXEmpire puts the near-term target at $5,500 before the year is done, and that level looks increasingly credible if the Fed pivots in July as currently priced. Between here and there, expect red candles, headline-driven whipsaws, and a market that rewards patience over conviction.


