Gold XAU/USD Rips to $4,347 (+3%) on Iran Truce as Falling Yields and a 10-Day-Low Dollar Override the Lost Safe-Haven Bid
Gold hit its highest since June 9 as WTI crashed below $80, the 2-year yield fell to 4.054%, and the dollar slid | That's TradingNEWS
Key Points
- Gold jumped 3.06% to $4,347.54, its highest since June 9, as the Iran deal sank oil and cut rate-hike bets.
- Yields fell across the curve — 10Y to 4.459%, 2Y to 4.054% — and the dollar hit a 10-day low, lifting bullion.
- XAU/USD stays below the 200-day SMA at $4,454; a close above it negates the bearish trend, $4,149 is support.
Gold ripped higher Monday, gapping above $4,300 and tagging $4,347.54 by midday GMT, up $128.98 or about 3.06% on the session, with spot prints clustered around $4,334 and August futures climbing 2.8% to $4,355.30. It's the metal's highest level since June 9, and on the surface it looks backwards: the U.S. and Iran announced a peace framework to end a four-month war, and the ultimate safe-haven asset rallied anyway. The instinct is to call it a haven unwind that should have sent bullion lower. The instinct is wrong.
This rally is a rate trade, not a fear trade, and that distinction is the entire thesis. The peace deal crushed oil, the oil crash gutted inflation expectations, rate-hike bets came off across the curve, and gold — a yieldless asset that lives and dies on the opportunity cost of holding it — caught a bid the moment yields started falling. Layer a dollar sliding to a 10-day low on top, and you have a textbook setup for bullion to run even as the geopolitical risk that usually drives it drains away. The chain reaction ran in real time: lower crude, lower inflation, lower yields, weaker dollar, higher gold. The catch is that the whole move is a corrective bounce inside a broken chart, and it stays that way until gold recaptures its 200-day moving average at $4,454.
The Oil Crash Is the Whole Story
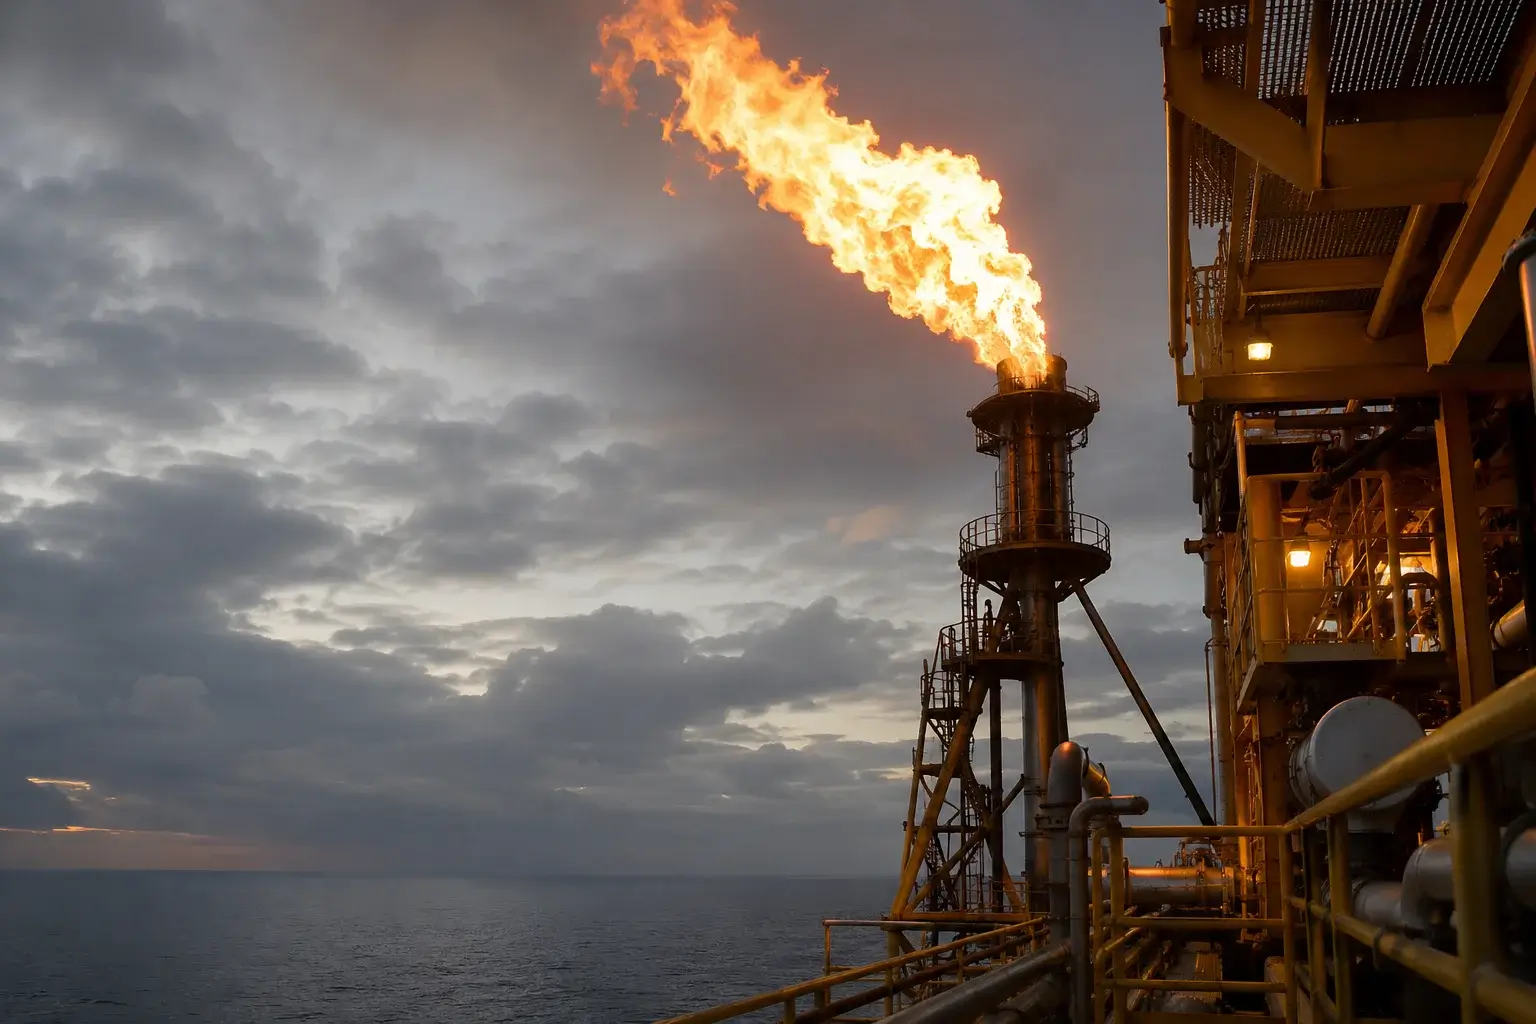
Everything in the gold tape Monday traces back to the oil pit. West Texas Intermediate snapped below $80 for the first time in two months, last down nearly 5% on the session, while Brent slid toward $82.90 a barrel. Crude had carried a fat war premium through four months of conflict — the blocked Strait of Hormuz choked off roughly a fifth of seaborne supply and drove the barrel toward $117 at the peak — and Trump's order to reopen the strait toll-free and lift the naval blockade ripped that premium out in a single session.
That collapse is the disinflationary hammer that changed gold's math. Energy was the single largest driver of the hot inflation prints that had the market pricing a potential Fed rate hike this year. Pull crude down this hard and the inflation outlook resets lower, which pulls forward the case for rate cuts rather than hikes. Gold doesn't need a war to rally — it needs falling real rates, and a crude crash that drags inflation expectations down delivers exactly that. The peace deal didn't kill gold's bid by removing the fear premium. It handed gold a bigger bid by removing the inflation premium that was keeping the Fed hawkish.
Yields Fell Across the Entire Curve
The bond market confirmed the repricing, and it did it from end to end. The 10-year Treasury yield fell more than two basis points to 4.459%, the 2-year dropped over three basis points to 4.054%, and the 30-year edged lower to 4.958%. When all three points on the curve move lower in the same session, the message is that the repricing is broad — not just the front end adjusting to a shifted Fed path, but the whole structure pulling rate expectations down.
Gold rides falling yields rather than fighting them. As a non-interest-bearing asset, every basis point that comes out of Treasuries lowers the opportunity cost of parking money in bullion instead of a yielding instrument, and the metal mechanically becomes more attractive. The 2-year's three-basis-point drop is the tell that matters most — that maturity is the cleanest read on near-term Fed expectations, and money pulling it lower says the rate-hike fear that had pressured gold for weeks is unwinding. The oil crash lit the fuse, the bond market carried the signal, and gold did what it does when real rates fall: it ran.
The Dollar Slid to a 10-Day Low
The currency leg added the second tailwind. The U.S. Dollar Index hovered near a 10-day low as the peace framework pulled haven flows out of the greenback, with the euro climbing to around $1.1610, the British pound trading near $1.3423, and the Japanese yen holding relatively stable near 160. The same risk-on rotation that drained the dollar's safety bid fed straight into gold's strength.
The dollar relationship is mechanical and it's powerful. Gold is priced in dollars, so a weaker greenback makes every ounce cheaper for buyers outside the United States — and that foreign bid was visible across the session. A strong dollar keeps gold capped; a soft one releases the brake. With the index pressing 10-day lows, the metal got a discount-driven flow on top of the rate-driven flow, and the two reinforced each other. Risk-on usually means money leaves gold for stocks. This time risk-on meant a softer dollar and lower yields, and both of those are bullish for bullion regardless of where equities go.
From $4,000 YTD Lows Into the Bounce
The bounce reads differently once you see where it started. Gold hit year-to-date lows near the $4,000 threshold last week — a nearly seven-month low around $4,023 — as the war kept oil elevated, inflation fear climbed, and the rate-hike narrative pinned the metal down. By Friday it was grinding around $4,200, having tagged an intraday high of $4,246 before the peace developments crystallized over the weekend.
That context defines the character of Monday's move. A 3% pop off a multi-month low is a market clawing back ground it surrendered in a downtrend, not an index breaking out from strength. The $4,000 area held as the floor where buyers stepped in to defend the metal, and the peace catalyst gave them the cover to press the rebound. The reclaim above $4,300 erased the worst of last week's damage, but it left gold still sitting below every moving average that matters — and that's the line between a corrective bounce and a genuine trend turn.
The Technical Wall: $4,425 and $4,454
The chart frames the stakes with two hard numbers. The 20-day moving average sits around $4,425, and the 200-day runs at $4,454 — and gold needs to recapture that 200-day line to negate the near-term bearish outlook. Until it does, every rally is corrective within a broader downswing, no matter how sharp the daily candle looks. Monday's high at $4,347 left the metal roughly $100 below the level that would flip the structure, which is close enough to matter and far enough to doubt.
The momentum gauges had been weak heading in. The Relative Strength Index sat near 35 on the daily chart on Friday — subdued upside momentum, not the kind of thrust that signals a reversal — while an elevated Average Directional Index near 35 said the prevailing downtrend remained technically strong even as volatility compressed. The bounce is working those readings higher, but a single 3% session doesn't repair a downtrend that the indicators confirm is intact. Price holding below the 20-day, the 100-day, and the 200-day all at once is the definition of a metal in a downswing catching a relief bid. Clear $4,454 on a closing basis and the conversation changes. Stall beneath it and the bounce is just a bounce.
The Support That Has to Hold
Underneath, the levels that define the risk are sharp. Initial support sits near the lower Bollinger Band around $4,149, the first shelf where buyers would be expected to step back in on a pullback. Below that, the $4,000 area is the substantial horizontal demand zone — the floor that held last week and the line that buyers would defend hard on any deeper retracement.
The asymmetry into the Fed is the thing to respect. The upside to the $4,454 resistance is roughly the same distance as the downside to the $4,149 first support, and the catalyst that resolves the direction lands Wednesday. A market this balanced beneath a stack of moving averages, bouncing off a year-to-date low, is one Fed tone away from either confirming the recovery or rolling back over toward $4,000. Lose $4,149 and the $4,000 defense gets tested again; hold it and the metal keeps grinding toward the moving-average wall overhead.
Silver and Platinum Joined the Party
The strength wasn't gold-only, which backs the read that this is a broad precious-metals repricing rather than an isolated bullion move. Silver surged 3.3% to $70.30 per ounce, and platinum climbed 3.2% to $1,777. When the whole complex moves together on the same catalyst, it confirms the driver is macro — the rate and dollar repricing — rather than something specific to gold's positioning.
Silver's outperformance carries its own signal. The metal's heavier industrial demand profile means it tends to run harder than gold when the macro backdrop turns risk-on and growth fear eases, so a 3.3% silver rip alongside gold's 3% move reads as a market pricing both lower rates and a less threatening growth picture once the war premium clears. Platinum's parallel jump rounds out a complex moving in lockstep. The precious-metals crowd is treating the peace framework as a green light, and the breadth across silver and platinum says the rate-trade thesis has legs beyond the headline metal.
The Miners and the Leveraged Bid
The move in the metal feeds straight into the equity complex built on top of it. The senior producers and the mining ETFs carry leverage to the gold price — a 3% move in bullion typically translates into a larger swing in the miners, because the metal's gain drops through to margin on relatively fixed production costs. The gold-miner names and the broad mining baskets that track the sector get the amplified version of whatever the metal does, and a session like Monday's is the kind that lifts the entire group.
The physical-backed funds give the cleaner read on flows. The large bullion ETFs hold metal directly, so demand into those vehicles is a direct vote on the rate-and-dollar thesis driving the spot price. The relationship runs both ways through a session like this: the metal's rally lifts the funds and the miners, and sustained inflows into the funds would confirm that the bid is real money rather than a short-covering blip off the lows. The leverage cuts in reverse too — if gold rolls back toward $4,000 on a hawkish Fed, the miners give back more than the metal. For now the complex is riding the same rate trade that's powering the spot price.
Read More
-
Micron Charges Toward $1,089 as the HBM Boom Reignites — Trillion-Dollar Memory Stock Faces a Binary June 24 Earnings Test
15.06.2026 · TradingNEWS ArchiveStocks
-
XRP-USD Climbs to $1.19 as Iran Truce Lifts Crypto — XRP's $1 Billion ETF Bid Meets a Stubborn $1.30 Ceiling
15.06.2026 · TradingNEWS ArchiveCrypto
-
Crude Collapses as Hormuz Reopens — WTI Breaks $80, Brent Hits $83, and the $117 War Premium Unwinds Toward $70
15.06.2026 · TradingNEWS ArchiveCommodities
-
FDMO's 39% Year Rides the AI Momentum Trade — and the June Volatility Tested It
12.06.2026 · TradingNEWS ArchiveMarkets
-
Pound Climbs Above 1.3450 on Iran Truce as Dollar Weakens — But a Contracting UK Economy Caps Cable Into a Fed-BoE Week
15.06.2026 · TradingNEWS ArchiveForex
Why a Peace Deal Lifted the Ultimate War Hedge
The paradox is worth sitting with because it explains the conviction behind the move. Gold is the asset money runs to when the world looks dangerous, so the reflex says a peace deal should drain its bid. That reflex misses how the metal actually trades in a rate-driven market. The war premium in gold was always smaller than the war premium in oil — and the oil premium, once it collapsed, did more for gold through the inflation-and-rate channel than the loss of the fear bid took away.
The structural backdrop reinforces it. Central-bank demand has been a persistent floor under gold through this entire stretch, the kind of steady official-sector buying that doesn't flinch on a single geopolitical headline. So when the war premium cleared and the rate math flipped bullish, the metal had a foundation to bounce from rather than a vacuum to fall into. A presidential peace announcement in the Middle East catalyzing a gold rally would have sounded absurd a few years ago. In a market where gold trades as a rate instrument first and a fear instrument second, it's the logical outcome — cheaper oil, lower yields, softer dollar, higher gold.
The Fed's Dot Plot Is the Real Test
Everything hinges on Wednesday. The FOMC convenes June 16-17, and while a hold is fully priced — leaving the target range unchanged — the decision itself is the sideshow. The main event is the updated economic projections, the dot plot that maps where policymakers see rates heading, landing at Kevin Warsh's first meeting as chair. That projection is what validates or kills the rate-cut hope fueling gold's bounce.
The fork is clean. If the dots and Warsh's tone lean toward an easier path — acknowledging that the oil crash has reset the inflation outlook and that cuts are back in play — gold gets the confirmation it needs to press through $4,425 and challenge the $4,454 line that would flip the structure bullish. If the projections stay hawkish, holding firm on higher-for-longer because the hard inflation data hasn't yet caught up to the oil move, the rate trade that powered Monday's rally reverses, yields back up, the dollar firms, and gold rolls back toward $4,149 and the $4,000 floor. The metal is betting the Fed validates the disinflation the oil market just priced. Warsh delivering that confirmation 48 hours into the move is the bull case. A new chair refusing to get ahead of the data is the bear case.
Forecast: A Corrective Bounce Until $4,454 Gives Way
The honest verdict holds the tension at the center of the session. Short-term, gold is strong and the drivers are real — oil cratered, yields fell across the curve, the dollar slid to a 10-day low, and silver and platinum confirmed a broad precious-metals repricing. This is a 3% rally with genuine macro fuel behind it, not a hollow spike, and the $4,000 floor that held last week looks like a durable base.
The structure keeps it corrective until proven otherwise. Gold remains below the 20-day at $4,425, the 100-day, and the 200-day at $4,454, with momentum gauges that flagged a downtrend still technically intact and an RSI that started the bounce near 35. The base case is a grind between $4,149 support and the $4,425-$4,454 moving-average wall into the FOMC, with Wednesday's dot plot the trigger that resolves it. The bull path: a dovish projection set, a close above $4,454, and the door opening toward higher recovery targets as the downtrend breaks. The bear path: a hawkish hold, rejection at the moving averages, and a slide back toward $4,000. Until gold reclaims $4,454 on a closing basis, this is a rate-driven relief rally inside a downswing — powerful, well-supported, and still unconfirmed.